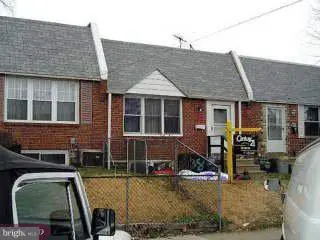
138 Fronefield Ave · Linwood, PA
Flood risk 3/10 · Minor
- FEMA flood zone
- X (unshaded)
- Chance of flooding over 30 yrs
- 0.2%
- Est. flood insurance / yr
- $473 – $860
Fire risk 1/10 · Minimal
- Est. fire insurance / yr
- $511 – $949
Heat risk 7/10 · Major
- Hot days now (above 104°F)
- 7 days/yr
- Hot days in 30 yrs
- 15 days/yr
Wind risk 6/10 · Moderate
- Chance of severe wind over 30 yrs
- 27.0%
Air-quality risk 4/10 · Minor
- Unhealthy air days now
- 4 days/yr
- Unhealthy air days in 30 yrs
- 7 days/yr
Risk factors via First Street. Map © Google.
Why this score? — see what drove the B- grade
The composite is a weighted blend of 9 inputs, each scored 0–100. Each bar is that input's sub-score; the figure is the points it added to the 100-point composite (weight × sub-score).
- Cash flow +30.0/30.0
- 1% rule +10.0/10.0
- DSCR +10.0/10.0
- ARV discount +7.5/15.0
- Livability +4.0/5.0
- Rent growth +3.0/5.0
- Schools +2.7/10.0
- Condition / age +2.5/5.0
- Appreciation +0.0/10.0
$69,000
🖨 Deal sheet (PDF) 📄 Offer letter ✓ Due diligence
Listing remarks MLS
Cute Marshall Terrace Row has Lr w/ vaulted ceiling, 2 BR and updated bath on 2nd level, kit, dining area, bedroom and powder room on lower level, unfinished basement, newer roof and heater, some new windows, fenced in rear yard. washer and dryer included in "as-is" condition. * * 1 Year AON Home Warranty Included For Buyer * *
Key facts
- Built 1950
- Listed 6 days
Property features AI
Exterior
- Parking: On-street parking
- Utilities: Public water; Public sewer; Natural gas service
- Home design: Interior townhouse/rowhouse; Fee simple ownership
- Construction: Brick construction; Foundation: other; Above-grade finished area approximately 720 (source: assessor)
- Exterior features: Lot dimensions approximately 20 x 96
Interior
- Bedrooms: 3 bedrooms on the main level
- Bathrooms: One full bathroom; One half bathroom
- Heating & cooling: Forced air heating; Cooling: other (unspecified); Hot water heated by natural gas
- Interior features: Basement present (other type)
Neighborhood map
What this means for you Summary
Snapshot
- This is a 3-bed/1.5-bath townhouse listed at $69k.
Deal economics
- At list price, monthly cash flow is $869 ($10k/yr) — positive.
- The deal already cash-flows at list — no discount required.
- Meets the 1% rule at list price ($2k rent vs $69k).
Location & tenants
- Location reads 79/100 on livability (#234 in PA, #2,020 nationally) — a middle-class / working-renter tenant base. Strengths: cost of living A+, housing A+, crime A; Watch: commute D+, amenities F.
- Chichester SD (suburban): math 19% / reading 41% proficiency, ranked #438 of 539 in PA (top 81%) — families likely to look elsewhere, expect single-tenant / working-renter base with shorter leases.
- Zoned schools: Chichester Ms (math 8% / reading 38%, grade F, #426 of 512 statewide, top 83%, 952 students, 100% FRL); Chichester Shs (math 47% / reading 15%, grade F, #340 of 437 statewide, top 78%, 996 students, 90% FRL) — zoned schools average 95% FRL vs 52% district-wide (43 pts higher); higher-poverty schools than district average — tighter screening recommended.
- Market conditions: Rents rising (+1.8%/yr); 70 active listings in the ZIP; 6 comparable units currently listed for rent nearby; rentals at typical pace (median 26d on market — plan ~3-4 weeks tenant-placement turnaround); solid renter incomes; 299 units permitted in Delaware County in 2024 (5 in 5+ unit buildings).
Forward outlook
- Local home prices are declining (-3.0%/yr); year-one equity from $477 of loan paydown is wiped out by about $2k of value loss. Plan a longer hold.
- At projected returns (-3.0% appreciation + 1.8% rent growth), your $19k cash investment doubles in ~3 years — after that, you're playing with house money.
Negotiation context
- Only 6 days on market — expect competitive offers; lowballing is unlikely to land.
- 2 sale attempts since 21y ago with the ask held roughly flat each time — persistent listings suggest the price (not the market) is what's stuck; bring a comps-based counter.
Risks & watch-outs
- Watch-outs: built in 1950 — expect roof / HVAC / electrical / plumbing capex.
- Climate carrying-cost: major wind risk, 27% chance of damaging wind over 30y; extreme-heat days projected 7→15/yr by 2055 (HVAC capex compounding) — expect insurance premiums to compound above CPI over the hold.
Questions for the listing agent
- Built in 1950 — when were the roof, HVAC, electrical panel, plumbing, and water heater last replaced?
- Is there a deadline driving the sale (1031 exchange, divorce, estate, relocation)? That informs how much negotiation room exists.
- What's the average days-on-market for RENTAL listings here right now (not sales)? A rising rental-DOM trend means longer vacancies and softer asking-rent achievability than the comps imply.
- What's the recent tenant-quality profile in this submarket — average credit score on applications, eviction rate, late-payment / NSF rate, and stable-employment percentage? A property-management company in the area should have these aggregated.
- How much new for-sale + rental construction is in the pipeline within 1–3 miles? Heavy new supply typically softens prices + rents 12–24 months out; constrained supply supports both.
Investment metrics
- 1% rule
- 2.44% ✓
- Cap rate
- 21.40%
- Cash-on-cash
- 53.97%
- DSCR
- 3.40
- GRM
- 3.4
CMA / ARV
- ARV (on-the-fly)
- $195,120
- Comps found
- 12
Show comp detail 12 sales within ~0.75 mi
| Address | Dist | Beds/Ba | Sqft | Sold | Price | $/sf | Match |
|---|---|---|---|---|---|---|---|
| 105 Fronefield Ave | 0.07mi | 3/1.5 | 720 (0%) | 1mo | $146,000 | $203 | 96 |
| 1542 Summit St | 0.11mi | 3/1.5 | 720 (0%) | 0mo | $200,000 | $278 | 95 |
| 135 Ervin | 0.07mi | 3/1.5 | 720 (0%) | 5mo | $118,000 | $164 | 93 |
| 1556 Summit St | 0.10mi | 3/1.5 | 720 (0%) | 4mo | $216,000 | $300 | 92 |
| 119 Chadwick Ave | 0.11mi | 3/1.0 | 720 (0%) | 2mo | $213,000 | $296 | 91 |
| 111 Ervin Ave | 0.08mi | 3/1.5 | 720 (0%) | 10mo | $196,000 | $272 | 88 |
| 163 Chadwick Ave | 0.12mi | 3/1.5 | 720 (0%) | 9mo | $175,000 | $243 | 87 |
| 156 Fronefield Ave | 0.03mi | 2/1.5 (-1) | 720 (0%) | 8mo | $160,000 | $222 | 87 |
| 332 White Ave | 0.30mi | 3/2.0 | 720 (0%) | 2mo | $230,000 | $319 | 82 |
| 1412 Simpson St | 0.26mi | 3/1.0 | 720 (0%) | 7mo | $195,000 | $271 | 80 |
| 325 White Ave | 0.30mi | 3/1.0 | 720 (0%) | 6mo | $179,900 | $250 | 79 |
| 2514 Thomas Ave | 0.64mi | 2/1.0 (-1) | 800 (+11%) | 9mo | $170,000 | $213 | 38 |
Match score weights: distance 35% · size 25% · config 20% · recency 20%. Top-matched comps best support the ARV.
Projected returns pro-forma
-3.0% appreciation · 1.83% rent growth · sell at horizon
- IRR
- 50.8%
- Equity multiple
- 3.19×
- Total profit
- $42,215
- Equity at exit
- $10,288
- IRR
- 55.7%
- Equity multiple
- 6.19×
- Total profit
- $100,227
- Equity at exit
- $5,966
Cash invested: $19,320 (down + closing). Projections, not guarantees.
Landlord ↔ Tenant lean methodology
- Overall (STATE)
- 62 Landlord-Friendly
- State Pennsylvania
- 62 Landlord-Friendly · EVEN
- County
- — inherits STATE
- City
- — inherits STATE
ZIP-level market 19061
- Rents YoY
- 1.8%
- Active inventory
- 70
- Price-to-rent
- 3.4×
Monthly cashflow live
- Estimated rent
- $1,685 high interval (Pro) →
- Mortgage (P&I)
- −$362
- Tax from tax record
- −$72 /mo · $863/yr
- Insurance
- −$29
- HOA
- −$0
- Vacancy / Maint / Mgmt
- −$354
- Net cashflow
- $869
Break-even live
Sensitivity live
| Price | -10% $908 | -5% $888 | +0% $869 | +5% $849 | +10% $830 |
|---|---|---|---|---|---|
| Rent | -10% $736 | -5% $802 | +0% $869 | +5% $935 | +10% $1,002 |
| Rate | -1.0pp $904 | -0.5pp $886 | base $869 | +0.5pp $851 | +1.0pp $833 |
UW: 25.0% down · 7.5% · 30yr · 1.5% tax · 5.0% vac · 8.0% maint · 8.0% mgmt
Financing live
Cash to close
- Down payment
- $17,250
- Closing costs
- $2,070
- Reserves months
- —
- Total cash needed
- —
Loan-product check · same deal, 3 products live
Conventional
25% down · 7.5% · 30yr
- Down + closing
- —
- Monthly P&I
- —
- Monthly cashflow
- —
- DSCR
- —
- Eligible?
- —
Personal DTI + credit; lowest rate.
DSCR
20% down · 8.5% · 30yr
- Down + closing
- —
- Monthly P&I
- —
- Monthly cashflow
- —
- DSCR
- —
- Eligible?
- —
No personal income docs; deal must DSCR.
Hard money
10% down · 12.0% · 12mo
- Down + closing
- —
- Monthly P&I
- —
- Monthly cashflow
- —
- DSCR
- —
- Eligible?
- —
Short-term bridge; refi at stabilization.
Rent comps 6 comps
| Address | Beds | Baths | Sqft | Rent | $/sqft | DOM | Units | Dist |
|---|---|---|---|---|---|---|---|---|
| 117 Ervin Ave Marcus Hook, PA | 3.0 | 1.5 | 720 | $1,595 | $2.22 | 22d | 1 | 0.08mi |
| 1006 Keystone Rd Unit 1 Chester, PA | 2.0 | 1.0 | 750 | $1,200 | $1.60 | 0d | 1 | 1.13mi |
| 1006 Keystone Rd Chester, PA | 2.0 | 1.0 | 750 | $1,200 | $1.60 | 25d | 1 | 1.13mi |
| 1107-1115 Keystone Rd Chester, PA | 2.0 | 1.0 | 700 | $1,250 | $1.79 | 45d | 1 | 1.14mi |
| 908 Keystone Rd Chester, PA | 2.0 | 1.0 | 750 | $1,200 | $1.60 | 45d | 1 | 1.17mi |
| 3360 Chichester Ave Boothwyn, PA | 1.0–2.0 | 1.0–2.0 | 725 | $1,700 | $2.34 | 0d | 26 | 1.37mi |
Listing history 5 events
-
2026-06-16status $69,000 Pending 6 DOM
-
2026-06-15days on market $69,000 Active 6 DOM
-
2026-06-13days on market $69,000 Active 4 DOM
-
2026-06-13days on market $69,000 Active 3 DOM
-
2026-06-10$69,000 Active 1 DOM
ⓘ Source: listings_history table (triggers on properties + properties_extension) + one-shot
backfill from property_details.listing_events for pre-trigger history.
Tax reassessment forecast PA · Partial reset (capped growth)
- Current annual tax
- $863 · $72/mo
- Projected year-2 tax
- $977 · $81/mo
- Expected delta
- +$114/yr (+$9/mo · 13.2%)
ⓘ Screening estimate from a state-policy table — verify with the county assessor before closing.
Climate risk First Street
- Flood 3/10 Moderate FEMA zone X (unshaded) · 20% chance over 30 yrs
- Wildfire 1/10 Low
- Heat 7/10 Severe 7 d/yr ≥104°F today · 15 d/yr by 30 yrs out
- Wind 6/10 Major 27% chance of damaging wind over 30 yrs
- Air quality 4/10 Moderate 4 unhealthy d/yr today · 7 by 30 yrs out
Nearby sold comps map
Loading sold comps map…
Walkable amenities ~0.75 mi
Loading nearby amenities…
Taxation est. · year 1
- Rental income
- $20,224
- − Mortgage interest
- −$3,865
- − Property taxes
- −$863
- − Insurance
- −$345
- − Repairs & maintenance
- −$1,618
- − Management
- −$1,618
- − Depreciation
- −$2,007
- Taxable income
- $9,908
- Est. tax owed @ 24.0%
- −$2,378
- After-tax cash flow
- $8,049/yr
For passive investors: Depreciation is non-cash, so a rental often shows a tax loss while cash-flowing — sheltering income. Rental losses are passive: they offset passive income freely, and up to $25,000/yr can offset ordinary (W-2) income if you actively participate and your MAGI is under $100k (phasing out to $0 by $150k); unused losses carry forward. On sale, claimed depreciation is recaptured at up to 25%, and gains may owe capital-gains tax (a 1031 exchange can defer both). Figures are a year-1 estimate at your 24.0% rate — not tax advice; consult a CPA.
Schools (NCES district)
- District
- Chichester SD
- NCES district ID
- 4205910
- Math proficiency
- 19% ▼ -12.00%
- Reading proficiency
- 41% ▼ -17.00%
- Median HH income
- $57,612
- Composite
- 26.84/100
- National rank
- #7110
- State rank
- #438 of 539 in PA
Livability — Linwood
- Score
- 79/100
- State rank
- #234
- US rank
- #2020
Category grades
Schools grade is shown separately in the Schools card above.
Census & demographics
- Census place
- Linwood, PA
- County
- Delaware County · 399,863 people
- City population
- 20,135
- Metro
- Philadelphia-Camden-Wilmington, PA-NJ-DE-MD
- Population (ZIP)
- 19,896
- Household income
- $82,005
- Rent vs Own
- Severe rent burden
- 612.0
Population outlook (Delaware County) Hauer SSP2
- Today (2025)
- 577,490 people
- By 2030
- 581,243 · +0.6%
- By 2040
- 584,700 · +1.2%
- By 2050
- 586,581 · +1.6%
- By 2075
- 598,706 · +3.7%
- By 2100
- 590,823 · +2.3%
Race, ethnicity, and origin ACS 2023
- Neighborhood character
- Predominantly White (74%)
- Race & ethnicity
- White 74% Black 11% Hispanic / Latino 5% Two or more races 5% Asian 4%
- Hispanic origin (detail)
- Mexican 1% Puerto Rican 2%
- Common ancestry
- Romanian 5% Subsaharan African 3% Polish 2%
- Foreign-born
- 8% · Canada, China, South Korea
- Languages at home
- 90% English-only · Spanish 3% Chinese 3% Other Indo-European 1%
Political lean MEDSL · Delaware
- 2024 margin
- Strong D (+23.7) · D 61.4% · R 37.6% · Other 1.0%
- 2008→2024 swing
- +2.3pp toward D · 2008: 21.4pp · 2024: 23.7pp
- All cycles
- 2024: D+23.7 2020: D+26.7 2016: D+22.0 2012: D+21.8 2008: D+21.4
Not yet ingested
- Civics
- —
Market trends
- HPI YoY
- ▼ -187.71%
- Current HPI
- 265.507
- Rent YoY
- ▲ 1.83%
- Metro
- Philadelphia-Camden-Wilmington, PA-NJ-DE-MD
- State GDP YoY
- ▲ 1.68%
- F500 in state
- 34
Industry mix (Fortune 500 HQ in PA)
| Industry | F500 HQs | Revenue |
|---|---|---|
| Healthcare | 2 | $309B |
|
||
| Insurance | 2 | $27B |
|
||
| Telecommunications / Media | 1 | $124B |
|
||
| Industrial Distribution | 1 | $22B |
|
||
| Financial Services | 1 | $20B |
|
||
| Chemicals / Materials | 1 | $18B |
|
||
Price history
-7.9% since first listed6 events — show timeline
- 2026-06-09 Listed $69,000 BRIGHT MLS
- 2021-04-09 Sold (Public Records) $450,000 Public Records
- 2005-04-18 Sold (Public Records) $74,900 Public Records
- 2005-04-05 Sold (MLS) $74,900 BRIGHT MLS
- 2005-02-06 Listing Removed — BRIGHT MLS
- 2005-01-05 Listed $74,900 BRIGHT MLS
Property tax history
-7.1%/yrLatest (2026): $863 · -67.7% YoY. Source: county tax records.
Cash-flow waterfall
monthlySold comps — $/sqft
last 12 mo · ≤1 miLoading sold comps…