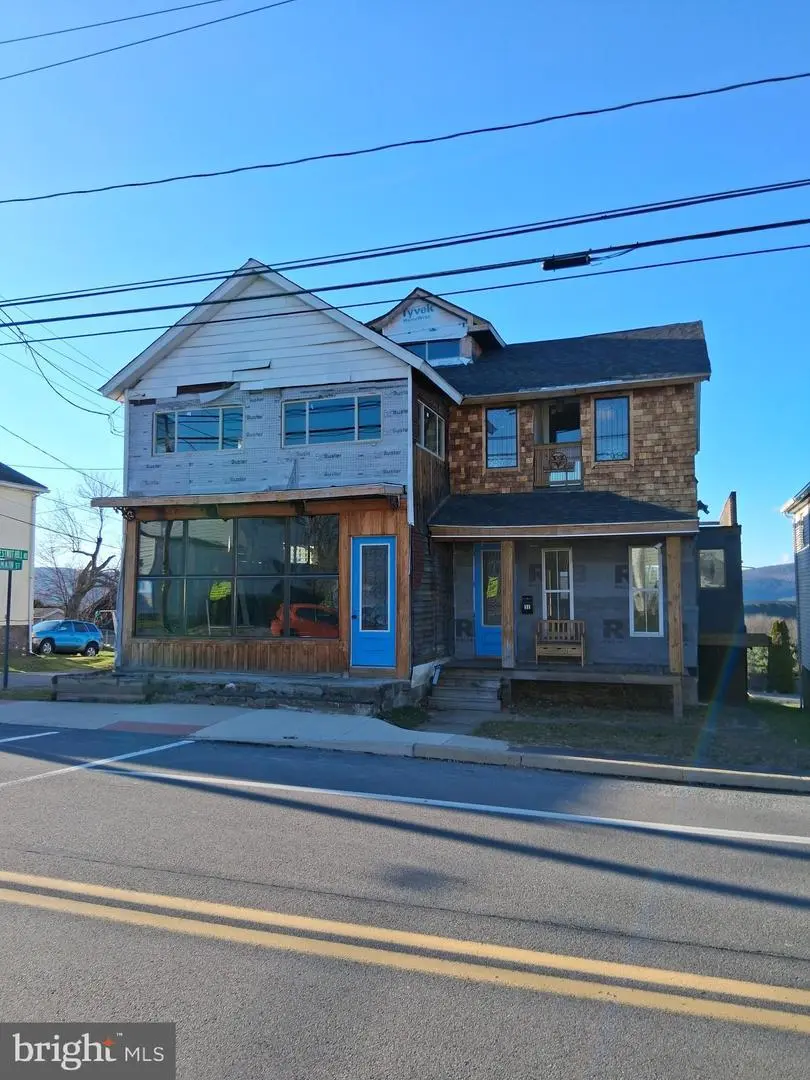
31 Main St · Pittston, PA
Flood risk 1/10 · Minimal
- FEMA flood zone
- X (unshaded)
- Chance of flooding over 30 yrs
- 0.0%
- Est. flood insurance / yr
- $507 – $1,088
Fire risk 1/10 · Minimal
- Est. fire insurance / yr
- $511 – $949
Heat risk 4/10 · Minor
- Hot days now (above 96°F)
- 7 days/yr
- Hot days in 30 yrs
- 16 days/yr
Wind risk 3/10 · Minor
- Chance of severe wind over 30 yrs
- 4.0%
Air-quality risk 2/10 · Minimal
- Unhealthy air days now
- 1 days/yr
- Unhealthy air days in 30 yrs
- 2 days/yr
Risk factors via First Street. Map © Google.
Why this score? — see what drove the F grade
The composite is a weighted blend of 9 inputs, each scored 0–100. Each bar is that input's sub-score; the figure is the points it added to the 100-point composite (weight × sub-score).
- ARV discount +15.0/15.0
- Livability +3.7/5.0
- Schools +3.0/10.0
- Rent growth +2.5/5.0
- Condition / age +2.5/5.0
- Cash flow +0.0/30.0
- 1% rule +0.0/10.0
- DSCR +0.0/10.0
- Appreciation +0.0/10.0
$150,000
🖨 Deal sheet 📄 Offer letter ✓ Due diligence
Listing remarks
A unique opportunity presents itself to acquire two parcels on Main Street in Pittston, offering both residential and commercial potential. The property encompasses approximately 5,000 square feet, providing a versatile canvas for various development plans, such as a single-family residence with exceptional views or an income-generating multifamily property. Zoned for multi-family use, the property permits the construction of up to four units or more with zoning approval. Recent enhancements include a new roof (2025), new doors and windows, completed additions, and other improvements. The interior requires significant renovation and currently lacks plumbing. Electricity is operational and i
Key facts
- 7,500 sq ft lot
- 8 parking spots
- Built 1920
Property features AI
Finance
- Financial info: Four total units
Exterior
- Parking: Eight off-street parking spaces (total 8)
- Utilities: Public water; Public sewer
- Home design: Detached building; Fee simple ownership
- Construction: Vinyl siding exterior; Concrete perimeter foundation; Approximately built (year estimated)
- Exterior features: No tidal water on the lot; Above-grade additional structures
Interior
- Interior features: Estimated living area
Neighborhood map
What this means for you Summary
Snapshot
- This is a single-family listed at $150k.
Deal economics
- At list price, monthly cash flow is $-1k ($-14k/yr) — negative.
- Rent doesn't cover operating costs at any purchase price — skip.
- Cap rate -3.3% vs local median 6.9% in Pittston — below-typical yield; the buyer is paying a premium for something (appreciation thesis, condition, location) that the cap rate doesn't capture.
Location & tenants
- Location reads 74/100 on livability (#493 in PA, #4,549 nationally) — a middle-class / working-renter tenant base. Strengths: crime A+, cost of living A+, health & safety A+; Watch: amenities F, commute F, employment F.
- Pittston Area SD (suburban): math 30% / reading 40% proficiency, ranked #418 of 539 in PA (top 78%) — families likely to look elsewhere, expect single-tenant / working-renter base with shorter leases.
- Market conditions: 103 active listings in the ZIP; 349 units permitted in Luzerne County in 2024 (16 in 5+ unit buildings).
Forward outlook
- Local home prices are declining (-3.0%/yr); year-one equity from $1k of loan paydown is wiped out by about $4k of value loss. Plan a longer hold.
- Luzerne County population projected at +4% by 2050 — modest demand growth; plan on rents tracking national, not racing it.
Negotiation context
- Only 2 days on market — expect competitive offers; lowballing is unlikely to land.
- 2 sale attempts with the ask held roughly flat each time — persistent listings suggest the price (not the market) is what's stuck; bring a comps-based counter.
- Current owner paid $65k; list at $150k implies a 131% gain — meaningful room to come down on a strong offer.
Risks & watch-outs
- Watch-outs: property tax is 2.8% of price; built in 1920 — expect roof / HVAC / electrical / plumbing capex.
Questions for the listing agent
- What do current leases actually rent for vs. the listed asking? Can we see a recent rent roll and the last 12 months of T-12 income?
- Built in 1920 — when were the roof, HVAC, electrical panel, plumbing, and water heater last replaced?
- Property tax is high relative to price — has the assessment been appealed recently, and will the sale trigger a re-assessment?
- Is there a deadline driving the sale (1031 exchange, divorce, estate, relocation)? That informs how much negotiation room exists.
- The area grade is low — what's the realistic commute time and amenity access for the typical tenant pool here? Any planned neighborhood developments (good or bad) we should know about?
- What's the average days-on-market for RENTAL listings here right now (not sales)? A rising rental-DOM trend means longer vacancies and softer asking-rent achievability than the comps imply.
- What's the recent tenant-quality profile in this submarket — average credit score on applications, eviction rate, late-payment / NSF rate, and stable-employment percentage? A property-management company in the area should have these aggregated.
- How much new for-sale + rental construction is in the pipeline within 1–3 miles? Heavy new supply typically softens prices + rents 12–24 months out; constrained supply supports both.
Investment metrics
- 1% rule
- 0.00% ✗
- Cap rate
- -3.32%
- Cash-on-cash
- -34.32%
- DSCR
- -0.53
- GRM
- 0.0
CMA / ARV
- ARV (median comp)
- $211,472
- List price
- $150,000
- Delta
- -29.12%
- Verdict
- UNDERPRICED
- Comps
- 20 within 1.0 mi
Show comp detail 7 sales within ~0.75 mi
| Address | Dist | Beds/Ba | Sqft | Sold | Price | $/sf | Match |
|---|---|---|---|---|---|---|---|
| 99 William St | 0.17mi | 4/2.5 | 3,482 (+14%) | 3mo | $200,000 | $57 | 66 |
| 220 Montgomery Ave | 0.71mi | 5/1.5 | 3,200 (+5%) | 1mo | $363,000 | $113 | 57 |
| 1000 Susquehanna Ave | 0.46mi | 4/4.0 | 3,271 (+8%) | 11mo | $340,000 | $104 | 57 |
| 514 Wyoming Ave | 0.73mi | 5/1.5 | 2,953 (-3%) | 8mo | $235,000 | $80 | 55 |
| 201 Luzerne Ave | 0.69mi | 6/3.0 | 3,205 (+5%) | 9mo | $350,000 | $109 | 52 |
| 23 Gidding St | 0.45mi | 4/2.5 | 2,780 (-9%) | 18mo | $139,995 | $50 | 49 |
| 24 Nafus St | 0.73mi | 3/2.0 | 3,250 (+7%) | 13mo | $180,000 | $55 | 44 |
Match score weights: distance 35% · size 25% · config 20% · recency 20%. Top-matched comps best support the ARV.
Projected returns pro-forma
-3.0% appreciation · 3.0% rent growth · sell at horizon
- IRR
- —
- Equity multiple
- -1.40×
- Total profit
- $-100,710
- Equity at exit
- $22,365
- IRR
- —
- Equity multiple
- -3.42×
- Total profit
- $-185,799
- Equity at exit
- $12,969
Cash invested: $42,000 (down + closing). Projections, not guarantees.
Landlord ↔ Tenant lean methodology
- Overall (STATE)
- 62 Landlord-Friendly
- State Pennsylvania
- 62 Landlord-Friendly · EVEN
- County
- — inherits STATE
- City
- — inherits STATE
ZIP-level market 18640
- Home prices YoY
- -34.9%
- Active inventory
- 103
Monthly cashflow live
- Estimated rent
- $0 none
- Mortgage (P&I)
- −$787
- Tax from tax record
- −$352 /mo · $4,225/yr
- Insurance
- −$62
- HOA
- −$0
- Vacancy / Maint / Mgmt
- −$0
- Net cashflow
- $-1,201
Break-even live
UW: 25.0% down · 7.5% · 30yr · 1.5% tax · 5.0% vac · 8.0% maint · 8.0% mgmt
Financing live
Cash to close
- Down payment
- $37,500
- Closing costs
- $4,500
- Reserves months
- —
- Total cash needed
- —
Loan-product check · same deal, 3 products live
Conventional
25% down · 7.5% · 30yr
- Down + closing
- —
- Monthly P&I
- —
- Monthly cashflow
- —
- DSCR
- —
- Eligible?
- —
Personal DTI + credit; lowest rate.
DSCR
20% down · 8.5% · 30yr
- Down + closing
- —
- Monthly P&I
- —
- Monthly cashflow
- —
- DSCR
- —
- Eligible?
- —
No personal income docs; deal must DSCR.
Hard money
10% down · 12.0% · 12mo
- Down + closing
- —
- Monthly P&I
- —
- Monthly cashflow
- —
- DSCR
- —
- Eligible?
- —
Short-term bridge; refi at stabilization.
Listing history 16 events
-
2026-06-16status $150,000 Pending 2 DOM
-
2026-06-15days on market $150,000 Active 2 DOM
-
2026-06-14pricedays on market $150,000 Active 1 DOM
-
2026-06-01days on market $149,900 Active 54 DOM
-
2026-05-31days on market $149,900 Active 53 DOM
-
2026-05-30days on market $149,900 Active 52 DOM
-
2026-05-18price $149,900 892-char remark
-
2026-05-15price $154,900 892-char remark
-
2026-05-15price $159,900 892-char remark
-
2026-05-11price $169,900 892-char remark
-
2026-04-28price $194,900 892-char remark
-
2026-04-21price $199,900 892-char remark
-
2026-04-08$209,900 Active 892-char remark
-
2021-09-28soldstatus $65,000
-
2006-07-24soldstatus $40,000
-
2004-10-05soldstatus $15,000
ⓘ Source: listings_history table (triggers on properties + properties_extension) + one-shot
backfill from property_details.listing_events for pre-trigger history.
Tax reassessment forecast PA · Partial reset (capped growth)
- Current annual tax
- $4,225 · $352/mo
- Projected year-2 tax
- $4,225 · $352/mo
- Expected delta
- $0/yr ($0/mo · 0.0%)
ⓘ Screening estimate from a state-policy table — verify with the county assessor before closing.
Climate risk First Street
- Flood 1/10 Low FEMA zone X (unshaded) · 0% chance over 30 yrs
- Wildfire 1/10 Low
- Heat 4/10 Moderate 7 d/yr ≥96°F today · 16 d/yr by 30 yrs out
- Wind 3/10 Moderate 4% chance of damaging wind over 30 yrs
- Air quality 2/10 Low 1 unhealthy d/yr today · 2 by 30 yrs out
Nearby sold comps map
Loading sold comps map…
Walkable amenities ~0.75 mi
Loading nearby amenities…
Taxation est. · year 1
- Rental income
- $0
- − Mortgage interest
- −$8,402
- − Property taxes
- −$4,225
- − Insurance
- −$750
- − Repairs & maintenance
- −$0
- − Management
- −$0
- − Depreciation
- −$4,364
- Taxable loss
- −$17,741
- Est. tax savings @ 24.0%
- +$4,258
- After-tax cash flow
- $-10,157/yr
For passive investors: Depreciation is non-cash, so a rental often shows a tax loss while cash-flowing — sheltering income. Rental losses are passive: they offset passive income freely, and up to $25,000/yr can offset ordinary (W-2) income if you actively participate and your MAGI is under $100k (phasing out to $0 by $150k); unused losses carry forward. On sale, claimed depreciation is recaptured at up to 25%, and gains may owe capital-gains tax (a 1031 exchange can defer both). Figures are a year-1 estimate at your 24.0% rate — not tax advice; consult a CPA.
Schools (NCES district)
- District
- Pittston Area SD
- NCES district ID
- 4219200
- Math proficiency
- 30% ▼ -12.00%
- Reading proficiency
- 40% ▼ -19.00%
- Median HH income
- $45,316
- Composite
- 29.86/100
- National rank
- #6409
- State rank
- #418 of 539 in PA
Livability — Pittston
- Score
- 74/100
- State rank
- #493
- US rank
- #4549
Category grades
Schools grade is shown separately in the Schools card above.
Census & demographics
- Census place
- Pittston, PA
- Population (ZIP)
- 16,418
Population outlook (Luzerne County) Hauer SSP2
- Today (2025)
- 319,505 people
- By 2030
- 319,943 · +0.1%
- By 2040
- 322,643 · +1.0%
- By 2050
- 330,817 · +3.5%
- By 2075
- 379,145 · +18.7%
- By 2100
- 431,908 · +35.2%
Race, ethnicity, and origin ACS 2023
- Neighborhood character
- Predominantly White (85%)
- Race & ethnicity
- White 85% Hispanic / Latino 6% Two or more races 5% Black 4%
- Hispanic origin (detail)
- Puerto Rican 4%
- Common ancestry
- Romanian 19% Scotch-Irish 2% Iranian 1%
- Foreign-born
- 3% · Canada, Jamaica
- Languages at home
- 93% English-only · Spanish 4% Other Indo-European 1% Chinese 1%
Political lean MEDSL · Luzerne
- 2024 margin
- R (+19.2) · D 40.0% · R 59.2%
- 2008→2024 swing
- -27.6pp toward R · 2008: 8.4pp · 2024: -19.2pp
- All cycles
- 2024: R+19.2 2020: R+14.4 2016: R+19.6 2012: D+4.8 2008: D+8.4
Not yet ingested
- Civics
- —
Market trends
- HPI YoY
- ▼ -102.89%
- Current HPI
- 191.973
- Rent YoY
- —
- Metro
- —
- State GDP YoY
- ▲ 1.68%
- F500 in state
- 34
Industry mix (Fortune 500 HQ in PA)
| Industry | F500 HQs | Revenue |
|---|---|---|
| Healthcare | 2 | $309B |
|
||
| Insurance | 2 | $27B |
|
||
| Telecommunications / Media | 1 | $124B |
|
||
| Industrial Distribution | 1 | $22B |
|
||
| Financial Services | 1 | $20B |
|
||
| Chemicals / Materials | 1 | $18B |
|
||
Price history
+900.0% since first listed13 events — show timeline
- 2026-06-16 Pending — BRIGHT MLS
- 2026-06-13 Listed $150,000 BRIGHT MLS
- 2026-06-01 Listing Removed — BRIGHT MLS
- 2026-05-18 Price Changed $149,900 BRIGHT MLS
- 2026-05-15 Price Changed $154,900 BRIGHT MLS
- 2026-05-15 Price Changed $159,900 BRIGHT MLS
- 2026-05-11 Price Changed $169,900 BRIGHT MLS
- 2026-04-28 Price Changed $194,900 BRIGHT MLS
- 2026-04-21 Price Changed $199,900 BRIGHT MLS
- 2026-04-08 Listed $209,900 BRIGHT MLS
- 2021-09-28 Sold (Public Records) $65,000 Public Records
- 2006-07-24 Sold (Public Records) $40,000 Public Records
- 2004-10-05 Sold (Public Records) $15,000 Public Records
Property tax history
+1.6%/yrLatest (2026): $4,225 · +2.5% YoY. Source: county tax records.
Cash-flow waterfall
monthlySold comps — $/sqft
last 12 mo · ≤1 miLoading sold comps…