 🏷️ Likely Rental
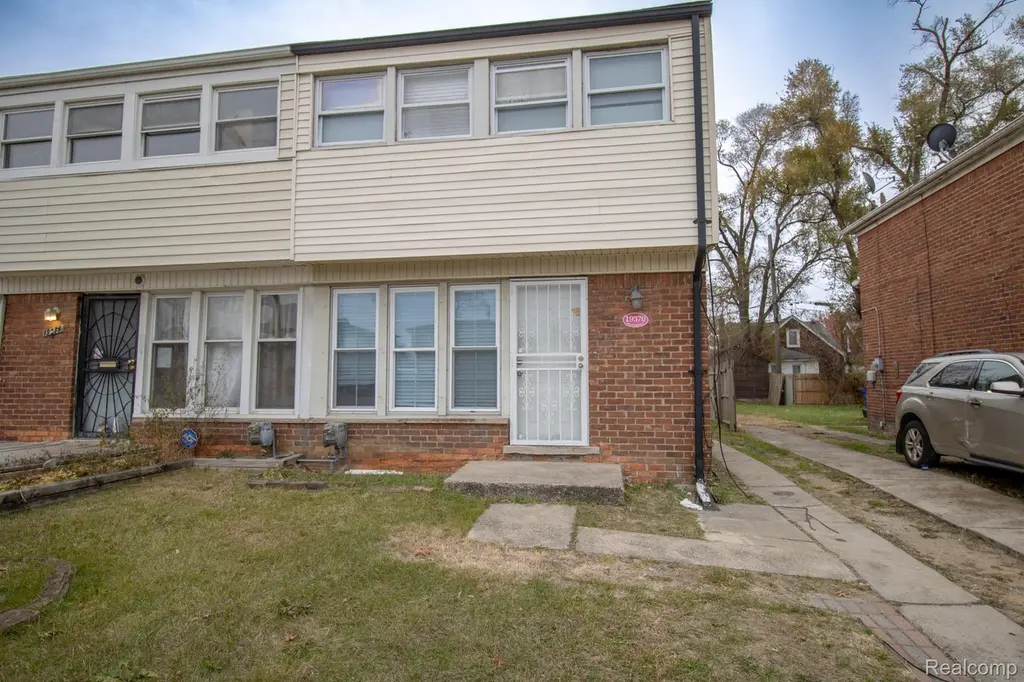
19370 Wyoming Ave · Detroit, MI
Flood risk 1/10 · Minimal
- FEMA flood zone
- X (unshaded)
- Chance of flooding over 30 yrs
- 0.0%
- Est. flood insurance / yr
- $473 – $860
Fire risk 1/10 · Minimal
- Est. fire insurance / yr
- $784 – $1,456
Heat risk 3/10 · Minor
- Hot days now (above 97°F)
- 7 days/yr
- Hot days in 30 yrs
- 15 days/yr
Wind risk 2/10 · Minimal
- Chance of severe wind over 30 yrs
- —
Air-quality risk 3/10 · Minor
- Unhealthy air days now
- 2 days/yr
- Unhealthy air days in 30 yrs
- 5 days/yr
Risk factors via First Street. Map © Google.
Why this score? — see what drove the B+ grade
The composite is a weighted blend of 9 inputs, each scored 0–100. Each bar is that input's sub-score; the figure is the points it added to the 100-point composite (weight × sub-score).
- Cash flow +30.0/30.0
- ARV discount +15.0/15.0
- 1% rule +10.0/10.0
- DSCR +10.0/10.0
- Livability +3.7/5.0
- Rent growth +3.4/5.0
- Condition / age +2.5/5.0
- Schools +1.3/10.0
- Appreciation +0.0/10.0
$95,000
🖨 Deal sheet 📄 Offer letter ✓ Due diligence
Multi-family units
County records classify this as Multi-Family (2-4 Unit). Listing-text estimate: 1 unit. estimate disagrees with records
Listing remarks MLS
Investors welcome! Welcome to this income-producing 2-bedroom, 1-bathroom half-duplex - an excellent opportunity whether you're looking to expand your rental portfolio or find a home of your own. This property is currently tenant-occupied with a month-to-month lease, offering flexibility for both investors and future owner-occupants. Inside, you'll find a generous living room that flows into a comfortable dining area, creating an inviting space for everyday living. Upstairs features two well-sized bedrooms and a full bathroom. The unfinished basement provides plenty of storage and the potential to finish for additional space down the road. A solid, straightforward property with strong rental appeal - don't miss your chance to make it yours!
Key facts
- 2,614 sq ft lot
- Built 1951
- Listed 165 days
Neighborhood map
What this means for you Summary
Snapshot
- This is a 2-bed/1.0-bath multifamily listed at $95k.
Deal economics
- At list price, monthly cash flow is $1k ($14k/yr) — positive.
- The deal already cash-flows at list — no discount required.
- Meets the 1% rule at list price ($2k rent vs $95k).
- Recommended offer: $84k (12.0% below list) — sets the bar for market timing.
- Cap rate 21.2% vs local median 10.2% in Detroit — top-decile yield for the area; either an underpriced asset or a hidden risk that comps aren't pricing in. Stress-test before assuming the spread holds.
Location & tenants
- Location reads 73/100 on livability (#218 in MI) — a middle-class / working-renter tenant base. Strengths: amenities A+, commute A+, cost of living A+; Watch: schools F, crime F, employment F.
- Detroit Public Schools Community District (urban): math 10% / reading 24% proficiency, ranked #499 of 540 in MI (top 92%) — low school quality limits family demand, transient renter base, plan for 1-2y turnover; 90% free/reduced lunch — lower-income household profile, screen leases tightly.
- Market conditions: Rents rising (+3.4%/yr); 349 active listings in the ZIP; 35 comparable units currently listed for rent nearby; rentals at typical pace (median 24d on market — plan ~3-4 weeks tenant-placement turnaround); 2,639 units permitted in Wayne County in 2024 (1,216 in 5+ unit buildings).
- At $2,300/mo this rent would consume 48% of the median local household income ($58k/yr) (locally 1646% of renters already pay >50% of income on rent) — very limited rent-growth headroom before tenants either downsize or default.
Forward outlook
- Local home prices are declining (-3.0%/yr); year-one equity from $657 of loan paydown is wiped out by about $3k of value loss. Plan a longer hold.
- Wayne County population projected at -17% by 2050 — secular population decline; favor cash flow + early exit over multi-decade hold.
- At projected returns (-3.0% appreciation + 3.4% rent growth), your $27k cash investment doubles in ~3 years — after that, you're playing with house money.
Negotiation context
- It's been on market 165 days — a 12% lower offer ($84k) is reasonable based on typical stale-listing flexibility.
- 6 sale attempts since 5y ago; this cycle's ask has dropped $25k (21%) from the opening price — seller is motivated, your offer sets the floor, not the list.
- Current owner paid $35k; list at $95k implies a 171% gain — meaningful room to come down on a strong offer.
Risks & watch-outs
- Watch-outs: built in 1951 — expect roof / HVAC / electrical / plumbing capex.
Questions for the listing agent
- It's been on market 165 days. Have you received any prior offers? Is the seller open to a 12% concession, seller financing, or rate buy-down credit?
- Built in 1951 — when were the roof, HVAC, electrical panel, plumbing, and water heater last replaced?
- Why hasn't it sold? Are there any deal-killer items the seller is aware of (foundation, flood, title, zoning, code violations)?
- Is there a deadline driving the sale (1031 exchange, divorce, estate, relocation)? That informs how much negotiation room exists.
- Schools are F-rated, which usually means shorter tenancies and higher turnover. Who's the typical renter profile here, and what's been the actual vacancy rate?
- Crime grade is F in this area — have there been break-ins, vandalism, or insurance claims at this property in the last 3 years? What carrier currently insures it and at what premium?
- What's the average days-on-market for RENTAL listings here right now (not sales)? A rising rental-DOM trend means longer vacancies and softer asking-rent achievability than the comps imply.
- What's the recent tenant-quality profile in this submarket — average credit score on applications, eviction rate, late-payment / NSF rate, and stable-employment percentage? A property-management company in the area should have these aggregated.
- How much new apartment / multifamily construction is in the pipeline within 1–3 miles? Heavy new supply (>2% of stock underway) typically softens rents 12–24 months out; light construction supports rent growth.
Investment metrics
- 1% rule
- 2.42% ✓
- Cap rate
- 21.23%
- Cash-on-cash
- 53.36%
- DSCR
- 3.37
- GRM
- 3.4
CMA / ARV
- ARV (median comp)
- $126,409
- List price
- $95,000
- Delta
- -24.85%
- Verdict
- UNDERPRICED
- Comps
- 4 within 1.0 mi
Projected returns pro-forma
-3.0% appreciation · 3.44% rent growth · sell at horizon
- IRR
- 51.9%
- Equity multiple
- 3.29×
- Total profit
- $60,985
- Equity at exit
- $14,165
- IRR
- 57.4%
- Equity multiple
- 6.81×
- Total profit
- $154,430
- Equity at exit
- $8,214
Cash invested: $26,600 (down + closing). Projections, not guarantees.
Landlord ↔ Tenant lean methodology
- Overall (STATE)
- 62 Landlord-Friendly
- State Michigan
- 62 Landlord-Friendly · EVEN
- County
- — inherits STATE
- City
- — inherits STATE
ZIP-level market 48221
- Rents YoY
- 3.4%
- Active inventory
- 349
- Price-to-rent
- 6.9×
Monthly cashflow live
- Estimated rent
- $2,300 medium interval (Pro) →
- Mortgage (P&I)
- −$498
- Tax from tax record
- −$96 /mo · $1,157/yr
- Insurance
- −$40
- HOA
- −$0
- Vacancy / Maint / Mgmt
- −$483
- Net cashflow
- $1,183
Break-even live
2-unit breakdown (identical units grouped — click to expand)
| Units | Beds | Baths | Est. rent |
|---|---|---|---|
| 2× units | 2 | 1 | $2,300 |
| #1 | 2 | 1 | $1,150 |
| #2 | 2 | 1 | $1,150 |
| Total (2 units) | $2,300 | ||
UW: 25.0% down · 7.5% · 30yr · 1.5% tax · 5.0% vac · 8.0% maint · 8.0% mgmt
Financing live
Cash to close
- Down payment
- $23,750
- Closing costs
- $2,850
- Reserves months
- —
- Total cash needed
- —
Loan-product check · same deal, 3 products live
Conventional
25% down · 7.5% · 30yr
- Down + closing
- —
- Monthly P&I
- —
- Monthly cashflow
- —
- DSCR
- —
- Eligible?
- —
Personal DTI + credit; lowest rate.
DSCR
20% down · 8.5% · 30yr
- Down + closing
- —
- Monthly P&I
- —
- Monthly cashflow
- —
- DSCR
- —
- Eligible?
- —
No personal income docs; deal must DSCR.
Hard money
10% down · 12.0% · 12mo
- Down + closing
- —
- Monthly P&I
- —
- Monthly cashflow
- —
- DSCR
- —
- Eligible?
- —
Short-term bridge; refi at stabilization.
Rent comps 35 comps
| Address | Beds | Baths | Sqft | Rent | $/sqft | DOM | Units | Dist |
|---|---|---|---|---|---|---|---|---|
| 20009 Wisconsin St Detroit, MI | 3.0 | 1.5 | 1051 | $1,400 | $1.33 | 17d | 1 | 0.45mi |
| 18461 Washburn St Detroit, MI | 1.0 | 1.0 | 690 | $775 | $1.12 | 43d | 1 | 0.50mi |
| 19929 Monte Vista St Detroit, MI | 3.0 | 1.0 | 860 | $1,450 | $1.69 | 17d | 1 | 0.54mi |
| 20185 Indiana St Detroit, MI | 2.0 | 1.5 | 1096 | $1,275 | $1.16 | 43d | 1 | 0.57mi |
| 20032 Monte Vista St Detroit, MI | 3.0 | 1.0 | 1000 | $1,294 | $1.29 | 20d | 1 | 0.59mi |
| 20110 Northlawn St Detroit, MI | 3.0 | 1.0 | 1100 | $1,350 | $1.23 | 17d | 1 | 0.61mi |
| 18675 Meyers Rd Unit 18677 Detroit, MI | 2.0 | 1.0 | 942 | $1,100 | $1.17 | 43d | 1 | 0.62mi |
| 20045 Greenlawn St Detroit, MI | 3.0 | 1.0 | 925 | $1,350 | $1.46 | 43d | 1 | 0.64mi |
| 20122 Manor St Detroit, MI | 3.0 | 1.0 | 1028 | $1,200 | $1.17 | 43d | 1 | 0.66mi |
| 20445 Kentucky St Detroit, MI | 3.0 | 1.0 | 1046 | $1,200 | $1.15 | 24d | 1 | 0.69mi |
| 20458 Indiana St Detroit, MI | 3.0 | 1.0 | 1049 | $1,300 | $1.24 | 17d | 1 | 0.71mi |
| 20460 Griggs St Detroit, MI | 2.0 | 1.0 | 910 | $1,100 | $1.21 | 17d | 1 | 0.72mi |
| 20515 Ilene St Detroit, MI | 3.0 | 1.0 | 891 | $1,450 | $1.63 | 43d | 1 | 0.76mi |
| 20245 Manor Detroit, MI | 3.0 | 1.0 | 1018 | $1,400 | $1.38 | 2d | 1 | 0.77mi |
| 20429 Monte Vista St Detroit, MI | 3.0 | 1.0 | 872 | $1,300 | $1.49 | 17d | 1 | 0.79mi |
| 19474 Schaefer Hwy Detroit, MI | 2.0 | 1.0 | 896 | $1,075 | $1.20 | 4d | 1 | 1.00mi |
| 20038 Santa Rosa Dr Detroit, MI | 3.0 | 1.0 | 927 | $1,300 | $1.40 | 17d | 1 | 1.00mi |
| 19031 Livernois Unit F Detroit, MI | 2.0 | 2.0 | 1100 | $2,135 | $1.94 | 43d | 1 | 1.01mi |
| 18512 Schaefer Hwy Detroit, MI | 2.0 | 1.0 | 962 | $1,200 | $1.25 | 24d | 1 | 1.08mi |
| 17159 Northlawn St Unit 17161 Detroit, MI | 2.0 | 1.0 | 1122 | $975 | $0.87 | 4d | 1 | 1.17mi |
| 17150 Meyers Rd Detroit, MI | 1.0–2.0 | 1.0 | 775 | $975 | $1.26 | 43d | 2 | 1.17mi |
| 21374 Ithaca Ave Ferndale, MI | 3.0 | 1.0 | 996 | $1,775 | $1.78 | 24d | 1 | 1.22mi |
| 17551 Santa Rosa Dr Detroit, MI | 2.0 | 1.0 | 1036 | $1,095 | $1.06 | 43d | 1 | 1.24mi |
| 18637 James Couzens Fwy Unit C103 Detroit, MI | 1.0 | 1.0 | 630 | $835 | $1.33 | 43d | 1 | 1.25mi |
| 18637 James Couzens Fwy Apt 103A Detroit, MI | 1.0 | 1.0 | 630 | $835 | $1.33 | 1d | 1 | 1.25mi |
| 18010 Lesure St Detroit, MI | 3.0 | 1.0 | 1010 | $1,550 | $1.53 | 24d | 1 | 1.35mi |
| 20129 Stratford Rd Unit 2 Detroit, MI | 2.0 | 1.0 | 1100 | $1,223 | $1.11 | 24d | 1 | 1.36mi |
| 510 Stratford Rd Ferndale, MI | 2.0 | 1.0 | 965 | $1,750 | $1.81 | 43d | 1 | 1.40mi |
| 17147 Monica St Unit 2 1 Detroit, MI | 2.0 | 1.0 | 900 | $975 | $1.08 | 24d | 1 | 1.40mi |
| 578 Kensington Ave Ferndale, MI | 2.0 | 1.0 | 860 | $1,600 | $1.86 | 5d | 1 | 1.41mi |
| 17145 Santa Rosa Dr Unit 1 Detroit, MI | 3.0 | 1.0 | 1050 | $1,400 | $1.33 | 17d | 1 | 1.43mi |
| 17150 Santa Rosa Dr Detroit, MI | 1.0 | 1.0 | 950 | $1,250 | $1.32 | 17d | 1 | 1.45mi |
| 16722 Tuller St Detroit, MI | 3.0 | 1.5 | 1100 | $1,500 | $1.36 | 16d | 1 | 1.45mi |
| 20643 Stratford Rd Unit 1 Detroit, MI | 2.0 | 1.5 | 1000 | $1,250 | $1.25 | 43d | 1 | 1.48mi |
| 17215 Warrington Dr Detroit, MI | 2.0 | 1.0 | 1015 | $2,000 | $1.97 | 43d | 1 | 1.50mi |
Listing history 18 events
-
2026-01-16price $95,000 750-char remark
Show marketing remark (750 chars)
Investors welcome! Welcome to this income-producing 2-bedroom, 1-bathroom half-duplex - an excellent opportunity whether you're looking to expand your rental portfolio or find a home of your own. This property is currently tenant-occupied with a month-to-month lease, offering flexibility for both investors and future owner-occupants. Inside, you'll find a generous living room that flows into a comfortable dining area, creating an inviting space for everyday living. Upstairs features two well-sized bedrooms and a full bathroom. The unfinished basement provides plenty of storage and the potential to finish for additional space down the road. A solid, straightforward property with strong rental appeal - don't miss your chance to make it yours!
-
2026-01-15price $95,000 770-char remark
Show marketing remark (770 chars)
Investors welcome! Welcome to this income-producing 2-bedroom, 1-bathroom half-duplex—an excellent opportunity whether you're looking to expand your rental portfolio or find a home of your own. This property is currently tenant-occupied with a month-to-month lease, offering flexibility for both investors and future owner-occupants. Inside, you’ll find a generous living room that flows into a comfortable dining area, creating an inviting space for everyday living. Upstairs features two well-sized bedrooms and a full bathroom. The unfinished basement provides plenty of storage and the potential to finish for additional space down the road. A solid, straightforward property with strong rental appeal—don’t miss your chance to make it yours!
-
2025-12-12$120,000 Active 750-char remark
Show marketing remark (770 chars)
Investors welcome! Welcome to this income-producing 2-bedroom, 1-bathroom half-duplex—an excellent opportunity whether you're looking to expand your rental portfolio or find a home of your own. This property is currently tenant-occupied with a month-to-month lease, offering flexibility for both investors and future owner-occupants. Inside, you’ll find a generous living room that flows into a comfortable dining area, creating an inviting space for everyday living. Upstairs features two well-sized bedrooms and a full bathroom. The unfinished basement provides plenty of storage and the potential to finish for additional space down the road. A solid, straightforward property with strong rental appeal—don’t miss your chance to make it yours!
-
2025-12-12$120,000 Active 770-char remark
Show marketing remark (770 chars)
Investors welcome! Welcome to this income-producing 2-bedroom, 1-bathroom half-duplex—an excellent opportunity whether you're looking to expand your rental portfolio or find a home of your own. This property is currently tenant-occupied with a month-to-month lease, offering flexibility for both investors and future owner-occupants. Inside, you’ll find a generous living room that flows into a comfortable dining area, creating an inviting space for everyday living. Upstairs features two well-sized bedrooms and a full bathroom. The unfinished basement provides plenty of storage and the potential to finish for additional space down the road. A solid, straightforward property with strong rental appeal—don’t miss your chance to make it yours!
-
2021-10-19soldstatus $35,000
-
2021-09-08soldstatus $35,000 Sold
-
2021-09-08soldstatus $35,000 Closed
-
2021-08-19status Pending
-
2021-08-19status Pending
-
2021-08-09price $39,900
-
2021-08-08price $39,900
-
2021-08-03$45,900 Active
-
2021-08-03$45,900 Active
-
2021-07-28historical
-
2021-07-28historical
-
2021-07-14$49,900 Active
-
2021-07-14$49,900 Active
-
2017-12-28soldstatus $10,000
ⓘ Source: listings_history table (triggers on properties + properties_extension) + one-shot
backfill from property_details.listing_events for pre-trigger history.
Tax reassessment forecast MI · Partial reset (capped growth)
- Current annual tax
- $1,157 · $96/mo
- Projected year-2 tax
- $1,310 · $109/mo
- Expected delta
- +$153/yr (+$13/mo · 13.2%)
ⓘ Screening estimate from a state-policy table — verify with the county assessor before closing.
Climate risk First Street
- Flood 1/10 Low FEMA zone X (unshaded) · 0% chance over 30 yrs
- Wildfire 1/10 Low
- Heat 3/10 Moderate 7 d/yr ≥97°F today · 15 d/yr by 30 yrs out
- Wind 2/10 Low
- Air quality 3/10 Moderate 2 unhealthy d/yr today · 5 by 30 yrs out
Nearby sold comps map
Loading sold comps map…
Walkable amenities ~0.75 mi
Loading nearby amenities…
Taxation est. · year 1
- Rental income
- $27,600
- − Mortgage interest
- −$5,321
- − Property taxes
- −$1,157
- − Insurance
- −$475
- − Repairs & maintenance
- −$2,208
- − Management
- −$2,208
- − Depreciation
- −$2,764
- Taxable income
- $13,467
- Est. tax owed @ 24.0%
- −$3,232
- After-tax cash flow
- $10,962/yr
For passive investors: Depreciation is non-cash, so a rental often shows a tax loss while cash-flowing — sheltering income. Rental losses are passive: they offset passive income freely, and up to $25,000/yr can offset ordinary (W-2) income if you actively participate and your MAGI is under $100k (phasing out to $0 by $150k); unused losses carry forward. On sale, claimed depreciation is recaptured at up to 25%, and gains may owe capital-gains tax (a 1031 exchange can defer both). Figures are a year-1 estimate at your 24.0% rate — not tax advice; consult a CPA.
Schools (NCES district)
- District
- Detroit Public Schools Community District
- NCES district ID
- 2601103
- Math proficiency
- 10% ▼ -2.00%
- Reading proficiency
- 24% ▲ 6.00%
- Median HH income
- $25,815
- Composite
- 13.06/100
- National rank
- #9564
- State rank
- #499 of 540 in MI
Livability — Detroit
- Score
- 73/100
- State rank
- #218
- US rank
- #5427
Category grades
Schools grade is shown separately in the Schools card above.
Census & demographics
- Census place
- Detroit, MI
- County
- Wayne County · 1,562,939 people
- City population
- 572,865
- Metro
- Detroit-Warren-Dearborn, MI
- Population (ZIP)
- 41,392
- Household income
- $57,878
- Rent vs Own
- Severe rent burden
- 1646.0
Population outlook (Wayne County) Hauer SSP2
- Today (2025)
- 1,675,273 people
- By 2030
- 1,620,300 · -3.3%
- By 2040
- 1,502,341 · -10.3%
- By 2050
- 1,384,039 · -17.4%
- By 2075
- 1,124,592 · -32.9%
- By 2100
- 881,193 · -47.4%
Race, ethnicity, and origin ACS 2023
- Neighborhood character
- Predominantly Black (85%)
- Race & ethnicity
- Black 85% White 8% Two or more races 4% Asian 1%
- Common ancestry
- Romanian 1% Lithuanian 1%
- Foreign-born
- 2% · Canada
- Languages at home
- 97% English-only · Spanish 1% Other Indo-European 1%
Political lean MEDSL · Wayne
- 2024 margin
- Strong D (+29.0) · D 62.7% · R 33.7% · Other 3.6%
- 2008→2024 swing
- -20.5pp toward R · 2008: 49.5pp · 2024: 29.0pp
- All cycles
- 2024: D+29.0 2020: D+38.1 2016: D+37.3 2012: D+46.9 2008: D+49.5
Not yet ingested
- Civics
- —
Market trends
- HPI YoY
- ▼ -433.14%
- Current HPI
- 280.5434
- Rent YoY
- ▲ 3.44%
- Metro
- Detroit-Warren-Dearborn, MI
- State GDP YoY
- ▲ 1.37%
- F500 in state
- 28
Industry mix (Fortune 500 HQ in MI)
| Industry | F500 HQs | Revenue |
|---|---|---|
| Automotive Parts | 3 | $48B |
|
||
| Automotive | 2 | $372B |
|
||
| Chemicals | 1 | $45B |
|
||
| Automotive Retail | 1 | $29B |
|
||
| Healthcare / Medical Devices | 1 | $23B |
|
||
| Automotive Technology | 1 | $20B |
|
||
Price history
+850.0% since first listed18 events — show timeline
- 2026-01-16 Price Changed $95,000 MiRealSource-MiMLS
- 2026-01-15 Price Changed $95,000 REALCOMP
- 2025-12-12 Listed $120,000 REALCOMP
- 2025-12-12 Listed $120,000 MiRealSource-MiMLS
- 2021-10-19 Sold (Public Records) $35,000 Public Records
- 2021-09-08 Sold (MLS) $35,000 MiRealSource-MiMLS
- 2021-09-08 Sold (MLS) $35,000 REALCOMP
- 2021-08-19 Pending — MiRealSource-MiMLS
- 2021-08-19 Pending — REALCOMP
- 2021-08-09 Price Changed $39,900 MiRealSource-MiMLS
- 2021-08-08 Price Changed $39,900 REALCOMP
- 2021-08-03 Listed $45,900 MiRealSource-MiMLS
- 2021-08-03 Listed $45,900 REALCOMP
- 2021-07-28 Listing Removed — REALCOMP
- 2021-07-28 Listing Removed — MiRealSource-MiMLS
- 2021-07-14 Listed $49,900 MiRealSource-MiMLS
- 2021-07-14 Listed $49,900 REALCOMP
- 2017-12-28 Sold (Public Records) $10,000 Public Records
Property tax history
-0.8%/yrLatest (2025): $1,157 · -53.9% YoY. Source: county tax records.
Cash-flow waterfall
monthlySold comps — $/sqft
last 12 mo · ≤1 miLoading sold comps…