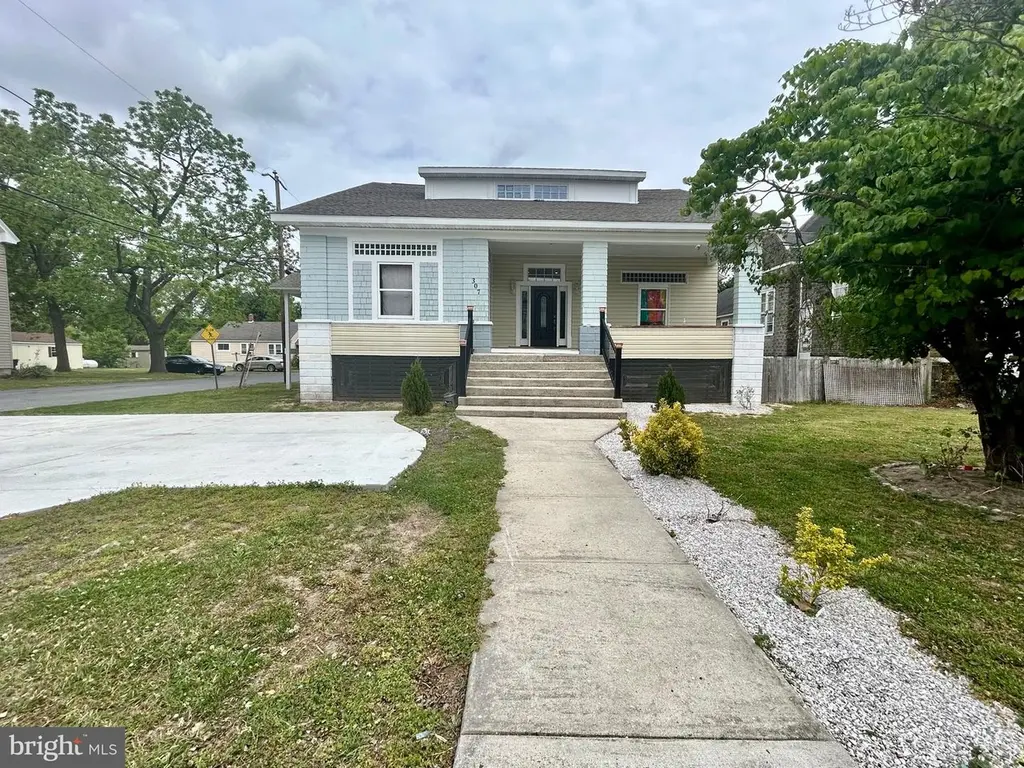
307 S Main St · Hurlock, MD
Flood risk 1/10 · Minimal
- FEMA flood zone
- X (unshaded)
- Chance of flooding over 30 yrs
- 0.0%
- Est. flood insurance / yr
- $473 – $860
Fire risk 1/10 · Minimal
- Est. fire insurance / yr
- $755 – $1,403
Heat risk 8/10 · Major
- Hot days now (above 105°F)
- 7 days/yr
- Hot days in 30 yrs
- 16 days/yr
Wind risk 6/10 · Moderate
- Chance of severe wind over 30 yrs
- 64.0%
Air-quality risk 3/10 · Minor
- Unhealthy air days now
- 2 days/yr
- Unhealthy air days in 30 yrs
- 3 days/yr
Risk factors via First Street. Map © Google.
Why this score? — see what drove the C- grade
The composite is a weighted blend of 9 inputs, each scored 0–100. Each bar is that input's sub-score; the figure is the points it added to the 100-point composite (weight × sub-score).
- ARV discount +15.0/15.0
- Cash flow +11.9/30.0
- Appreciation +10.0/10.0
- DSCR +3.5/10.0
- Livability +3.1/5.0
- Rent growth +2.5/5.0
- Condition / age +2.5/5.0
- 1% rule +2.4/10.0
- Schools +1.5/10.0
$280,000
🖨 Deal sheet 📄 Offer letter ✓ Due diligence
Listing remarks
Welcome to the home where modern design meets charm- right in the heart of Hurlock. The main floor features a kitchen, dining room, living room, an office and primary bedroom. The top floor features two en-suites and an additional bedroom! The mostly-finished basement features two bedrooms, a full bathroom, living room and kitchen! This is perfect for multi-generational living or maybe, rent out the second half for additional income (buyer to confirm with town/county/state of rental possibilities). The home has been significantly renovated by the owner in the last few years , but there are a few finishes that the new homeowner will have to complete, if they so desire.
Key facts
- 0.24 acre lot
- Built 1910
- Listed 38 days
Property features AI
Finance
- Other: Ownership: fee simple; Total below-grade area reported as 1,152 (assessor); Above-grade finished area reported as 1,888 (assessor)
Exterior
- Parking: Other parking type
- Utilities: Public water; Public sewer; Electric service
- Home design: Detached property; Year built/effective year reported by assessor (effective 2026)
- Construction: Vinyl siding; Foundation: other; Other structures above and below grade
- Exterior features: Not in a federal flood zone; No tidal water
Interior
- Bedrooms: Three bedrooms on the first upper level; One bedroom on the main level; Two bedrooms on the first lower level
- Bathrooms: Four full bathrooms total: two full baths on the first upper level, one full bath on the main level, one full bath on the first lower level
- Heating & cooling: 90% forced air heating; Heating fuel: central and electric; Central air conditioning (electric); Electric hot water
- Interior features: One fireplace; Partially finished basement; Living area and finished/unfinished area reported by assessor
Neighborhood map
What this means for you Summary
Snapshot
- This is a 6-bed/2.0-bath single-family listed at $280k.
Deal economics
- At list price, monthly cash flow is $-73 ($-871/yr) — negative.
- To cash-flow at today's rent, offer at most $267k (4.6% below list).
- To meet the 1% rule (rent ≥ 1% of price), the offer needs to be $207k (26.1% below list).
- Recommended offer: $207k (26.1% below list) — sets the bar for 1% rule.
- Cap rate 6.0% vs local median 4.7% in Hurlock — meaningfully above typical; check what's discounted (condition, days-on-market, listing class) to confirm the premium yield is real.
Location & tenants
- Location reads 61/100 on livability (#332 in MD) — a middle-class / working-renter tenant base. Strengths: cost of living A+, housing A+, crime B+; Watch: employment D+, schools F, amenities F.
- Dorchester County Public Schools (rural): math 10% / reading 23% proficiency, ranked #23 of 24 in MD (top 96%) — low school quality limits family demand, transient renter base, plan for 1-2y turnover.
- Market conditions: 34 active listings in the ZIP; 81 units permitted in Dorchester County in 2024 (0 in 5+ unit buildings).
Forward outlook
- In year one you build about $30k of equity ($2k loan paydown + $28k appreciation (10.0% local appreciation)).
- Dorchester County population projected to shrink 10% by 2050 — rents likely to lag national; underwrite the cash flow, not the appreciation.
- At projected returns (10.0% appreciation + 3.0% rent growth), your $78k cash investment doubles in ~3 years — after that, you're playing with house money.
- By year 2, paydown + projected appreciation supports a ~$48k cash-out refi (75% LTV) — recoverable capital for the next deal without selling this one.
Negotiation context
- It's been on market 39 days — a 3% lower offer ($272k) is reasonable based on typical stale-listing flexibility.
- Current owner paid $70k; list at $280k implies a 300% gain — meaningful room to come down on a strong offer.
Risks & watch-outs
- Watch-outs: built in 1910 — expect roof / HVAC / electrical / plumbing capex.
- Climate carrying-cost: major wind risk, 64% chance of damaging wind over 30y; extreme-heat days projected 7→16/yr by 2055 (HVAC capex compounding) — expect insurance premiums to compound above CPI over the hold.
Questions for the listing agent
- What do current leases actually rent for vs. the listed asking? Can we see a recent rent roll and the last 12 months of T-12 income?
- It's been on market 39 days. Have you received any prior offers? Is the seller open to a 26% concession, seller financing, or rate buy-down credit?
- Built in 1910 — when were the roof, HVAC, electrical panel, plumbing, and water heater last replaced?
- Is there a deadline driving the sale (1031 exchange, divorce, estate, relocation)? That informs how much negotiation room exists.
- Schools are F-rated, which usually means shorter tenancies and higher turnover. Who's the typical renter profile here, and what's been the actual vacancy rate?
- What's the average days-on-market for RENTAL listings here right now (not sales)? A rising rental-DOM trend means longer vacancies and softer asking-rent achievability than the comps imply.
- What's the recent tenant-quality profile in this submarket — average credit score on applications, eviction rate, late-payment / NSF rate, and stable-employment percentage? A property-management company in the area should have these aggregated.
- How much new for-sale + rental construction is in the pipeline within 1–3 miles? Heavy new supply typically softens prices + rents 12–24 months out; constrained supply supports both.
Investment metrics
- 1% rule
- 0.74% ✗
- Cap rate
- 5.98%
- Cash-on-cash
- -1.11%
- DSCR
- 0.95
- GRM
- 11.3
CMA / ARV
- ARV (median comp)
- $427,444
- List price
- $280,000
- Delta
- -34.49%
- Verdict
- UNDERPRICED
- Comps
- 1 within 2.0 mi
Projected returns pro-forma
10.0% appreciation · 3.0% rent growth · sell at horizon
- IRR
- 23.5%
- Equity multiple
- 2.88×
- Total profit
- $147,764
- Equity at exit
- $252,246
- IRR
- 20.9%
- Equity multiple
- 6.59×
- Total profit
- $438,560
- Equity at exit
- $543,978
Cash invested: $78,400 (down + closing). Projections, not guarantees.
Landlord ↔ Tenant lean methodology
- Overall (STATE)
- 27 Tenant-Leaning
- State Maryland
- 27 Tenant-Leaning · D+14
- County
- — inherits STATE
- City
- — inherits STATE
ZIP-level market 21643
- Home prices YoY
- 15.5%
- Active inventory
- 34
- Price-to-rent
- 11.3×
Monthly cashflow live
- Estimated rent
- $2,070 medium interval (Pro) →
- Mortgage (P&I)
- −$1,468
- Tax from tax record
- −$123 /mo · $1,470/yr
- Insurance
- −$117
- HOA
- −$0
- Vacancy / Maint / Mgmt
- −$435
- Net cashflow
- $-73
Break-even live
UW: 25.0% down · 7.5% · 30yr · 1.5% tax · 5.0% vac · 8.0% maint · 8.0% mgmt
Financing live
Cash to close
- Down payment
- $70,000
- Closing costs
- $8,400
- Reserves months
- —
- Total cash needed
- —
Loan-product check · same deal, 3 products live
Conventional
25% down · 7.5% · 30yr
- Down + closing
- —
- Monthly P&I
- —
- Monthly cashflow
- —
- DSCR
- —
- Eligible?
- —
Personal DTI + credit; lowest rate.
DSCR
20% down · 8.5% · 30yr
- Down + closing
- —
- Monthly P&I
- —
- Monthly cashflow
- —
- DSCR
- —
- Eligible?
- —
No personal income docs; deal must DSCR.
Hard money
10% down · 12.0% · 12mo
- Down + closing
- —
- Monthly P&I
- —
- Monthly cashflow
- —
- DSCR
- —
- Eligible?
- —
Short-term bridge; refi at stabilization.
Listing history 18 events
-
2026-06-18days on market $280,000 Coming Soon 39 DOM
-
2026-06-17days on market $280,000 Coming Soon 38 DOM
-
2026-06-16days on market $280,000 Coming Soon 37 DOM
-
2026-06-15days on market $280,000 Coming Soon 36 DOM
-
2026-06-13days on market $280,000 Coming Soon 34 DOM
-
2026-06-12days on market $280,000 Coming Soon 33 DOM
-
2026-06-09days on market $280,000 Coming Soon 30 DOM
-
2026-06-08days on market $280,000 Coming Soon 29 DOM
-
2026-06-07days on market $280,000 Coming Soon 28 DOM
-
2026-06-07days on market $280,000 Coming Soon 27 DOM
-
2026-06-04days on market $280,000 Coming Soon 24 DOM
-
2026-06-02days on market $280,000 Coming Soon 23 DOM
-
2026-06-01days on market $280,000 Coming Soon 22 DOM
-
2026-05-31days on market $280,000 Coming Soon 21 DOM
-
2026-05-31days on market $280,000 Coming Soon 20 DOM
-
2026-05-11historical $280,000 676-char remark
-
2008-02-29soldstatus $70,000
-
2005-10-24soldstatus $45,000
ⓘ Source: listings_history table (triggers on properties + properties_extension) + one-shot
backfill from property_details.listing_events for pre-trigger history.
Tax reassessment forecast MD · Partial reset (capped growth)
- Current annual tax
- $1,470 · $123/mo
- Projected year-2 tax
- $2,261 · $188/mo
- Expected delta
- +$791/yr (+$66/mo · 53.8%)
ⓘ Screening estimate from a state-policy table — verify with the county assessor before closing.
Climate risk First Street
- Flood 1/10 Low FEMA zone X (unshaded) · 0% chance over 30 yrs
- Wildfire 1/10 Low
- Heat 8/10 Severe 7 d/yr ≥105°F today · 16 d/yr by 30 yrs out
- Wind 6/10 Major 64% chance of damaging wind over 30 yrs
- Air quality 3/10 Moderate 2 unhealthy d/yr today · 3 by 30 yrs out
Nearby sold comps map
Loading sold comps map…
Walkable amenities ~0.75 mi
Loading nearby amenities…
Taxation est. · year 1
- Rental income
- $24,834
- − Mortgage interest
- −$15,684
- − Property taxes
- −$1,470
- − Insurance
- −$1,400
- − Repairs & maintenance
- −$1,987
- − Management
- −$1,987
- − Depreciation
- −$8,145
- Taxable loss
- −$5,839
- Est. tax savings @ 24.0%
- +$1,401
- After-tax cash flow
- $530/yr
For passive investors: Depreciation is non-cash, so a rental often shows a tax loss while cash-flowing — sheltering income. Rental losses are passive: they offset passive income freely, and up to $25,000/yr can offset ordinary (W-2) income if you actively participate and your MAGI is under $100k (phasing out to $0 by $150k); unused losses carry forward. On sale, claimed depreciation is recaptured at up to 25%, and gains may owe capital-gains tax (a 1031 exchange can defer both). Figures are a year-1 estimate at your 24.0% rate — not tax advice; consult a CPA.
Schools (NCES district)
- District
- Dorchester County Public Schools
- NCES district ID
- 2400300
- Math proficiency
- 10% ▼ -14.00%
- Reading proficiency
- 23% ▼ -12.00%
- Median HH income
- $46,767
- Composite
- 14.65/100
- National rank
- #9404
- State rank
- #23 of 24 in MD
Livability — Hurlock
- Score
- 61/100
- State rank
- #332
- US rank
- #17536
Category grades
Schools grade is shown separately in the Schools card above.
Census & demographics
- Census place
- Hurlock, MD
- Population (ZIP)
- 5,176
Population outlook (Dorchester County) Hauer SSP2
- Today (2025)
- 31,699 people
- By 2030
- 31,054 · -2.0%
- By 2040
- 29,712 · -6.3%
- By 2050
- 28,618 · -9.7%
- By 2075
- 28,436 · -10.3%
- By 2100
- 28,937 · -8.7%
Race, ethnicity, and origin ACS 2023
- Neighborhood character
- Diverse neighborhood (Simpson 0.55)
- Race & ethnicity
- White 61% Black 28% Two or more races 5% Hispanic / Latino 4%
- Common ancestry
- Lithuanian 2% Italian 2% Romanian 1%
- Foreign-born
- 3% · Canada
- Languages at home
- 96% English-only · Spanish 3%
Political lean MEDSL · Dorchester
- 2024 margin
- R (+14.6) · D 41.6% · R 56.1% · Other 2.3%
- 2008→2024 swing
- -6.3pp toward R · 2008: -8.2pp · 2024: -14.6pp
- All cycles
- 2024: R+14.6 2020: R+11.9 2016: R+16.0 2012: R+6.6 2008: R+8.2
Not yet ingested
- Civics
- —
Market trends
- HPI YoY
- ▲ 52.36%
- Current HPI
- 390.419
- Rent YoY
- —
- Metro
- —
- State GDP YoY
- ▲ 2.97%
- F500 in state
- 12
Industry mix (Fortune 500 HQ in MD)
| Industry | F500 HQs | Revenue |
|---|---|---|
| Aerospace / Defense | 1 | $71B |
|
||
| Utilities | 1 | $25B |
|
||
| Hotels | 1 | $24B |
|
||
| Consumer Goods | 1 | $7B |
|
||
| Real Estate | 1 | $6B |
|
||
| Chemicals | 1 | $2B |
|
||
Price history
+522.2% since first listed3 events — show timeline
- 2026-05-11 Coming Soon $280,000 BRIGHT MLS
- 2008-02-29 Sold (Public Records) $70,000 Public Records
- 2005-10-24 Sold (Public Records) $45,000 Public Records
Property tax history
+2.4%/yrLatest (2025): $1,470 · +9.1% YoY. Source: county tax records.
Cash-flow waterfall
monthlySold comps — $/sqft
last 12 mo · ≤1 miLoading sold comps…