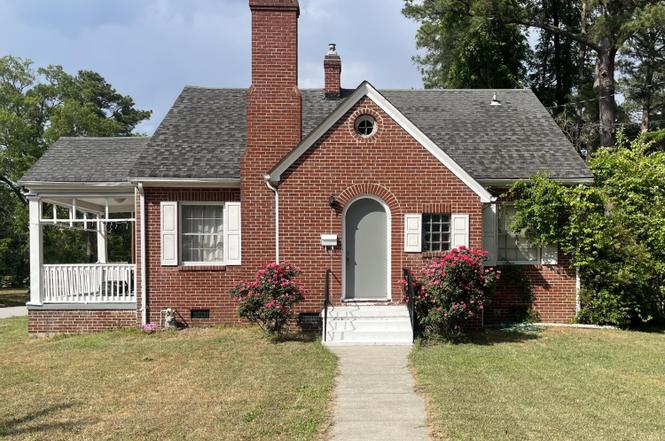
1534 W Thomas St · Rocky Mount, NC
Flood risk 1/10 · Minimal
- FEMA flood zone
- X (shaded)
- Chance of flooding over 30 yrs
- 0.0%
- Est. flood insurance / yr
- $507 – $1,088
Fire risk 3/10 · Minor
- Est. fire insurance / yr
- $906 – $1,684
Heat risk 7/10 · Major
- Hot days now (above 109°F)
- 7 days/yr
- Hot days in 30 yrs
- 16 days/yr
Wind risk 7/10 · Major
- Chance of severe wind over 30 yrs
- 78.0%
Air-quality risk 2/10 · Minimal
- Unhealthy air days now
- 0 days/yr
- Unhealthy air days in 30 yrs
- 1 days/yr
Risk factors via First Street. Map © Google.
Why this score? — see what drove the D+ grade
The composite is a weighted blend of 9 inputs, each scored 0–100. Each bar is that input's sub-score; the figure is the points it added to the 100-point composite (weight × sub-score).
- Cash flow +16.0/30.0
- ARV discount +11.9/15.0
- DSCR +4.9/10.0
- Livability +3.5/5.0
- 1% rule +3.2/10.0
- Rent growth +2.5/5.0
- Condition / age +2.5/5.0
- Schools +2.2/10.0
- Appreciation +0.0/10.0
$194,000
🖨 Deal sheet 📄 Offer letter ✓ Due diligence
Listing remarks MLS
Older home just waiting for someone to love and renovate it. Located on W. Thomas with view of lake and Sunset Park at the rear. Has huge attic and full basement. Basement has 2-garage doors for parking.
Key facts
- Formal dining room
- Massive attic
- Full basement
Tags
Property features AI
Finance
- Other: Zoned R-10; Lot dimensions approximately 75 x 150 (0.26 acres); Subdivision: Mayo Heights
Exterior
- Parking: Attached 2-car garage; Off-street parking (2 spaces total)
- Utilities: Public water; Sewer available; Water available
- Home design: Single-family residence; One story; Entry level: 1
- Construction: Brick construction (see remarks); Foundation details: see remarks; Built: see remarks
- Exterior features: Front porch; Chain link fencing; Shingle/composition roof
Interior
- Bedrooms: 6 total rooms (includes bedrooms and living spaces)
- Flooring: Carpet; Vinyl; Wood
- Bathrooms: 1 full bathroom
- Heating & cooling: Central air conditioning; Forced air heating; Natural gas heating
- Interior features: Basement; Has view
Neighborhood map
What this means for you Summary
Snapshot
- This is a 4-bed/1.0-bath single-family listed at $194k.
Deal economics
- At list price, monthly cash flow is $95 ($1k/yr) — positive.
- The deal already cash-flows at list — no discount required.
- To meet the 1% rule (rent ≥ 1% of price), the offer needs to be $158k (18.4% below list).
- Recommended offer: $158k (18.4% below list) — sets the bar for 1% rule.
- Cap rate 6.9% vs local median 4.5% in Rocky Mount — top-decile yield for the area; either an underpriced asset or a hidden risk that comps aren't pricing in. Stress-test before assuming the spread holds.
Location & tenants
- Location reads 70/100 on livability (#134 in NC) — a middle-class / working-renter tenant base. Strengths: cost of living A+, housing A+, health & safety A+; Watch: crime F, amenities F, employment F.
- Nash-Rocky Mount Schools (rural): math 20% / reading 32% proficiency, ranked #155 of 178 in NC (top 87%) — low school quality limits family demand, transient renter base, plan for 1-2y turnover.
- Zoned schools: Englewood Elementary (math 18% / reading 28%, grade F, #1,168 of 1,410 statewide, top 83%, 559 students, 74% FRL); Rocky Mount Middle (math 7% / reading 26%, grade F, #449 of 475 statewide, top 96%, 407 students, 97% FRL); Rocky Mount High (math 27% / reading 36%, grade F, #449 of 535 statewide, top 85%, 1,072 students, 76% FRL) — zoned schools average 82% FRL vs 59% district-wide (23 pts higher); higher-poverty schools than district average — tighter screening recommended.
- Market conditions: Rents soft (-0.2%/yr); 392 active listings in the ZIP; 500 units permitted in Nash County in 2024 (0 in 5+ unit buildings).
- This rent runs 31% of the median local income ($61k/yr) — at the standard rent-burdened threshold; future hikes will face affordability resistance.
Forward outlook
- Local home prices are declining (-3.0%/yr); year-one equity from $1k of loan paydown is wiped out by about $6k of value loss. Plan a longer hold.
- Nash County population projected at -12% by 2050 — secular population decline; favor cash flow + early exit over multi-decade hold.
Negotiation context
- It's been on market 121 days — a 12% lower offer ($171k) is reasonable based on typical stale-listing flexibility.
- 2 sale attempts since 13y ago; this cycle's ask has dropped $31k (14%) from the opening price — seller is motivated, your offer sets the floor, not the list.
- Current owner paid $22k; list at $194k implies a 792% gain — meaningful room to come down on a strong offer.
Risks & watch-outs
- Watch-outs: built in 1949 — expect roof / HVAC / electrical / plumbing capex.
- Climate carrying-cost: major wind risk, 78% chance of damaging wind over 30y; extreme-heat days projected 7→16/yr by 2055 (HVAC capex compounding) — expect insurance premiums to compound above CPI over the hold.
Questions for the listing agent
- It's been on market 121 days. Have you received any prior offers? Is the seller open to a 18% concession, seller financing, or rate buy-down credit?
- Built in 1949 — when were the roof, HVAC, electrical panel, plumbing, and water heater last replaced?
- Why hasn't it sold? Are there any deal-killer items the seller is aware of (foundation, flood, title, zoning, code violations)?
- Is there a deadline driving the sale (1031 exchange, divorce, estate, relocation)? That informs how much negotiation room exists.
- Schools are F-rated, which usually means shorter tenancies and higher turnover. Who's the typical renter profile here, and what's been the actual vacancy rate?
- Crime grade is F in this area — have there been break-ins, vandalism, or insurance claims at this property in the last 3 years? What carrier currently insures it and at what premium?
- The area grade is low — what's the realistic commute time and amenity access for the typical tenant pool here? Any planned neighborhood developments (good or bad) we should know about?
- What's the average days-on-market for RENTAL listings here right now (not sales)? A rising rental-DOM trend means longer vacancies and softer asking-rent achievability than the comps imply.
- What's the recent tenant-quality profile in this submarket — average credit score on applications, eviction rate, late-payment / NSF rate, and stable-employment percentage? A property-management company in the area should have these aggregated.
- How much new for-sale + rental construction is in the pipeline within 1–3 miles? Heavy new supply typically softens prices + rents 12–24 months out; constrained supply supports both.
Investment metrics
- 1% rule
- 0.82% ✗
- Cap rate
- 6.88%
- Cash-on-cash
- 2.10%
- DSCR
- 1.09
- GRM
- 10.2
CMA / ARV
- ARV (on-the-fly)
- $215,160
- Comps found
- 9
Show comp detail 9 sales within ~0.75 mi
| Address | Dist | Beds/Ba | Sqft | Sold | Price | $/sf | Match |
|---|---|---|---|---|---|---|---|
| 1148 Sunset Ave | 0.38mi | 3/1.0 (-1) | 1,643 (-8%) | 1mo | $149,000 | $91 | 63 |
| 1513 Beal St | 0.11mi | 3/2.0 (-1) | 1,568 (-12%) | 15mo | $222,000 | $142 | 52 |
| 1521 Beal St | 0.11mi | 3/1.5 (-1) | 1,530 (-15%) | 14mo | $200,000 | $131 | 52 |
| 1209 Alta Vista Ln | 0.66mi | 3/2.0 (-1) | 1,908 (+6%) | 6mo | $307,500 | $161 | 44 |
| 205 Dover Rd | 0.72mi | 3/2.0 (-1) | 1,940 (+8%) | 1mo | $320,000 | $165 | 43 |
| 521 S Taylor St | 0.57mi | 3/2.0 (-1) | 1,978 (+10%) | 7mo | $130,000 | $66 | 41 |
| 508 S Taylor St | 0.57mi | 3/2.0 (-1) | 2,042 (+14%) | 3mo | $225,000 | $110 | 38 |
| 625 Glenn Ave | 0.66mi | 3/2.0 (-1) | 1,702 (-5%) | 21mo | $204,000 | $120 | 34 |
| 1001 Sunset Ave | 0.56mi | 3/1.5 (-1) | 1,550 (-14%) | 14mo | $108,000 | $70 | 33 |
Match score weights: distance 35% · size 25% · config 20% · recency 20%. Top-matched comps best support the ARV.
Projected returns pro-forma
-3.0% appreciation · 0.0% rent growth · sell at horizon
- IRR
- -16.0%
- Equity multiple
- 0.45×
- Total profit
- $-30,118
- Equity at exit
- $28,926
- IRR
- -13.1%
- Equity multiple
- 0.32×
- Total profit
- $-36,736
- Equity at exit
- $16,774
Cash invested: $54,320 (down + closing). Projections, not guarantees.
Landlord ↔ Tenant lean methodology
- Overall (STATE)
- 85 Strongly Landlord-Friendly
- State North Carolina
- 85 Strongly Landlord-Friendly · R+3
- County
- — inherits STATE
- City
- — inherits STATE
ZIP-level market 27804
- Rents YoY
- -0.2%
- Active inventory
- 392
- Price-to-rent
- 10.2×
Monthly cashflow live
- Estimated rent
- $1,584 medium interval (Pro) →
- Mortgage (P&I)
- −$1,017
- Tax from tax record
- −$58 /mo · $694/yr
- Insurance
- −$81
- HOA
- −$0
- Vacancy / Maint / Mgmt
- −$333
- Net cashflow
- $95
Break-even live
UW: 25.0% down · 7.5% · 30yr · 1.5% tax · 5.0% vac · 8.0% maint · 8.0% mgmt
Financing live
Cash to close
- Down payment
- $48,500
- Closing costs
- $5,820
- Reserves months
- —
- Total cash needed
- —
Loan-product check · same deal, 3 products live
Conventional
25% down · 7.5% · 30yr
- Down + closing
- —
- Monthly P&I
- —
- Monthly cashflow
- —
- DSCR
- —
- Eligible?
- —
Personal DTI + credit; lowest rate.
DSCR
20% down · 8.5% · 30yr
- Down + closing
- —
- Monthly P&I
- —
- Monthly cashflow
- —
- DSCR
- —
- Eligible?
- —
No personal income docs; deal must DSCR.
Hard money
10% down · 12.0% · 12mo
- Down + closing
- —
- Monthly P&I
- —
- Monthly cashflow
- —
- DSCR
- —
- Eligible?
- —
Short-term bridge; refi at stabilization.
Listing history 21 events
-
2026-06-19days on market $194,000 Active 121 DOM
-
2026-06-18days on market $194,000 Active 120 DOM
-
2026-06-17days on market $194,000 Active 119 DOM
-
2026-06-16days on market $194,000 Active 118 DOM
-
2026-06-15days on market $194,000 Active 117 DOM
-
2026-06-14days on market $194,000 Active 115 DOM
-
2026-06-13days on market $194,000 Active 114 DOM
-
2026-06-10days on market $194,000 Active 112 DOM
-
2026-06-09days on market $194,000 Active 111 DOM
-
2026-06-08days on market $194,000 Active 110 DOM
-
2026-06-07days on market $194,000 Active 109 DOM
-
2026-06-03days on market $194,000 Active 105 DOM
-
2026-06-02days on market $194,000 Active 104 DOM
-
2026-06-01days on market $194,000 Active 103 DOM
-
2026-05-31days on market $194,000 Active 102 DOM
-
2026-05-30days on market $194,000 Active 101 DOM
-
2026-04-28price $194,000
-
2026-03-16price $199,998
-
2026-02-18$225,000 Active
-
2014-06-17soldstatus $21,750 203-char remark
Show marketing remark (203 chars)
Older home just waiting for someone to love and renovate it. Located on W. Thomas with view of lake and Sunset Park at the rear. Has huge attic and full basement. Basement has 2-garage doors for parking.
-
2013-12-18$29,900 203-char remark
Show marketing remark (203 chars)
Older home just waiting for someone to love and renovate it. Located on W. Thomas with view of lake and Sunset Park at the rear. Has huge attic and full basement. Basement has 2-garage doors for parking.
ⓘ Source: listings_history table (triggers on properties + properties_extension) + one-shot
backfill from property_details.listing_events for pre-trigger history.
Tax reassessment forecast NC · Resets to sale price
- Current annual tax
- $694 · $58/mo
- Projected year-2 tax
- $1,591 · $133/mo
- Expected delta
- +$897/yr (+$75/mo · 129.3%)
ⓘ Screening estimate from a state-policy table — verify with the county assessor before closing.
Climate risk First Street
- Flood 1/10 Low FEMA zone X (shaded) · 0% chance over 30 yrs
- Wildfire 3/10 Moderate
- Heat 7/10 Severe 7 d/yr ≥109°F today · 16 d/yr by 30 yrs out
- Wind 7/10 Severe 78% chance of damaging wind over 30 yrs
- Air quality 2/10 Low 0 unhealthy d/yr today · 1 by 30 yrs out
Nearby sold comps map
Loading sold comps map…
Walkable amenities ~0.75 mi
Loading nearby amenities…
Taxation est. · year 1
- Rental income
- $19,002
- − Mortgage interest
- −$10,867
- − Property taxes
- −$694
- − Insurance
- −$970
- − Repairs & maintenance
- −$1,520
- − Management
- −$1,520
- − Depreciation
- −$5,644
- Taxable loss
- −$2,213
- Est. tax savings @ 24.0%
- +$531
- After-tax cash flow
- $1,671/yr
For passive investors: Depreciation is non-cash, so a rental often shows a tax loss while cash-flowing — sheltering income. Rental losses are passive: they offset passive income freely, and up to $25,000/yr can offset ordinary (W-2) income if you actively participate and your MAGI is under $100k (phasing out to $0 by $150k); unused losses carry forward. On sale, claimed depreciation is recaptured at up to 25%, and gains may owe capital-gains tax (a 1031 exchange can defer both). Figures are a year-1 estimate at your 24.0% rate — not tax advice; consult a CPA.
Schools (NCES district)
- District
- Nash-Rocky Mount Schools
- NCES district ID
- 3703270
- Math proficiency
- 20% ▼ -3.00%
- Reading proficiency
- 32% ▲ 1.00%
- Median HH income
- $41,553
- Composite
- 22.04/100
- National rank
- #8198
- State rank
- #155 of 178 in NC
Livability — Rocky Mount
- Score
- 70/100
- State rank
- #134
- US rank
- #7692
Category grades
Schools grade is shown separately in the Schools card above.
Census & demographics
- Census place
- Rocky Mount, NC
- County
- Nash County · 50,768 people
- City population
- 70,300
- Metro
- Rocky Mount, NC
- Population (ZIP)
- 30,713
- Household income
- $61,359
- Rent vs Own
- Severe rent burden
- 710.0
Population outlook (Nash County) Hauer SSP2
- Today (2025)
- 91,107 people
- By 2030
- 89,193 · -2.1%
- By 2040
- 84,959 · -6.7%
- By 2050
- 80,517 · -11.6%
- By 2075
- 72,941 · -19.9%
- By 2100
- 63,602 · -30.2%
Race, ethnicity, and origin ACS 2023
- Neighborhood character
- Diverse neighborhood (Simpson 0.59)
- Race & ethnicity
- Black 52% White 38% Hispanic / Latino 6% Two or more races 3% Asian 1%
- Hispanic origin (detail)
- Mexican 2%
- Common ancestry
- Lithuanian 1% Italian 1% Slovak 1%
- Foreign-born
- 4% · Canada
- Languages at home
- 94% English-only · Spanish 5% Other Indo-European 1%
Political lean MEDSL · Nash
- 2024 margin
- Toss-up / Even · D 48.7% · R 50.5%
- 2008→2024 swing
- -0.4pp no change · 2008: -1.3pp · 2024: -1.8pp
- All cycles
- 2024: R+1.8 2020: D+0.2 2016: R+0.2 2012: D+0.9 2008: R+1.3
Not yet ingested
- Civics
- —
Market trends
- HPI YoY
- ▼ -142.83%
- Current HPI
- 183.0082
- Rent YoY
- ▼ -0.17%
- Metro
- Rocky Mount, NC
- State GDP YoY
- ▲ 3.28%
- F500 in state
- 26
Industry mix (Fortune 500 HQ in NC)
| Industry | F500 HQs | Revenue |
|---|---|---|
| Financial Services | 2 | $213B |
|
||
| Retail | 2 | $95B |
|
||
| Industrial Conglomerate | 1 | $38B |
|
||
| Metals / Steel | 1 | $35B |
|
||
| Utilities | 1 | $30B |
|
||
| Industrial Machinery | 1 | $19B |
|
||
Price history
+548.8% since first listed5 events — show timeline
- 2026-04-28 Price Changed $194,000 Hive MLS
- 2026-03-16 Price Changed $199,998 Hive MLS
- 2026-02-18 Listed $225,000 Hive MLS
- 2014-06-17 Sold (MLS) $21,750 Hive MLS
- 2013-12-18 Listed $29,900 Hive MLS
Property tax history
+2.0%/yrLatest (2025): $694 · +0.0% YoY. Source: county tax records.
Cash-flow waterfall
monthlySold comps — $/sqft
last 12 mo · ≤1 miLoading sold comps…