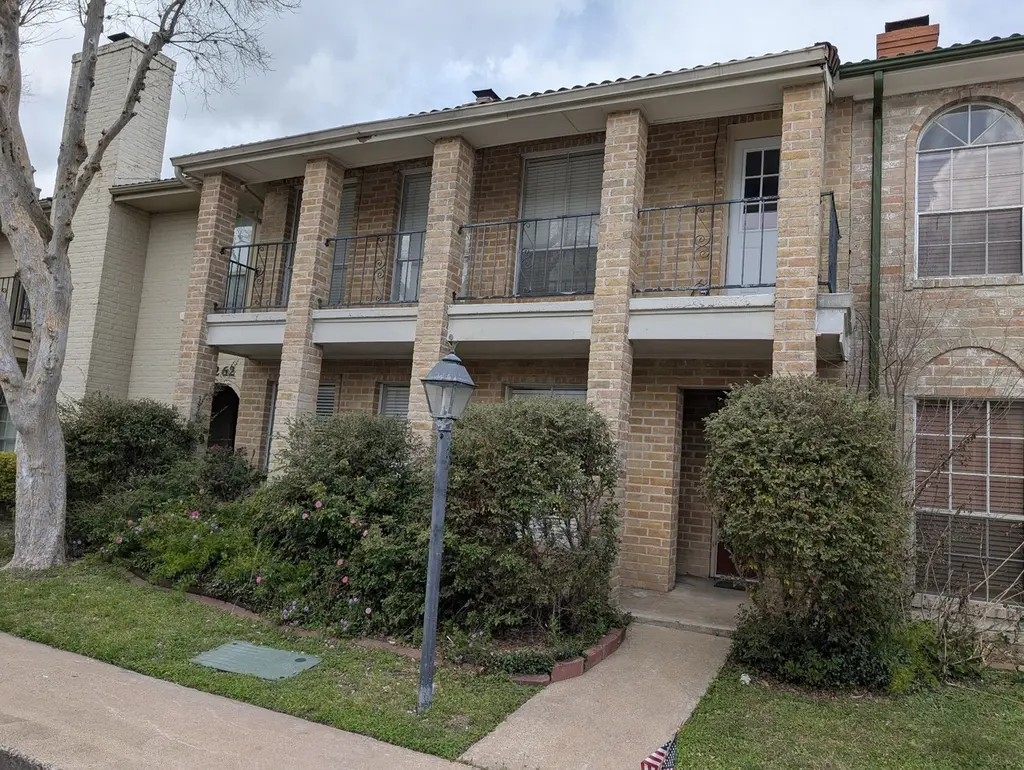
3258 Continental Dr · Missouri City, TX
Flood risk 6/10 · Moderate
- FEMA flood zone
- X (unshaded)
- Chance of flooding over 30 yrs
- 0.74%
- Est. flood insurance / yr
- $507 – $1,088
Fire risk 1/10 · Minimal
- Est. fire insurance / yr
- $1,222 – $2,270
Heat risk 9/10 · Severe
- Hot days now (above 110°F)
- 7 days/yr
- Hot days in 30 yrs
- 24 days/yr
Wind risk 9/10 · Severe
- Chance of severe wind over 30 yrs
- 99.0%
Air-quality risk 2/10 · Minimal
- Unhealthy air days now
- 2 days/yr
- Unhealthy air days in 30 yrs
- 2 days/yr
Risk factors via First Street. Map © Google.
Why this score? — see what drove the D grade
The composite is a weighted blend of 9 inputs, each scored 0–100. Each bar is that input's sub-score; the figure is the points it added to the 100-point composite (weight × sub-score).
- Cash flow +14.6/30.0
- 1% rule +5.2/10.0
- DSCR +4.5/10.0
- Schools +4.5/10.0
- Appreciation +4.2/10.0
- Livability +3.4/5.0
- Rent growth +2.5/5.0
- Condition / age +2.5/5.0
- ARV discount +1.4/15.0
$240,000
🖨 Deal sheet (PDF) 📄 Offer letter ✓ Due diligence
Listing remarks MLS
This spacious townhome in the complex boasts tile roofs and large rooms. With a new flooring throughout, updates in kitchen and bathrooms, garage, and extra parking in the back, convenience is key. Enjoy an indoor utility room, patio area, and wet bar for entertaining. This 4 bed, 3.5 bath home is very spacious. Ready for the a new owner. Community pool is just out the back door.
Key facts
- $158 HOA
- Garage
- Community pool
Neighborhood map
What this means for you Summary
Snapshot
- This is a 4-bed/4.0-bath townhouse listed at $240k.
Deal economics
- At list price, monthly cash flow is $58 ($702/yr) — positive.
- The deal already cash-flows at list — no discount required.
- Meets the 1% rule at list price ($2k rent vs $240k).
- Recommended offer: $226k (6.0% below list) — sets the bar for market timing.
- Cap rate 6.6% vs local median 3.6% in Missouri City — top-decile yield for the area; either an underpriced asset or a hidden risk that comps aren't pricing in. Stress-test before assuming the spread holds.
Location & tenants
- Location reads 67/100 on livability (#526 in TX) — a middle-class / working-renter tenant base. Strengths: housing A+, crime A, employment A; Watch: amenities F, commute F, health & safety F.
- Fort Bend ISD (suburban): math 44% / reading 53% proficiency, ranked #140 of 826 in TX (top 17%) — families likely to look elsewhere, expect single-tenant / working-renter base with shorter leases.
- Zoned schools: Quail Valley El (math 27% / reading 42%, grade F, #1,995 of 4,322 statewide, top 50%, 564 students, 64% FRL); Quail Valley Middle (math 55% / reading 57%, grade B-, #234 of 1,662 statewide, top 14%, 1,043 students, 45% FRL); Fort Bend Co Alter (26 students, 0% FRL) — zoned schools at 36% FRL track the district average.
- Market conditions: Rents soft (-0.1%/yr); 1229 active listings in the ZIP; 12 comparable units currently listed for rent nearby; rentals at typical pace (median 23d on market — plan ~3-4 weeks tenant-placement turnaround); high-income renter base; 12,093 units permitted in Fort Bend County in 2024 (815 in 5+ unit buildings).
Forward outlook
- Local home prices are declining (-1.7%/yr); year-one equity from $2k of loan paydown is wiped out by about $4k of value loss. Plan a longer hold.
- Fort Bend County population projected at +75% by 2050 — long-run rental-demand tailwind backs the buy-and-hold thesis.
Negotiation context
- It's been on market 77 days — a 6% lower offer ($226k) is reasonable based on typical stale-listing flexibility.
- 3 sale attempts with the ask held roughly flat each time — persistent listings suggest the price (not the market) is what's stuck; bring a comps-based counter.
Risks & watch-outs
- Climate carrying-cost: major flood risk; severe wind risk, 99% chance of damaging wind over 30y; extreme-heat days projected 7→24/yr by 2055 (HVAC capex compounding) — expect insurance premiums to compound above CPI over the hold.
Questions for the listing agent
- It's been on market 77 days. Have you received any prior offers? Is the seller open to a 6% concession, seller financing, or rate buy-down credit?
- Built in 1972 — when were the roof, HVAC, electrical panel, plumbing, and water heater last replaced?
- What does the HOA fee cover, when was the last increase, and are there any pending special assessments or reserve-fund shortfalls?
- Why hasn't it sold? Are there any deal-killer items the seller is aware of (foundation, flood, title, zoning, code violations)?
- Is there a deadline driving the sale (1031 exchange, divorce, estate, relocation)? That informs how much negotiation room exists.
- Schools are B-rated — typically a magnet for longer-tenancy family renters. What's the average tenant stay here, and is there a school-zone premium baked into asking?
- The area grade is low — what's the realistic commute time and amenity access for the typical tenant pool here? Any planned neighborhood developments (good or bad) we should know about?
- What's the average days-on-market for RENTAL listings here right now (not sales)? A rising rental-DOM trend means longer vacancies and softer asking-rent achievability than the comps imply.
- What's the recent tenant-quality profile in this submarket — average credit score on applications, eviction rate, late-payment / NSF rate, and stable-employment percentage? A property-management company in the area should have these aggregated.
- How much new for-sale + rental construction is in the pipeline within 1–3 miles? Heavy new supply typically softens prices + rents 12–24 months out; constrained supply supports both.
Investment metrics
- 1% rule
- 1.02% ✓
- Cap rate
- 6.59%
- Cash-on-cash
- 1.04%
- DSCR
- 1.05
- GRM
- 8.1
CMA / ARV
- ARV (median comp)
- $211,362
- List price
- $240,000
- Delta
- 13.55%
- Verdict
- OVERPRICED
- Comps
- 20 within 1.0 mi
Show comp detail 9 sales within ~0.75 mi
| Address | Dist | Beds/Ba | Sqft | Sold | Price | $/sf | Match |
|---|---|---|---|---|---|---|---|
| 3306 Continental Dr | 0.03mi | 3/2.5 (-1) | 2,352 (0%) | 4mo | $189,000 | $80 | 84 |
| 3314 Continental Dr | 0.04mi | 4/3.5 | 2,352 (0%) | 20mo | $190,000 | $81 | 79 |
| 2513 Oak Hill Dr | 0.12mi | 4/2.5 | 2,265 (-4%) | 21mo | $229,000 | $101 | 65 |
| 3371 Continental Dr | 0.09mi | 3/2.5 (-1) | 2,041 (-13%) | 2mo | $209,995 | $103 | 61 |
| 2907 Nottingham Ln | 0.37mi | 4/3.0 | 2,223 (-6%) | 11mo | $225,000 | $101 | 61 |
| 2506 Hampshire Ln | 0.30mi | 4/3.0 | 2,223 (-6%) | 18mo | $230,000 | $103 | 58 |
| 46 T Huxley Ln | 0.41mi | 3/2.5 (-1) | 2,384 (+1%) | 13mo | $235,000 | $99 | 57 |
| 30 T Huxley Ln | 0.42mi | 3/2.5 (-1) | 2,232 (-5%) | 11mo | $179,000 | $80 | 52 |
| 4019 Waterford Ln | 0.75mi | 4/2.5 | 2,417 (+3%) | 12mo | $365,000 | $151 | 45 |
Match score weights: distance 35% · size 25% · config 20% · recency 20%. Top-matched comps best support the ARV.
Projected returns pro-forma
-1.67% appreciation · 0.0% rent growth · sell at horizon
- IRR
- -10.7%
- Equity multiple
- 0.58×
- Total profit
- $-28,513
- Equity at exit
- $50,335
- IRR
- -7.1%
- Equity multiple
- 0.48×
- Total profit
- $-34,736
- Equity at exit
- $46,622
Cash invested: $67,200 (down + closing). Projections, not guarantees.
Landlord ↔ Tenant lean methodology
- Overall (STATE)
- 87 Strongly Landlord-Friendly
- State Texas
- 87 Strongly Landlord-Friendly · R+5
- County
- — inherits STATE
- City
- — inherits STATE
ZIP-level market 77459
- Home prices YoY
- -0.8%
- Rents YoY
- -0.1%
- Active inventory
- 1229
- Price-to-rent
- 8.1×
Monthly cashflow live
- Estimated rent
- $2,457 high interval (Pro) →
- Mortgage (P&I)
- −$1,259
- Tax from tax record
- −$366 /mo · $4,387/yr
- Insurance
- −$100
- HOA
- −$158
- Vacancy / Maint / Mgmt
- −$516
- Net cashflow
- $58
Break-even live
Sensitivity live
| Price | -10% $194 | -5% $126 | +0% $58 | +5% $-9 | +10% $-77 |
|---|---|---|---|---|---|
| Rent | -10% $-136 | -5% $-39 | +0% $58 | +5% $156 | +10% $253 |
| Rate | -1.0pp $179 | -0.5pp $120 | base $58 | +0.5pp $-4 | +1.0pp $-67 |
UW: 25.0% down · 7.5% · 30yr · 1.5% tax · 5.0% vac · 8.0% maint · 8.0% mgmt
Financing live
Cash to close
- Down payment
- $60,000
- Closing costs
- $7,200
- Reserves months
- —
- Total cash needed
- —
Loan-product check · same deal, 3 products live
Conventional
25% down · 7.5% · 30yr
- Down + closing
- —
- Monthly P&I
- —
- Monthly cashflow
- —
- DSCR
- —
- Eligible?
- —
Personal DTI + credit; lowest rate.
DSCR
20% down · 8.5% · 30yr
- Down + closing
- —
- Monthly P&I
- —
- Monthly cashflow
- —
- DSCR
- —
- Eligible?
- —
No personal income docs; deal must DSCR.
Hard money
10% down · 12.0% · 12mo
- Down + closing
- —
- Monthly P&I
- —
- Monthly cashflow
- —
- DSCR
- —
- Eligible?
- —
Short-term bridge; refi at stabilization.
Rent comps 12 comps
| Address | Beds | Baths | Sqft | Rent | $/sqft | DOM | Units | Dist |
|---|---|---|---|---|---|---|---|---|
| 2120 Bermuda Dunes Dr Missouri City, TX | 3.0 | 2.5 | 2100 | $2,200 | $1.05 | 26d | 1 | 0.34mi |
| 3327 Shady Glen Ln Missouri City, TX | 4.0 | 2.5 | 2232 | $2,250 | $1.01 | 14d | 1 | 0.35mi |
| 2608 Grand Plantation Ct Missouri City, TX | 3.0 | 2.0 | 2150 | $2,450 | $1.14 | 14d | 1 | 0.81mi |
| 3611 Duncaster Dr Missouri City, TX | 3.0 | 2.5 | 1926 | $2,100 | $1.09 | 21d | 1 | 0.92mi |
| 2307 Hilton Head Dr Missouri City, TX | 4.0 | 2.0 | 2606 | $2,239 | $0.86 | 18d | 1 | 1.00mi |
| 2319 Quail Valley East Dr Missouri City, TX | 5.0 | 3.0 | 2235 | $2,000 | $0.89 | 45d | 1 | 1.00mi |
| 3512 Talia Wood Ct Missouri City, TX | 4.0 | 3.5 | 2950 | $2,900 | $0.98 | 12d | 1 | 1.02mi |
| 1547 Revolution Way Missouri City, TX | 3.0 | 3.0 | 1680 | $2,300 | $1.37 | 14d | 1 | 1.23mi |
| 1420 Revolution Way Missouri City, TX | 3.0 | 2.5 | 1649 | $2,250 | $1.36 | 45d | 1 | 1.35mi |
| 3912 Cedar Valley Dr Missouri City, TX | 3.0 | 2.0 | 2151 | $2,200 | $1.02 | 22d | 1 | 1.36mi |
| 2010 Quail Valley East Dr Missouri City, TX | 5.0 | 3.0 | 2651 | $2,695 | $1.02 | 45d | 1 | 1.39mi |
| 1935 Poco Dr Missouri City, TX | 4.0 | 3.0 | 2868 | $2,326 | $0.81 | 23d | 1 | 1.41mi |
HOA detail
- Monthly dues
- $158 · $1,896/yr
- Likely covers
- pool
Listing history 21 events
-
2026-06-21days on market $240,000 Active 77 DOM
-
2026-06-18days on market $240,000 Active 74 DOM
-
2026-06-17days on market $240,000 Active 73 DOM
-
2026-06-16days on market $240,000 Active 72 DOM
-
2026-06-15days on market $240,000 Active 71 DOM
-
2026-06-13days on market $240,000 Active 69 DOM
-
2026-06-09days on market $240,000 Active 65 DOM
-
2026-06-07pricedays on market $240,000 Active 63 DOM
-
2026-06-04days on market $244,000 Active 60 DOM
-
2026-06-03days on market $244,000 Active 59 DOM
-
2026-06-02days on market $244,000 Active 58 DOM
-
2026-06-01days on market $244,000 Active 57 DOM
-
2026-05-31days on market $244,000 Active 56 DOM
-
2026-04-06historical $2,000
-
2026-04-05$244,000 Active 382-char remark
Show marketing remark (382 chars)
This spacious townhome in the complex boasts tile roofs and large rooms. With a new flooring throughout, updates in kitchen and bathrooms, garage, and extra parking in the back, convenience is key. Enjoy an indoor utility room, patio area, and wet bar for entertaining. This 4 bed, 3.5 bath home is very spacious. Ready for the a new owner. Community pool is just out the back door.
-
2026-03-08$2,000
-
2025-12-29soldstatus
-
2025-12-19soldstatus Closed 346-char remark
Show marketing remark (346 chars)
This spacious townhome in the complex boasts tile roofs and large rooms. With a carport, garage, and extra parking in the back, convenience is key. Enjoy an indoor utility room, patio area, and wet bar for entertaining. This 4 bed, 3.5 bath home is very spacious. Needs TLC. Ready for the a new owner. Community pool is just out the back door.
-
2025-12-11status Pending 346-char remark
Show marketing remark (346 chars)
This spacious townhome in the complex boasts tile roofs and large rooms. With a carport, garage, and extra parking in the back, convenience is key. Enjoy an indoor utility room, patio area, and wet bar for entertaining. This 4 bed, 3.5 bath home is very spacious. Needs TLC. Ready for the a new owner. Community pool is just out the back door.
-
2025-12-05status Pending 346-char remark
Show marketing remark (346 chars)
This spacious townhome in the complex boasts tile roofs and large rooms. With a carport, garage, and extra parking in the back, convenience is key. Enjoy an indoor utility room, patio area, and wet bar for entertaining. This 4 bed, 3.5 bath home is very spacious. Needs TLC. Ready for the a new owner. Community pool is just out the back door.
-
2025-11-14$175,000 Active 346-char remark
Show marketing remark (346 chars)
This spacious townhome in the complex boasts tile roofs and large rooms. With a carport, garage, and extra parking in the back, convenience is key. Enjoy an indoor utility room, patio area, and wet bar for entertaining. This 4 bed, 3.5 bath home is very spacious. Needs TLC. Ready for the a new owner. Community pool is just out the back door.
ⓘ Source: listings_history table (triggers on properties + properties_extension) + one-shot
backfill from property_details.listing_events for pre-trigger history.
Tax reassessment forecast TX · Resets to sale price
- Current annual tax
- $4,387 · $366/mo
- Projected year-2 tax
- $4,392 · $366/mo
- Expected delta
- +$5/yr ($0/mo · 0.1%)
ⓘ Screening estimate from a state-policy table — verify with the county assessor before closing.
Climate risk First Street
- Flood 6/10 Major FEMA zone X (unshaded) · 74% chance over 30 yrs
- Wildfire 1/10 Low
- Heat 9/10 Extreme 7 d/yr ≥110°F today · 24 d/yr by 30 yrs out
- Wind 9/10 Extreme 99% chance of damaging wind over 30 yrs
- Air quality 2/10 Low 2 unhealthy d/yr today · 2 by 30 yrs out
Nearby sold comps map
Loading sold comps map…
Walkable amenities ~0.75 mi
Loading nearby amenities…
Taxation est. · year 1
- Rental income
- $29,479
- − Mortgage interest
- −$13,444
- − Property taxes
- −$4,387
- − Insurance
- −$1,200
- − Repairs & maintenance
- −$2,358
- − Management
- −$2,358
- − HOA
- −$1,896
- − Depreciation
- −$6,982
- Taxable loss
- −$3,147
- Est. tax savings @ 24.0%
- +$755
- After-tax cash flow
- $1,457/yr
For passive investors: Depreciation is non-cash, so a rental often shows a tax loss while cash-flowing — sheltering income. Rental losses are passive: they offset passive income freely, and up to $25,000/yr can offset ordinary (W-2) income if you actively participate and your MAGI is under $100k (phasing out to $0 by $150k); unused losses carry forward. On sale, claimed depreciation is recaptured at up to 25%, and gains may owe capital-gains tax (a 1031 exchange can defer both). Figures are a year-1 estimate at your 24.0% rate — not tax advice; consult a CPA.
Schools (NCES district)
- District
- Fort Bend ISD
- NCES district ID
- 4819650
- Math proficiency
- 44% ▼ -15.00%
- Reading proficiency
- 53% ▼ -4.00%
- Median HH income
- $82,360
- Composite
- 44.61/100
- National rank
- #2779
- State rank
- #140 of 826 in TX
Livability — Missouri City
- Score
- 67/100
- State rank
- #526
- US rank
- #10308
Category grades
Schools grade is shown separately in the Schools card above.
Census & demographics
- Census place
- Missouri City, TX
- County
- Fort Bend County · 836,777 people
- City population
- 123,513
- Metro
- Houston-The Woodlands-Sugar Land, TX
- Population (ZIP)
- 84,221
- Household income
- $129,151
- Rent vs Own
- Severe rent burden
- 1004.0
Population outlook (Fort Bend County) Hauer SSP2
- Today (2025)
- 1,004,526 people
- By 2030
- 1,153,104 · +14.8%
- By 2040
- 1,453,718 · +44.7%
- By 2050
- 1,753,781 · +74.6%
- By 2075
- 2,455,772 · +144.5%
- By 2100
- 2,930,528 · +191.7%
Race, ethnicity, and origin ACS 2023
- Neighborhood character
- Highly diverse neighborhood (Simpson 0.75)
- Race & ethnicity
- White 34% Black 26% Asian 22% Hispanic / Latino 13% Two or more races 10%
- Hispanic origin (detail)
- Mexican 7%
- Common ancestry
- Lithuanian 2% Slovak 1% Italian 1%
- Foreign-born
- 21% · Canada, China, Vietnam
- Languages at home
- 73% English-only · Other Asian/Pacific 8% Spanish 7% Other Indo-European 5%
Political lean MEDSL · Fort Bend
- 2024 margin
- Toss-up / Even · D 49.5% · R 47.9% · Other 2.6%
- 2008→2024 swing
- +4.0pp toward D · 2008: -2.4pp · 2024: 1.6pp
- All cycles
- 2024: D+1.6 2020: D+10.6 2016: D+6.6 2012: R+6.8 2008: R+2.4
Not yet ingested
- Civics
- —
Market trends
- HPI YoY
- ▼ -1.67%
- Current HPI
- 212.3573
- Rent YoY
- ▼ -0.15%
- Metro
- Houston-The Woodlands-Sugar Land, TX
- State GDP YoY
- ▲ 3.95%
- F500 in state
- 110
Industry mix (Fortune 500 HQ in TX)
| Industry | F500 HQs | Revenue |
|---|---|---|
| Energy | 16 | $1,198B |
|
||
| Technology | 5 | $198B |
|
||
| Engineering / Construction | 4 | $72B |
|
||
| Energy Services | 3 | $60B |
|
||
| Utilities | 3 | $41B |
|
||
| Healthcare | 2 | $330B |
|
||
Price history
-98.9% since first listed8 events — show timeline
- 2026-04-06 Rental Removed $2,000 HARMLS
- 2026-04-05 Listed $244,000 HARMLS
- 2026-03-08 Listed for Rent $2,000 HARMLS
- 2025-12-29 Sold (Public Records) — Public Records
- 2025-12-19 Sold (MLS) — HARMLS
- 2025-12-11 Pending — HARMLS
- 2025-12-05 Pending — HARMLS
- 2025-11-14 Listed $175,000 HARMLS
Property tax history
+2.7%/yrLatest (2025): $4,387 · +2.5% YoY. Source: county tax records.
Cash-flow waterfall
monthlySold comps — $/sqft
last 12 mo · ≤1 miLoading sold comps…