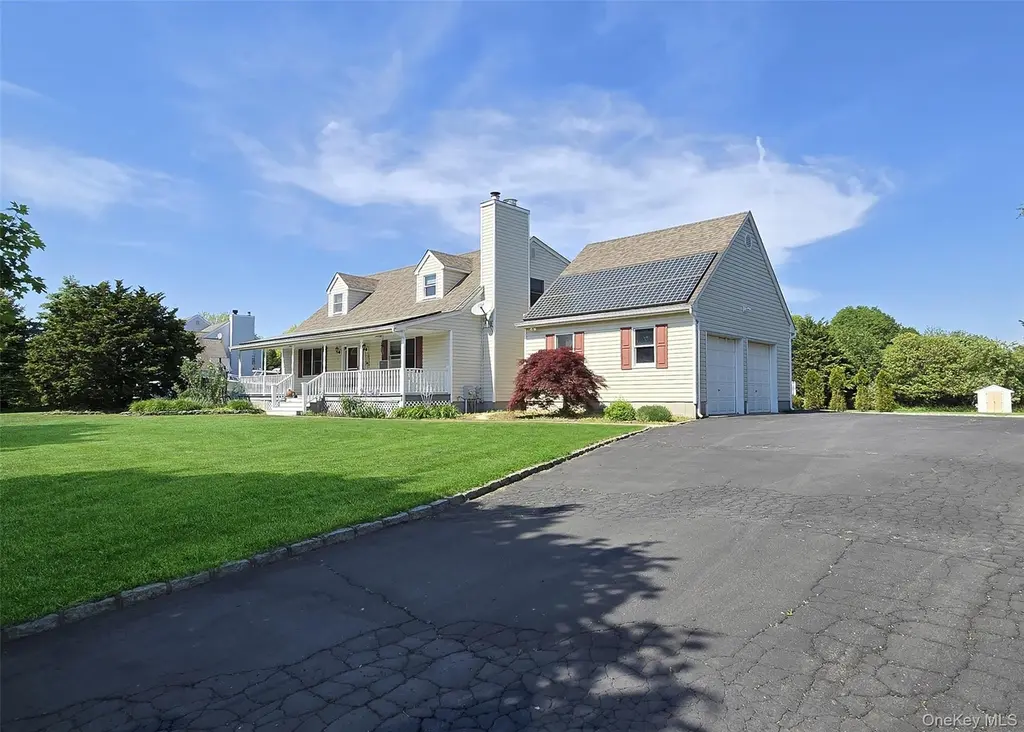
635 Farmveu Rd · Laurel, NY
Flood risk 1/10 · Minimal
- FEMA flood zone
- X (unshaded)
- Chance of flooding over 30 yrs
- 0.0%
- Est. flood insurance / yr
- $473 – $860
Fire risk 2/10 · Minimal
- Est. fire insurance / yr
- $691 – $1,283
Heat risk 5/10 · Moderate
- Hot days now (above 92°F)
- 7 days/yr
- Hot days in 30 yrs
- 19 days/yr
Wind risk 8/10 · Major
- Chance of severe wind over 30 yrs
- 80.0%
Air-quality risk 3/10 · Minor
- Unhealthy air days now
- 2 days/yr
- Unhealthy air days in 30 yrs
- 4 days/yr
Risk factors via First Street. Map © Google.
Why this score? — see what drove the B- grade
The composite is a weighted blend of 9 inputs, each scored 0–100. Each bar is that input's sub-score; the figure is the points it added to the 100-point composite (weight × sub-score).
- Cash flow +28.8/30.0
- DSCR +10.0/10.0
- ARV discount +7.5/15.0
- 1% rule +7.2/10.0
- Schools +6.1/10.0
- Livability +3.0/5.0
- Rent growth +2.5/5.0
- Condition / age +2.5/5.0
- Appreciation +0.0/10.0
$1,399,000
🖨 Deal sheet 📄 Offer letter ✓ Due diligence
Listing remarks
Welcome to the Heart of Northfork Living. Shop local farmstands, enjoy boating, winneries, town beaches, antique shops, and golf. This home is just minutes to "Love Lane" shopping district. Home sits on over an acre of well-maintained property. The backyard property is perfect for entertaining. Home features a wood burning fireplace; wood floors; in-ground sprinklers (front and back) with 10 zones; two-275 gal oil tanks; 200 amp electric service, 4 yr old roof and new slider; central vac with newer hoses; Large basement with laundry washer and dryer; 2 car garage and much more. Owned Solar Panels. Builder owner. Peconic tax and/or transfer tax applies to this property.
Key facts
- 1.08 acre lot
- 2 garage spots
- Built 1994
Property features AI
Finance
- HOA & community: Has homeowners association; Annual association fee of $200 (HOA)
Exterior
- Parking: Driveway; 2-car garage
- Utilities: Electric service provided by PSEG; Cesspool sewer; Cable connected; Electricity connected; Underground utilities
- Home design: Single-family residence; Actual property condition
- Construction: Frame construction
- Exterior features: Frame construction; No fencing; Not waterfront; No additional parcels
Interior
- Kitchen: Dishwasher; Electric oven; Electric range; Microwave; Refrigerator; Open kitchen layout; Pantry
- Bedrooms: Includes a first-floor bedroom
- Flooring: Wood flooring
- Bathrooms: Two full bathrooms; One half bathroom
- Heating & cooling: Oil heating; Wall/window air conditioning units
- Interior features: First-floor bedroom; Central vacuum; Formal dining; Open kitchen; Pantry; Primary bathroom; Storage; Washer/dryer hookup; Basement with walk-out access (partially finished with storage and unfinished areas)
- Laundry & utility: Washer; Dryer; Washer hookup; Electric dryer hookup (in basement)
Neighborhood map
What this means for you Summary
Snapshot
- This is a 4-bed/2.5-bath single-family listed at $1.40M.
Deal economics
- At list price, monthly cash flow is $5k ($56k/yr) — positive.
- The deal already cash-flows at list — no discount required.
- Meets the 1% rule at list price ($17k rent vs $1.40M).
- Recommended offer: $1.38M (1.5% below list) — sets the bar for market timing.
Location & tenants
- Location reads 60/100 on livability (#965 in NY) — a middle-class / working-renter tenant base. Strengths: crime A+, employment A+, housing B+; Watch: amenities F, commute F, cost of living F.
- Mattituck-Cutchogue Union Free School District (suburban): math 69% / reading 68% proficiency, ranked #127 of 590 in NY (top 22%) — acceptable for families but not a draw, mixed tenant base, ~2y average lease; only 16% free/reduced lunch — higher-income household profile.
- Zoned schools: Mattituck-Cutchogue Elementary School (math 65% / reading 68%, grade B+, #575 of 2,108 statewide, top 27%, 453 students, 37% FRL); Mattituck Junior-Senior High School (math 74% / reading 72%, grade B+, #670 of 1,100 statewide, top 61%, 548 students, 0% FRL) — zoned schools at 18% FRL track the district average.
- Market conditions: 49 active listings in the ZIP; 3 comparable units currently listed for rent nearby; rentals at typical pace (median 20d on market — plan ~3-4 weeks tenant-placement turnaround); 1,366 units permitted in Suffolk County in 2024 (216 in 5+ unit buildings).
Forward outlook
- Local home prices are declining (-3.0%/yr); year-one equity from $10k of loan paydown is wiped out by about $42k of value loss. Plan a longer hold.
- Suffolk County population projected to shrink 5% by 2050 — rents likely to lag national; underwrite the cash flow, not the appreciation.
- At projected returns (-3.0% appreciation + 3.0% rent growth), your $392k cash investment doubles in ~9 years — after that, you're playing with house money.
Negotiation context
- It's been on market 15 days — a 2% lower offer ($1.38M) is reasonable based on typical stale-listing flexibility.
Risks & watch-outs
- Climate carrying-cost: severe wind risk, 80% chance of damaging wind over 30y; extreme-heat days projected 7→19/yr by 2055 (HVAC capex compounding) — expect insurance premiums to compound above CPI over the hold.
Questions for the listing agent
- What does the HOA fee cover, when was the last increase, and are there any pending special assessments or reserve-fund shortfalls?
- Is there a deadline driving the sale (1031 exchange, divorce, estate, relocation)? That informs how much negotiation room exists.
- What's the average days-on-market for RENTAL listings here right now (not sales)? A rising rental-DOM trend means longer vacancies and softer asking-rent achievability than the comps imply.
- What's the recent tenant-quality profile in this submarket — average credit score on applications, eviction rate, late-payment / NSF rate, and stable-employment percentage? A property-management company in the area should have these aggregated.
- How much new for-sale + rental construction is in the pipeline within 1–3 miles? Heavy new supply typically softens prices + rents 12–24 months out; constrained supply supports both.
Investment metrics
- 1% rule
- 1.22% ✓
- Cap rate
- 10.33%
- Cash-on-cash
- 14.41%
- DSCR
- 1.64
- GRM
- 6.8
CMA / ARV
- ARV (on-the-fly)
- $899,800
- Comps found
- 3
Show comp detail 3 sales within ~0.75 mi
| Address | Dist | Beds/Ba | Sqft | Sold | Price | $/sf | Match |
|---|---|---|---|---|---|---|---|
| 5750 Aldrich Ln | 0.26mi | 4/2.5 | 2,200 (0%) | 0mo | $900,000 | $409 | 88 |
| 5660 Sound Ave | 0.39mi | 4/1.5 | 2,200 (0%) | 1mo | $740,000 | $336 | 77 |
| 1895 Aldrich Ln | 0.70mi | 3/2.5 (-1) | 2,400 (+9%) | 14mo | $1,470,000 | $613 | 35 |
Match score weights: distance 35% · size 25% · config 20% · recency 20%. Top-matched comps best support the ARV.
Projected returns pro-forma
-3.0% appreciation · 3.0% rent growth · sell at horizon
- IRR
- 4.8%
- Equity multiple
- 1.19×
- Total profit
- $72,564
- Equity at exit
- $208,595
- IRR
- 14.2%
- Equity multiple
- 2.14×
- Total profit
- $447,691
- Equity at exit
- $120,960
Cash invested: $391,720 (down + closing). Projections, not guarantees.
Landlord ↔ Tenant lean methodology
- Overall (STATE)
- 15 Strongly Tenant-Friendly
- State New York
- 15 Strongly Tenant-Friendly · D+10
- County
- — inherits STATE
- City
- — inherits STATE
ZIP-level market 11952
- Home prices YoY
- -17.2%
- Active inventory
- 49
- Price-to-rent
- 6.8×
Monthly cashflow live
- Estimated rent
- $17,036 medium interval (Pro) →
- Mortgage (P&I)
- −$7,337
- Tax from tax record
- −$818 /mo · $9,819/yr
- Insurance
- −$583
- HOA
- −$17
- Vacancy / Maint / Mgmt
- −$3,577
- Net cashflow
- $4,703
Break-even live
UW: 25.0% down · 7.5% · 30yr · 1.5% tax · 5.0% vac · 8.0% maint · 8.0% mgmt
Financing live
Cash to close
- Down payment
- $349,750
- Closing costs
- $41,970
- Reserves months
- —
- Total cash needed
- —
Loan-product check · same deal, 3 products live
Conventional
25% down · 7.5% · 30yr
- Down + closing
- —
- Monthly P&I
- —
- Monthly cashflow
- —
- DSCR
- —
- Eligible?
- —
Personal DTI + credit; lowest rate.
DSCR
20% down · 8.5% · 30yr
- Down + closing
- —
- Monthly P&I
- —
- Monthly cashflow
- —
- DSCR
- —
- Eligible?
- —
No personal income docs; deal must DSCR.
Hard money
10% down · 12.0% · 12mo
- Down + closing
- —
- Monthly P&I
- —
- Monthly cashflow
- —
- DSCR
- —
- Eligible?
- —
Short-term bridge; refi at stabilization.
Rent comps 3 comps
| Address | Beds | Baths | Sqft | Rent | $/sqft | DOM | Units | Dist |
|---|---|---|---|---|---|---|---|---|
| 2415 Cox Neck Rd Mattituck, NY | 5.0 | 3.5 | 2500 | $15,000 | $6.00 | 43d | 1 | 0.92mi |
| 6 Bay Run Riverhead, NY | 4.0 | 3.5 | 1901 | $25,000 | $13.15 | 19d | 1 | 1.27mi |
| 7 Eileen Cir Jamesport, NY | 3.0 | 2.0 | 1572 | $10,000 | $6.36 | 19d | 1 | 1.46mi |
HOA detail
- Monthly dues
- $17 · $204/yr
- Likely covers
- electric
Listing history 15 events
-
2026-06-18days on market $1,399,000 Active 15 DOM
-
2026-06-17days on market $1,399,000 Active 14 DOM
-
2026-06-16days on market $1,399,000 Active 13 DOM
-
2026-06-15days on market $1,399,000 Active 12 DOM
-
2026-06-13days on market $1,399,000 Active 10 DOM
-
2026-06-12pricedays on market $1,399,000 Active 9 DOM
-
2026-06-09days on market $1,600,000 Active 6 DOM
-
2026-06-08days on market $1,600,000 Active 5 DOM
-
2026-06-07remarks 677-char remark
-
2026-06-07statusdays on market $1,600,000 Active 4 DOM
-
2026-06-04days on market $1,600,000 Coming Soon 10 DOM
-
2026-06-02days on market $1,600,000 Coming Soon 9 DOM
-
2026-06-01days on market $1,600,000 Coming Soon 8 DOM
-
2026-05-31days on market $1,600,000 Coming Soon 7 DOM
-
2026-05-24historical $1,600,000
ⓘ Source: listings_history table (triggers on properties + properties_extension) + one-shot
backfill from property_details.listing_events for pre-trigger history.
Tax reassessment forecast NY · Partial reset (capped growth)
- Current annual tax
- $9,819 · $818/mo
- Projected year-2 tax
- $16,731 · $1,394/mo
- Expected delta
- +$6,912/yr (+$576/mo · 70.4%)
ⓘ Screening estimate from a state-policy table — verify with the county assessor before closing.
Climate risk First Street
- Flood 1/10 Low FEMA zone X (unshaded) · 0% chance over 30 yrs
- Wildfire 2/10 Low
- Heat 5/10 Major 7 d/yr ≥92°F today · 19 d/yr by 30 yrs out
- Wind 8/10 Severe 80% chance of damaging wind over 30 yrs
- Air quality 3/10 Moderate 2 unhealthy d/yr today · 4 by 30 yrs out
Nearby sold comps map
Loading sold comps map…
Walkable amenities ~0.75 mi
Loading nearby amenities…
Taxation est. · year 1
- Rental income
- $204,427
- − Mortgage interest
- −$78,366
- − Property taxes
- −$9,819
- − Insurance
- −$6,995
- − Repairs & maintenance
- −$16,354
- − Management
- −$16,354
- − HOA
- −$204
- − Depreciation
- −$40,698
- Taxable income
- $35,637
- Est. tax owed @ 24.0%
- −$8,553
- After-tax cash flow
- $47,889/yr
For passive investors: Depreciation is non-cash, so a rental often shows a tax loss while cash-flowing — sheltering income. Rental losses are passive: they offset passive income freely, and up to $25,000/yr can offset ordinary (W-2) income if you actively participate and your MAGI is under $100k (phasing out to $0 by $150k); unused losses carry forward. On sale, claimed depreciation is recaptured at up to 25%, and gains may owe capital-gains tax (a 1031 exchange can defer both). Figures are a year-1 estimate at your 24.0% rate — not tax advice; consult a CPA.
Schools (NCES district)
- District
- Mattituck-Cutchogue Union Free School District
- NCES district ID
- 3600021
- Math proficiency
- 69% ▼ -3.00%
- Reading proficiency
- 68% ▲ 4.00%
- Median HH income
- $84,164
- Composite
- 61.4/100
- National rank
- #765
- State rank
- #127 of 590 in NY
Livability — Laurel
- Score
- 60/100
- State rank
- #965
- US rank
- #18894
Category grades
Schools grade is shown separately in the Schools card above.
Census & demographics
- Census place
- Laurel, NY
- City population
- 775
- Population (ZIP)
- 4,749
Population outlook (Suffolk County) Hauer SSP2
- Today (2025)
- 1,505,262 people
- By 2030
- 1,498,318 · -0.5%
- By 2040
- 1,471,101 · -2.3%
- By 2050
- 1,424,848 · -5.3%
- By 2075
- 1,337,157 · -11.2%
- By 2100
- 1,217,720 · -19.1%
Race, ethnicity, and origin ACS 2023
- Neighborhood character
- Predominantly White (92%)
- Race & ethnicity
- White 92% Hispanic / Latino 7% Two or more races 2%
- Hispanic origin (detail)
- Mexican 2%
- Common ancestry
- Romanian 16% Subsaharan African 5% Scotch-Irish 3%
- Foreign-born
- 12% · Canada
- Languages at home
- 84% English-only · Russian/Polish/Slavic 6% Spanish 5% French/Haitian/Cajun 2%
Political lean MEDSL · Suffolk
- 2024 margin
- Lean R (+10.0) · D 45.0% · R 55.0%
- 2008→2024 swing
- -16.0pp toward R · 2008: 6.0pp · 2024: -10.0pp
- All cycles
- 2024: R+10.0 2020: R+0.0 2016: R+8.2 2012: D+2.9 2008: D+6.0
Not yet ingested
- Civics
- —
Market trends
- HPI YoY
- ▼ -94.04%
- Current HPI
- 453.8895
- Rent YoY
- —
- Metro
- —
- State GDP YoY
- ▲ 2.60%
- F500 in state
- 92
Industry mix (Fortune 500 HQ in NY)
| Industry | F500 HQs | Revenue |
|---|---|---|
| Financial Services | 10 | $950B |
|
||
| Consumer Goods | 9 | $162B |
|
||
| Insurance | 4 | $225B |
|
||
| Telecommunications | 2 | $144B |
|
||
| Pharmaceuticals | 2 | $112B |
|
||
| Media / Entertainment | 2 | $69B |
|
||
Price history
1 event — show timeline
- 2026-05-24 Coming Soon $1,600,000 OneKey® MLS as Distributed by MLS Grid
Property tax history
+2.4%/yrLatest (2025): $9,819 · +0.0% YoY. Source: county tax records.
Cash-flow waterfall
monthlySold comps — $/sqft
last 12 mo · ≤1 miLoading sold comps…