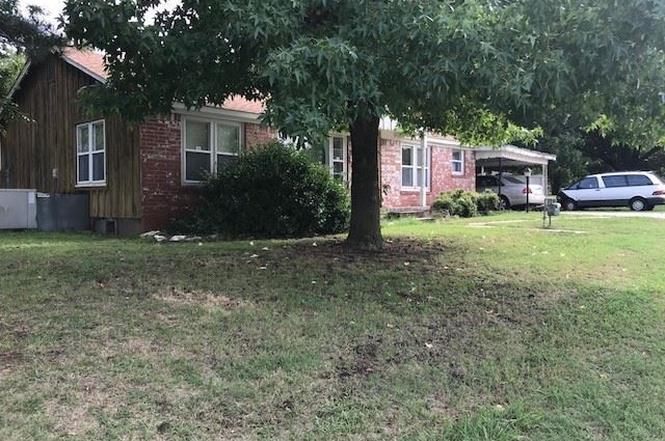
310 E Adler · Davis, OK
Flood risk No data
- FEMA flood zone
- —
- Chance of flooding over 30 yrs
- —
- Est. flood insurance / yr
- —
Fire risk No data
- Est. fire insurance / yr
- —
Heat risk No data
- Hot days now (above threshold)
- —
- Hot days in 30 yrs
- —
Wind risk No data
- Chance of severe wind over 30 yrs
- —
Air-quality risk No data
- Unhealthy air days now
- —
- Unhealthy air days in 30 yrs
- —
Risk factors via First Street. Map © Google.
Why this score? — see what drove the B- grade
The composite is a weighted blend of 9 inputs, each scored 0–100. Each bar is that input's sub-score; the figure is the points it added to the 100-point composite (weight × sub-score).
- Cash flow +22.0/30.0
- ARV discount +15.0/15.0
- Appreciation +10.0/10.0
- DSCR +7.0/10.0
- 1% rule +4.8/10.0
- Livability +3.0/5.0
- Rent growth +2.5/5.0
- Condition / age +2.5/5.0
- Schools +2.1/10.0
$114,000
🖨 Deal sheet 📄 Offer letter ✓ Due diligence
Listing remarks MLS
THIS HOME WAS REMODELED IN 2004. WALK-IN CLOSETS GALORE!!! NICE ROOMY KITCHEN WITH ISLAND. .. .BREAKFAST AREA WITH ROOM FOR CHINA HUTCH. NEWER PERGO FLOORING. FORMAL LIVING ROOM IS SOLID WOOD FLOORS. NEWER ROOF; CH/A; FIREPLACE W/ GAS LOGS IN DEN. FENCED IN BACK YARD WITH COVERED PATIO. HAS A 70 X 100 EXTRA LOT TO THE WEST OF THE HOME(THAT WAS PURCHASED LATER). .. .COULD BE SOLD OFF IF SOMEONE WANTED OR BUILD ANOTHER HOME. GOOD SHADE TREES. WALKING DISTANCE TO TOWN AND EATING ESTABLISHMENTS. ROOMY BATHROOMS. MOVE-IN READY!
Key facts
- Covered carport
- Cozy brick fireplace
- Walk-in closets
Tags
Property features AI
Exterior
- Parking: 1-car garage; Carport
- Security: Smoke detector(s); No safety shelter
- Utilities: Public water; Public sewer; Utilities listed as unknown
- Home design: Single-story; Faces east
- Construction: Brick construction; Asphalt/fiberglass roof
- Exterior features: Covered patio; Patio; Shed(s); Chain link fencing; No additional exterior features listed
Interior
- Kitchen: Oven; Range; Stove; Electric water heater
- Flooring: Carpet; Wood; Wood veneer
- Bathrooms: 2 full bathrooms
- Heating & cooling: Central heating (electric); Central air conditioning
- Interior features: Fireplace (1); Smoke detector(s); Other interior features
- Laundry & utility: Electric dryer hookup
Neighborhood map
What this means for you Summary
Snapshot
- This is a 3-bed/3.0-bath single-family listed at $114k.
Deal economics
- At list price, monthly cash flow is $182 ($2k/yr) — positive.
- The deal already cash-flows at list — no discount required.
- To meet the 1% rule (rent ≥ 1% of price), the offer needs to be $112k (2.0% below list).
- Recommended offer: $100k (12.0% below list) — sets the bar for market timing.
Location & tenants
- Location reads 59/100 on livability (#392 in OK) — a working-class tenant base; expect higher turnover. Strengths: cost of living A+, housing A+; Watch: schools F, crime F, amenities F.
- Davis (town): math 20% / reading 29% proficiency, ranked #112 of 270 in OK (top 42%) — low school quality limits family demand, transient renter base, plan for 1-2y turnover.
- Market conditions: 76 active listings in the ZIP; 20 units permitted in Murray County in 2024 (0 in 5+ unit buildings).
Forward outlook
- In year one you build about $12k of equity ($788 loan paydown + $11k appreciation (10.0% local appreciation)).
- Murray County population projected at +16% by 2050 — long-run rental-demand tailwind backs the buy-and-hold thesis.
- At projected returns (10.0% appreciation + 3.0% rent growth), your $32k cash investment doubles in ~3 years — after that, you're playing with house money.
- By year 3, paydown + projected appreciation supports a ~$31k cash-out refi (75% LTV) — recoverable capital for the next deal without selling this one.
Negotiation context
- It's been on market 248 days — a 12% lower offer ($100k) is reasonable based on typical stale-listing flexibility.
- 2 sale attempts since 8y ago; this cycle's ask has dropped $56k (33%) from the opening price — seller is motivated, your offer sets the floor, not the list.
- Current owner paid $55k; list at $114k implies a 107% gain — meaningful room to come down on a strong offer.
Questions for the listing agent
- It's been on market 248 days. Have you received any prior offers? Is the seller open to a 12% concession, seller financing, or rate buy-down credit?
- Built in 1971 — when were the roof, HVAC, electrical panel, plumbing, and water heater last replaced?
- Why hasn't it sold? Are there any deal-killer items the seller is aware of (foundation, flood, title, zoning, code violations)?
- Is there a deadline driving the sale (1031 exchange, divorce, estate, relocation)? That informs how much negotiation room exists.
- Schools are F-rated, which usually means shorter tenancies and higher turnover. Who's the typical renter profile here, and what's been the actual vacancy rate?
- Crime grade is F in this area — have there been break-ins, vandalism, or insurance claims at this property in the last 3 years? What carrier currently insures it and at what premium?
- What's the average days-on-market for RENTAL listings here right now (not sales)? A rising rental-DOM trend means longer vacancies and softer asking-rent achievability than the comps imply.
- What's the recent tenant-quality profile in this submarket — average credit score on applications, eviction rate, late-payment / NSF rate, and stable-employment percentage? A property-management company in the area should have these aggregated.
- How much new for-sale + rental construction is in the pipeline within 1–3 miles? Heavy new supply typically softens prices + rents 12–24 months out; constrained supply supports both.
Investment metrics
- 1% rule
- 0.98% ✗
- Cap rate
- 8.21%
- Cash-on-cash
- 6.83%
- DSCR
- 1.30
- GRM
- 8.5
CMA / ARV
- ARV (on-the-fly)
- $174,696
- Comps found
- 11
Show comp detail 11 sales within ~0.75 mi
| Address | Dist | Beds/Ba | Sqft | Sold | Price | $/sf | Match |
|---|---|---|---|---|---|---|---|
| 211 N 3rd St | 0.11mi | 3/2.0 | 1,428 (-5%) | 11mo | $187,500 | $131 | 73 |
| 404 S 2nd St | 0.46mi | 3/2.0 | 1,512 (+0%) | 1mo | $155,000 | $103 | 73 |
| 201 S 6th St | 0.32mi | 3/2.0 | 1,496 (-1%) | 12mo | $125,000 | $84 | 70 |
| 401 S 4th St Cor | 0.43mi | 3/2.5 | 1,385 (-8%) | 5mo | $145,000 | $105 | 60 |
| 400 S 4th | 0.44mi | 3/2.0 | 1,506 (0%) | 24mo | $176,500 | $117 | 56 |
| 208 E Bird | 0.73mi | 3/2.0 | 1,530 (+2%) | 6mo | $195,000 | $127 | 54 |
| 1101 E Hanna Ave | 0.63mi | 3/2.0 | 1,399 (-7%) | 1mo | $246,000 | $176 | 54 |
| 1205 E Ellis Ave | 0.70mi | 3/2.0 | 1,577 (+5%) | 4mo | $178,000 | $113 | 52 |
| 702 S 5th | 0.68mi | 4/2.0 (+1) | 1,428 (-5%) | 4mo | $95,000 | $67 | 48 |
| 402 S 6th | 0.47mi | 2/2.0 (-1) | 1,618 (+7%) | 23mo | $227,000 | $140 | 38 |
| 1201 E Atlanta Ave | 0.72mi | 3/1.0 | 1,298 (-14%) | 4mo | $150,000 | $116 | 32 |
Match score weights: distance 35% · size 25% · config 20% · recency 20%. Top-matched comps best support the ARV.
Projected returns pro-forma
10.0% appreciation · 3.0% rent growth · sell at horizon
- IRR
- 29.2%
- Equity multiple
- 3.31×
- Total profit
- $73,629
- Equity at exit
- $102,700
- IRR
- 25.4%
- Equity multiple
- 7.51×
- Total profit
- $207,649
- Equity at exit
- $221,477
Cash invested: $31,920 (down + closing). Projections, not guarantees.
Landlord ↔ Tenant lean methodology
- Overall (STATE)
- 83 Strongly Landlord-Friendly
- State Oklahoma
- 83 Strongly Landlord-Friendly · R+20
- County
- — inherits STATE
- City
- — inherits STATE
ZIP-level market 73030
- Home prices YoY
- 16.3%
- Active inventory
- 76
- Price-to-rent
- 8.5×
Monthly cashflow live
- Estimated rent
- $1,118 medium interval (Pro) →
- Mortgage (P&I)
- −$598
- Tax from tax record
- −$56 /mo · $670/yr
- Insurance
- −$48
- HOA
- −$0
- Vacancy / Maint / Mgmt
- −$235
- Net cashflow
- $182
Break-even live
UW: 25.0% down · 7.5% · 30yr · 1.5% tax · 5.0% vac · 8.0% maint · 8.0% mgmt
Financing live
Cash to close
- Down payment
- $28,500
- Closing costs
- $3,420
- Reserves months
- —
- Total cash needed
- —
Loan-product check · same deal, 3 products live
Conventional
25% down · 7.5% · 30yr
- Down + closing
- —
- Monthly P&I
- —
- Monthly cashflow
- —
- DSCR
- —
- Eligible?
- —
Personal DTI + credit; lowest rate.
DSCR
20% down · 8.5% · 30yr
- Down + closing
- —
- Monthly P&I
- —
- Monthly cashflow
- —
- DSCR
- —
- Eligible?
- —
No personal income docs; deal must DSCR.
Hard money
10% down · 12.0% · 12mo
- Down + closing
- —
- Monthly P&I
- —
- Monthly cashflow
- —
- DSCR
- —
- Eligible?
- —
Short-term bridge; refi at stabilization.
Listing history 20 events
-
2026-06-15days on market $114,000 Active 248 DOM
-
2026-06-14days on market $114,000 Active 246 DOM
-
2026-06-12days on market $114,000 Active 245 DOM
-
2026-06-09days on market $114,000 Active 242 DOM
-
2026-06-08days on market $114,000 Active 241 DOM
-
2026-06-07days on market $114,000 Active 240 DOM
-
2026-06-02days on market $114,000 Active 235 DOM
-
2026-06-01days on market $114,000 Active 234 DOM
-
2026-05-31days on market $114,000 Active 233 DOM
-
2026-05-30days on market $114,000 Active 232 DOM
-
2026-04-02price $114,000
-
2026-01-15price $125,000
-
2025-12-03price $150,000
-
2025-11-05price $160,000
-
2025-11-01price $165,000
-
2025-10-10$170,000 Active
-
2018-12-17soldstatus $55,000 528-char remark
Show marketing remark (528 chars)
THIS HOME WAS REMODELED IN 2004. WALK-IN CLOSETS GALORE!!! NICE ROOMY KITCHEN WITH ISLAND. .. .BREAKFAST AREA WITH ROOM FOR CHINA HUTCH. NEWER PERGO FLOORING. FORMAL LIVING ROOM IS SOLID WOOD FLOORS. NEWER ROOF; CH/A; FIREPLACE W/ GAS LOGS IN DEN. FENCED IN BACK YARD WITH COVERED PATIO. HAS A 70 X 100 EXTRA LOT TO THE WEST OF THE HOME(THAT WAS PURCHASED LATER). .. .COULD BE SOLD OFF IF SOMEONE WANTED OR BUILD ANOTHER HOME. GOOD SHADE TREES. WALKING DISTANCE TO TOWN AND EATING ESTABLISHMENTS. ROOMY BATHROOMS. MOVE-IN READY!
-
2018-12-17soldstatus $55,000
Show marketing remark (528 chars)
THIS HOME WAS REMODELED IN 2004. WALK-IN CLOSETS GALORE!!! NICE ROOMY KITCHEN WITH ISLAND. .. .BREAKFAST AREA WITH ROOM FOR CHINA HUTCH. NEWER PERGO FLOORING. FORMAL LIVING ROOM IS SOLID WOOD FLOORS. NEWER ROOF; CH/A; FIREPLACE W/ GAS LOGS IN DEN. FENCED IN BACK YARD WITH COVERED PATIO. HAS A 70 X 100 EXTRA LOT TO THE WEST OF THE HOME(THAT WAS PURCHASED LATER). .. .COULD BE SOLD OFF IF SOMEONE WANTED OR BUILD ANOTHER HOME. GOOD SHADE TREES. WALKING DISTANCE TO TOWN AND EATING ESTABLISHMENTS. ROOMY BATHROOMS. MOVE-IN READY!
-
2018-09-05$59,900 528-char remark
Show marketing remark (528 chars)
THIS HOME WAS REMODELED IN 2004. WALK-IN CLOSETS GALORE!!! NICE ROOMY KITCHEN WITH ISLAND. .. .BREAKFAST AREA WITH ROOM FOR CHINA HUTCH. NEWER PERGO FLOORING. FORMAL LIVING ROOM IS SOLID WOOD FLOORS. NEWER ROOF; CH/A; FIREPLACE W/ GAS LOGS IN DEN. FENCED IN BACK YARD WITH COVERED PATIO. HAS A 70 X 100 EXTRA LOT TO THE WEST OF THE HOME(THAT WAS PURCHASED LATER). .. .COULD BE SOLD OFF IF SOMEONE WANTED OR BUILD ANOTHER HOME. GOOD SHADE TREES. WALKING DISTANCE TO TOWN AND EATING ESTABLISHMENTS. ROOMY BATHROOMS. MOVE-IN READY!
-
2004-02-24soldstatus $76,000
ⓘ Source: listings_history table (triggers on properties + properties_extension) + one-shot
backfill from property_details.listing_events for pre-trigger history.
Tax reassessment forecast OK · Resets to sale price
- Current annual tax
- $670 · $56/mo
- Projected year-2 tax
- $1,026 · $86/mo
- Expected delta
- +$356/yr (+$30/mo · 53.1%)
ⓘ Screening estimate from a state-policy table — verify with the county assessor before closing.
Nearby sold comps map
Loading sold comps map…
Walkable amenities ~0.75 mi
Loading nearby amenities…
Taxation est. · year 1
- Rental income
- $13,412
- − Mortgage interest
- −$6,386
- − Property taxes
- −$670
- − Insurance
- −$570
- − Repairs & maintenance
- −$1,073
- − Management
- −$1,073
- − Depreciation
- −$3,316
- Taxable income
- $324
- Est. tax owed @ 24.0%
- −$78
- After-tax cash flow
- $2,104/yr
For passive investors: Depreciation is non-cash, so a rental often shows a tax loss while cash-flowing — sheltering income. Rental losses are passive: they offset passive income freely, and up to $25,000/yr can offset ordinary (W-2) income if you actively participate and your MAGI is under $100k (phasing out to $0 by $150k); unused losses carry forward. On sale, claimed depreciation is recaptured at up to 25%, and gains may owe capital-gains tax (a 1031 exchange can defer both). Figures are a year-1 estimate at your 24.0% rate — not tax advice; consult a CPA.
Schools (NCES district)
- District
- Davis
- NCES district ID
- 4009510
- Math proficiency
- 20% ▼ -3.00%
- Reading proficiency
- 29% ▬ 0.00%
- Median HH income
- $44,908
- Composite
- 21.12/100
- National rank
- #8436
- State rank
- #112 of 270 in OK
Livability — Davis
- Score
- 59/100
- State rank
- #392
- US rank
- #20182
Category grades
Schools grade is shown separately in the Schools card above.
Census & demographics
- Census place
- Davis, OK
- Population (ZIP)
- 4,359
Population outlook (Murray County) Hauer SSP2
- Today (2025)
- 14,976 people
- By 2030
- 15,487 · +3.4%
- By 2040
- 16,455 · +9.9%
- By 2050
- 17,308 · +15.6%
- By 2075
- 19,421 · +29.7%
- By 2100
- 20,335 · +35.8%
Race, ethnicity, and origin ACS 2023
- Neighborhood character
- Predominantly White (74%)
- Race & ethnicity
- White 74% Native American 12% Two or more races 9% Hispanic / Latino 4% Black 2%
- Common ancestry
- Iranian 1% Italian 1% Romanian 1%
- Foreign-born
- 2% · Canada
- Languages at home
- 95% English-only · Spanish 3%
Political lean MEDSL · Murray
- 2024 margin
- Solid R (+61.3) · D 18.4% · R 79.7% · Other 2.0%
- 2008→2024 swing
- -21.0pp toward R · 2008: -40.4pp · 2024: -61.3pp
- All cycles
- 2024: R+61.3 2020: R+58.6 2016: R+55.9 2012: R+40.1 2008: R+40.4
Not yet ingested
- Civics
- —
Market trends
- HPI YoY
- ▲ 55.17%
- Current HPI
- 393.0172
- Rent YoY
- —
- Metro
- —
- State GDP YoY
- ▲ 1.55%
- F500 in state
- 6
Industry mix (Fortune 500 HQ in OK)
| Industry | F500 HQs | Revenue |
|---|---|---|
| Energy | 3 | $48B |
|
||
Price history
+50.0% since first listed10 events — show timeline
- 2026-04-02 Price Changed $114,000 MLS Technology, Inc.
- 2026-01-15 Price Changed $125,000 MLS Technology, Inc.
- 2025-12-03 Price Changed $150,000 MLS Technology, Inc.
- 2025-11-05 Price Changed $160,000 MLS Technology, Inc.
- 2025-11-01 Price Changed $165,000 MLS Technology, Inc.
- 2025-10-10 Listed $170,000 MLS Technology, Inc.
- 2018-12-17 Sold (Public Records) $55,000 Public Records
- 2018-12-17 Sold (MLS) $55,000 MLS Technology, Inc.
- 2018-09-05 Listed $59,900 MLS Technology, Inc.
- 2004-02-24 Sold (Public Records) $76,000 Public Records
Property tax history
+0.7%/yrLatest (2025): $670 · +3.7% YoY. Source: county tax records.
Cash-flow waterfall
monthlySold comps — $/sqft
last 12 mo · ≤1 miLoading sold comps…