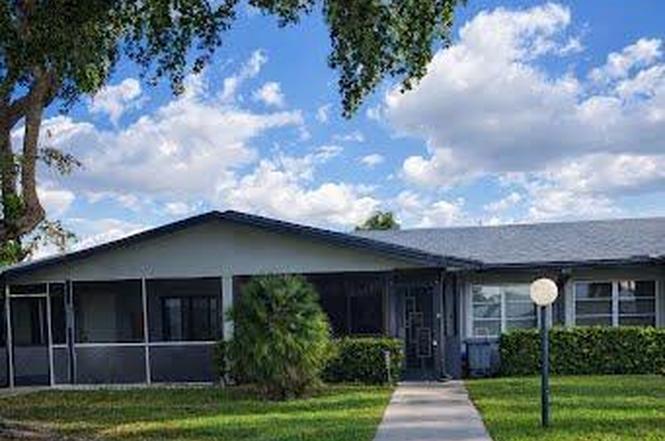
5755 Doris Ct · Delray Beach, FL
Flood risk 1/10 · Minimal
- FEMA flood zone
- X (unshaded)
- Chance of flooding over 30 yrs
- 0.0%
- Est. flood insurance / yr
- $507 – $1,088
Fire risk 1/10 · Minimal
- Est. fire insurance / yr
- $947 – $1,759
Heat risk 9/10 · Severe
- Hot days now (above 106°F)
- 7 days/yr
- Hot days in 30 yrs
- 27 days/yr
Wind risk 10/10 · Severe
- Chance of severe wind over 30 yrs
- 99.0%
Air-quality risk 2/10 · Minimal
- Unhealthy air days now
- 1 days/yr
- Unhealthy air days in 30 yrs
- 2 days/yr
Risk factors via First Street. Map © Google.
Why this score? — see what drove the C+ grade
The composite is a weighted blend of 9 inputs, each scored 0–100. Each bar is that input's sub-score; the figure is the points it added to the 100-point composite (weight × sub-score).
- Cash flow +20.4/30.0
- ARV discount +14.3/15.0
- 1% rule +6.6/10.0
- DSCR +6.5/10.0
- Schools +4.3/10.0
- Livability +3.9/5.0
- Rent growth +3.6/5.0
- Condition / age +2.5/5.0
- Appreciation +0.0/10.0
$230,000
🖨 Deal sheet 📄 Offer letter ✓ Due diligence
Listing remarks MLS
55+ ACTIVE COMMUNITY-LOW MAINTENANCE-LOTS OF TILES-SMALL PETS OK TENNIS-EXCELLENT LOCATION-ENCLOSED FRONT PATIO
Key facts
- 3,223 sq ft lot
- Community pool
- Built 1981
Property features AI
Finance
- Other: Senior community
- HOA & community: HOA with monthly fee; Community clubhouse; Fitness center; Game room; Jogging path; Pool; Sauna; Shuffleboard court; Spa/Hot Tub; Tennis courts; Community room; Library; Pets allowed (restrictions and limits may apply)
Exterior
- Utilities: Three-phase electric; Public sewer; Cable available; Sewer available
- Home design: Villa; Single-story (1 story); Multi/split levels; Resale property; Faces south
- Construction: CBS construction; Other roof
- Exterior features: Covered patio; Open patio; Screened patio; Porch
Interior
- Kitchen: Dishwasher; Microwave; Refrigerator
- Bedrooms: 2 bedrooms on the main level
- Bathrooms: 2 full bathrooms
- Heating & cooling: Central heating; Central air; Ceiling fans
- Interior features: Walk-in closets; Custom mirrors; Partially furnished
Neighborhood map
What this means for you Summary
Snapshot
- This is a 2-bed/2.0-bath single-family listed at $230k.
Deal economics
- At list price, monthly cash flow is $299 ($4k/yr) — positive.
- The deal already cash-flows at list — no discount required.
- Meets the 1% rule at list price ($3k rent vs $230k).
- Recommended offer: $202k (12.0% below list) — sets the bar for market timing.
- Cap rate 7.9% vs local median 4.3% in Delray Beach — top-decile yield for the area; either an underpriced asset or a hidden risk that comps aren't pricing in. Stress-test before assuming the spread holds.
Location & tenants
- Location reads 77/100 on livability (#202 in FL, #3,160 nationally) — a middle-class / working-renter tenant base. Strengths: housing A+, health & safety A+, commute A-; Watch: cost of living C-, crime D-, amenities F.
- Palm Beach (suburban): math 46% / reading 53% proficiency, ranked #34 of 73 in FL (top 47%) — families likely to look elsewhere, expect single-tenant / working-renter base with shorter leases.
- Zoned schools: Banyan Creek Elementary School (math 62% / reading 64%, grade B, #582 of 2,144 statewide, top 28%, 844 students, 51% FRL); Atlantic High School (math 28% / reading 52%, grade F, #296 of 667 statewide, top 45%, 1,889 students, 59% FRL) — zoned schools at 55% FRL track the district average.
- Market conditions: Rents rising fast (+4.3%/yr); 546 active listings in the ZIP; 40 comparable units currently listed for rent nearby; rentals at typical pace (median 24d on market — plan ~3-4 weeks tenant-placement turnaround); 3,974 units permitted in Palm Beach County in 2024 (1,012 in 5+ unit buildings).
- At $2,676/mo this rent would consume 52% of the median local household income ($62k/yr) (locally 991% of renters already pay >50% of income on rent) — very limited rent-growth headroom before tenants either downsize or default.
Forward outlook
- Local home prices are declining (-3.0%/yr); year-one equity from $2k of loan paydown is wiped out by about $7k of value loss. Plan a longer hold.
- Palm Beach County population projected at +30% by 2050 — long-run rental-demand tailwind backs the buy-and-hold thesis.
Negotiation context
- It's been on market 217 days — a 12% lower offer ($202k) is reasonable based on typical stale-listing flexibility.
- 5 sale attempts since 27y ago; this cycle's ask has dropped $20k (8%) from the opening price — seller is motivated, your offer sets the floor, not the list.
- Current owner paid $63k; list at $230k implies a 265% gain — meaningful room to come down on a strong offer.
Risks & watch-outs
- Climate carrying-cost: severe wind risk, 99% chance of damaging wind over 30y; extreme-heat days projected 7→27/yr by 2055 (HVAC capex compounding) — expect insurance premiums to compound above CPI over the hold.
Questions for the listing agent
- It's been on market 217 days. Have you received any prior offers? Is the seller open to a 12% concession, seller financing, or rate buy-down credit?
- What does the HOA fee cover, when was the last increase, and are there any pending special assessments or reserve-fund shortfalls?
- Why hasn't it sold? Are there any deal-killer items the seller is aware of (foundation, flood, title, zoning, code violations)?
- Is there a deadline driving the sale (1031 exchange, divorce, estate, relocation)? That informs how much negotiation room exists.
- Schools are B-rated — typically a magnet for longer-tenancy family renters. What's the average tenant stay here, and is there a school-zone premium baked into asking?
- Crime grade is D in this area — have there been break-ins, vandalism, or insurance claims at this property in the last 3 years? What carrier currently insures it and at what premium?
- What's the average days-on-market for RENTAL listings here right now (not sales)? A rising rental-DOM trend means longer vacancies and softer asking-rent achievability than the comps imply.
- What's the recent tenant-quality profile in this submarket — average credit score on applications, eviction rate, late-payment / NSF rate, and stable-employment percentage? A property-management company in the area should have these aggregated.
- How much new for-sale + rental construction is in the pipeline within 1–3 miles? Heavy new supply typically softens prices + rents 12–24 months out; constrained supply supports both.
Investment metrics
- 1% rule
- 1.16% ✓
- Cap rate
- 7.85%
- Cash-on-cash
- 5.56%
- DSCR
- 1.25
- GRM
- 7.2
CMA / ARV
- ARV (on-the-fly)
- $270,912
- Comps found
- 2
Show comp detail 2 sales within ~0.75 mi
| Address | Dist | Beds/Ba | Sqft | Sold | Price | $/sf | Match |
|---|---|---|---|---|---|---|---|
| 14615 Candy Way | 0.07mi | 2/2.0 | 1,200 (-10%) | 14mo | $245,000 | $204 | 69 |
| 14589 Candy Way | 0.09mi | 2/2.0 | 1,200 (-10%) | 20mo | $230,000 | $192 | 63 |
Match score weights: distance 35% · size 25% · config 20% · recency 20%. Top-matched comps best support the ARV.
Projected returns pro-forma
-3.0% appreciation · 4.28% rent growth · sell at horizon
- IRR
- -6.0%
- Equity multiple
- 0.77×
- Total profit
- $-14,586
- Equity at exit
- $34,294
- IRR
- 5.4%
- Equity multiple
- 1.42×
- Total profit
- $27,211
- Equity at exit
- $19,886
Cash invested: $64,400 (down + closing). Projections, not guarantees.
Landlord ↔ Tenant lean methodology
- Overall (STATE)
- 87 Strongly Landlord-Friendly
- State Florida
- 87 Strongly Landlord-Friendly · R+3
- County
- — inherits STATE
- City
- — inherits STATE
ZIP-level market 33484
- Rents YoY
- 4.3%
- Active inventory
- 546
- Price-to-rent
- 7.2×
Monthly cashflow live
- Estimated rent
- $2,676 high interval (Pro) →
- Mortgage (P&I)
- −$1,206
- Tax from tax record
- −$285 /mo · $3,425/yr
- Insurance
- −$96
- HOA
- −$228
- Vacancy / Maint / Mgmt
- −$562
- Net cashflow
- $299
Break-even live
UW: 25.0% down · 7.5% · 30yr · 1.5% tax · 5.0% vac · 8.0% maint · 8.0% mgmt
Financing live
Cash to close
- Down payment
- $57,500
- Closing costs
- $6,900
- Reserves months
- —
- Total cash needed
- —
Loan-product check · same deal, 3 products live
Conventional
25% down · 7.5% · 30yr
- Down + closing
- —
- Monthly P&I
- —
- Monthly cashflow
- —
- DSCR
- —
- Eligible?
- —
Personal DTI + credit; lowest rate.
DSCR
20% down · 8.5% · 30yr
- Down + closing
- —
- Monthly P&I
- —
- Monthly cashflow
- —
- DSCR
- —
- Eligible?
- —
No personal income docs; deal must DSCR.
Hard money
10% down · 12.0% · 12mo
- Down + closing
- —
- Monthly P&I
- —
- Monthly cashflow
- —
- DSCR
- —
- Eligible?
- —
Short-term bridge; refi at stabilization.
Rent comps 40 comps
| Address | Beds | Baths | Sqft | Rent | $/sqft | DOM | Units | Dist |
|---|---|---|---|---|---|---|---|---|
| 14696 Lucy Dr #14696 Delray Beach, FL | 2.0 | 2.0 | 1200 | $2,200 | $1.83 | 7d | 1 | 0.06mi |
| 14606 Lucy Dr Delray Beach, FL | 2.0 | 2.0 | 1200 | $1,850 | $1.54 | 24d | 1 | 0.06mi |
| 5910 Morningstar Cir #202 Delray Beach, FL | 2.0 | 2.0 | 1120 | $2,200 | $1.96 | 24d | 1 | 0.21mi |
| 5884 Morningstar Cir #306 Delray Beach, FL | 2.0 | 2.0 | 1113 | $2,200 | $1.98 | 24d | 1 | 0.22mi |
| 5600 Atlantic Ave Delray Beach, FL | 1.0–3.0 | 1.0–3.0 | 1147 | $3,030 | $2.64 | 1d | 29 | 0.23mi |
| 14464 Campanelli Dr Delray Beach, FL | 2.0 | 2.0 | 1296 | $2,950 | $2.28 | 24d | 1 | 0.24mi |
| 14425 Amapola Way Delray Beach, FL | 2.0 | 2.0 | 1406 | $2,800 | $1.99 | 5d | 1 | 0.27mi |
| 14716 Canalview Dr Unit D Delray Beach, FL | 2.0 | 2.0 | 1186 | $3,500 | $2.95 | 12d | 1 | 0.32mi |
| 6096 Kings Gate Cir Delray Beach, FL | 2.0 | 2.0 | 1311 | $2,500 | $1.91 | 24d | 1 | 0.38mi |
| 14484 Canalview Dr Unit C Delray Beach, FL | 1.0 | 2.0 | 1068 | $1,700 | $1.59 | 24d | 1 | 0.43mi |
| 6234 Pointe Regal Cir Delray Beach, FL | 2.0 | 2.0 | 1217 | $3,899 | $3.20 | 24d | 1 | 0.50mi |
| 14608 Country Side Ln Delray Beach, FL | 2.0 | 2.0 | 1303 | $2,950 | $2.26 | 24d | 1 | 0.50mi |
| 15469 Lakes of Delray Blvd #102 Delray Beach, FL | 2.0 | 2.0 | 976 | $3,000 | $3.07 | 24d | 1 | 0.50mi |
| 15449 Lakes of Delray Blvd #207 Delray Beach, FL | 2.0 | 2.0 | 976 | $2,950 | $3.02 | 24d | 1 | 0.51mi |
| 5550 Nepsa Way Delray Beach, FL | 1.0–3.0 | 1.0–2.0 | 1035 | $2,776 | $2.68 | 1d | 12 | 0.55mi |
| 6372 Sleepy Willow Way Delray Beach, FL | 2.0 | 2.0 | 1344 | $3,975 | $2.96 | 14d | 1 | 0.56mi |
| 6372 Sleepy Willow Way Delray Beach, FL | 2.0 | 2.0 | 1344 | $3,975 | $2.96 | 24d | 1 | 0.56mi |
| 15072 Ashland Pl #132 Delray Beach, FL | 2.0 | 2.0 | 1100 | $2,100 | $1.91 | 19d | 1 | 0.57mi |
| 14050 Pacific Point Pl Delray Beach, FL | 1.0–3.0 | 1.0–2.0 | 1033 | $2,758 | $2.67 | 2d | 22 | 0.59mi |
| 6396 Country Wood Way Delray Beach, FL | 2.0 | 2.0 | 1364 | $3,000 | $2.20 | 24d | 1 | 0.59mi |
| 15364 Lakes of Delray Blvd #45 Delray Beach, FL | 2.0 | 2.0 | 1160 | $2,000 | $1.72 | 13d | 1 | 0.62mi |
| 6108 Petunia Rd Delray Beach, FL | 2.0 | 2.0 | 1532 | $4,500 | $2.94 | 24d | 1 | 0.64mi |
| 5349 Lakefront Blvd Unit B Delray Beach, FL | 1.0 | 2.0 | 1068 | $1,800 | $1.69 | 24d | 1 | 0.64mi |
| 15355 Lakes of Delray Blvd #309 Delray Beach, FL | 2.0 | 2.0 | 1362 | $2,800 | $2.06 | 18d | 1 | 0.65mi |
| 6557 Country Wood Way Delray Beach, FL | 3.0 | 2.0 | 1346 | $4,700 | $3.49 | 24d | 1 | 0.65mi |
| 15108 Ashland Dr #215 Delray Beach, FL | 2.0 | 2.0 | 900 | $2,000 | $2.22 | 24d | 1 | 0.66mi |
| 15109 Ashland Dr #323 Delray Beach, FL | 2.0 | 2.0 | 998 | $3,500 | $3.51 | 24d | 1 | 0.66mi |
| 6550 Country Wood Way Delray Beach, FL | 3.0 | 2.0 | 1408 | $4,000 | $2.84 | 24d | 1 | 0.67mi |
| 6550 Country Wood Way Delray Beach, FL | 3.0 | 2.0 | 1408 | $4,000 | $2.84 | 4d | 1 | 0.67mi |
| 14111 Royal Vista Dr #404 Delray Beach, FL | 2.0 | 2.0 | 1392 | $3,200 | $2.30 | 24d | 1 | 0.67mi |
| 6549 Sleepy Willow Way #6549 Delray Beach, FL | 3.0 | 2.0 | 1729 | $6,000 | $3.47 | 24d | 1 | 0.67mi |
| 14139 Nesting Way Unit A Delray Beach, FL | 2.0 | 2.0 | 1255 | $2,200 | $1.75 | 12d | 1 | 0.69mi |
| 5385 Lakefront Blvd Unit A Delray Beach, FL | 2.0 | 2.0 | 1186 | $2,200 | $1.85 | 24d | 1 | 0.69mi |
| 14629 Canalview Dr Unit C Delray Beach, FL | 1.0 | 2.0 | 1068 | $1,600 | $1.50 | 24d | 1 | 0.69mi |
| 14676 Canalview Dr Unit C Delray Beach, FL | 1.0 | 2.0 | 1068 | $1,775 | $1.66 | 24d | 1 | 0.69mi |
| 167 Gramercy Square Dr Delray Beach, FL | 3.0 | 2.5 | 1758 | $3,200 | $1.82 | 5d | 1 | 0.69mi |
| 5169 Lakefront Blvd Unit D Delray Beach, FL | 2.0 | 2.0 | 1186 | $2,300 | $1.94 | 24d | 1 | 0.70mi |
| 15235 Lakes of Delray Blvd #299 Delray Beach, FL | 2.0 | 2.0 | 900 | $1,975 | $2.19 | 18d | 1 | 0.71mi |
| 5126 Lakefront Blvd Unit D Delray Beach, FL | 2.0 | 2.0 | 1186 | $2,500 | $2.11 | 20d | 1 | 0.72mi |
| 13916 Via Flora Unit F Delray Beach, FL | 2.0 | 2.0 | 989 | $3,000 | $3.03 | 24d | 1 | 0.77mi |
HOA detail
- Monthly dues
- $228 · $2,736/yr
Listing history 26 events
-
2026-06-18days on market $230,000 Active 217 DOM
-
2026-06-17days on market $230,000 Active 216 DOM
-
2026-06-16days on market $230,000 Active 215 DOM
-
2026-06-15days on market $230,000 Active 214 DOM
-
2026-06-13days on market $230,000 Active 212 DOM
-
2026-06-09days on market $230,000 Active 208 DOM
-
2026-06-07days on market $230,000 Active 206 DOM
-
2026-06-04days on market $230,000 Active 203 DOM
-
2026-06-03days on market $230,000 Active 202 DOM
-
2026-06-01days on market $230,000 Active 200 DOM
-
2026-05-31days on market $230,000 Active 199 DOM
-
2026-05-01price $230,000
-
2026-03-24price $240,000
-
2025-11-13status Active
-
2025-11-07historical
-
2025-11-07$250,000 Active
-
2025-10-17historical $250,000
-
2024-01-17historical $1,700
-
2023-12-23$1,700
-
2013-09-22historical 111-char remark
Show marketing remark (111 chars)
55+ ACTIVE COMMUNITY-LOW MAINTENANCE-LOTS OF TILES-SMALL PETS OK TENNIS-EXCELLENT LOCATION-ENCLOSED FRONT PATIO
-
2000-10-17soldstatus $63,000
-
2000-10-04soldstatus $63,000 177-char remark
Show marketing remark (177 chars)
GORGEOUS TILED VILLA WITH MANY EXTRAS..HIGH HATS, SKYLIGHT...LARGE WHITE TILES THROUGHOUT EVEN IN CLOSETS..MIRRORED WALL IN L/R...FANS..FRONT AND REAR PATIO...SHORT WALK TO POOL
-
2000-08-04historical 177-char remark
Show marketing remark (177 chars)
GORGEOUS TILED VILLA WITH MANY EXTRAS..HIGH HATS, SKYLIGHT...LARGE WHITE TILES THROUGHOUT EVEN IN CLOSETS..MIRRORED WALL IN L/R...FANS..FRONT AND REAR PATIO...SHORT WALK TO POOL
-
2000-03-10$64,900 177-char remark
Show marketing remark (177 chars)
GORGEOUS TILED VILLA WITH MANY EXTRAS..HIGH HATS, SKYLIGHT...LARGE WHITE TILES THROUGHOUT EVEN IN CLOSETS..MIRRORED WALL IN L/R...FANS..FRONT AND REAR PATIO...SHORT WALK TO POOL
-
1999-08-16$59,900 111-char remark
Show marketing remark (111 chars)
55+ ACTIVE COMMUNITY-LOW MAINTENANCE-LOTS OF TILES-SMALL PETS OK TENNIS-EXCELLENT LOCATION-ENCLOSED FRONT PATIO
-
1982-07-01soldstatus $53,000
ⓘ Source: listings_history table (triggers on properties + properties_extension) + one-shot
backfill from property_details.listing_events for pre-trigger history.
Tax reassessment forecast FL · Resets to sale price
- Current annual tax
- $3,425 · $285/mo
- Projected year-2 tax
- $3,425 · $285/mo
- Expected delta
- $0/yr ($0/mo · 0.0%)
ⓘ Screening estimate from a state-policy table — verify with the county assessor before closing.
Climate risk First Street
- Flood 1/10 Low FEMA zone X (unshaded) · 0% chance over 30 yrs
- Wildfire 1/10 Low
- Heat 9/10 Extreme 7 d/yr ≥106°F today · 27 d/yr by 30 yrs out
- Wind 10/10 Extreme 99% chance of damaging wind over 30 yrs
- Air quality 2/10 Low 1 unhealthy d/yr today · 2 by 30 yrs out
Nearby sold comps map
Loading sold comps map…
Walkable amenities ~0.75 mi
Loading nearby amenities…
Taxation est. · year 1
- Rental income
- $32,110
- − Mortgage interest
- −$12,884
- − Property taxes
- −$3,425
- − Insurance
- −$1,150
- − Repairs & maintenance
- −$2,569
- − Management
- −$2,569
- − HOA
- −$2,736
- − Depreciation
- −$6,691
- Taxable income
- $87
- Est. tax owed @ 24.0%
- −$21
- After-tax cash flow
- $3,562/yr
For passive investors: Depreciation is non-cash, so a rental often shows a tax loss while cash-flowing — sheltering income. Rental losses are passive: they offset passive income freely, and up to $25,000/yr can offset ordinary (W-2) income if you actively participate and your MAGI is under $100k (phasing out to $0 by $150k); unused losses carry forward. On sale, claimed depreciation is recaptured at up to 25%, and gains may owe capital-gains tax (a 1031 exchange can defer both). Figures are a year-1 estimate at your 24.0% rate — not tax advice; consult a CPA.
Schools (NCES district)
- District
- Palm Beach
- NCES district ID
- 1201500
- Math proficiency
- 46% ▼ -16.00%
- Reading proficiency
- 53% ▼ -4.00%
- Median HH income
- $53,943
- Composite
- 42.72/100
- National rank
- #3160
- State rank
- #34 of 73 in FL
Livability — Delray Beach
- Score
- 77/100
- State rank
- #202
- US rank
- #3160
Category grades
Schools grade is shown separately in the Schools card above.
Census & demographics
- County
- Palm Beach County · 1,438,312 people
- City population
- 123,167
- Metro
- Miami-Fort Lauderdale-Pompano Beach, FL
- Population (ZIP)
- 26,208
- Household income
- $62,151
- Rent vs Own
- Severe rent burden
- 991.0
Population outlook (Palm Beach County) Hauer SSP2
- Today (2025)
- 1,637,487 people
- By 2030
- 1,743,255 · +6.5%
- By 2040
- 1,948,712 · +19.0%
- By 2050
- 2,132,979 · +30.3%
- By 2075
- 2,530,027 · +54.5%
- By 2100
- 2,706,979 · +65.3%
Race, ethnicity, and origin ACS 2023
- Neighborhood character
- Predominantly White (74%)
- Race & ethnicity
- White 74% Hispanic / Latino 14% Two or more races 10% Black 5% Asian 2%
- Hispanic origin (detail)
- Puerto Rican 2% Cuban 2%
- Common ancestry
- Scotch-Irish 7% Romanian 6% Italian 2%
- Foreign-born
- 23% · Canada, Jamaica, China
- Languages at home
- 76% English-only · Spanish 13% Russian/Polish/Slavic 3% French/Haitian/Cajun 3%
Political lean MEDSL · Palm Beach
- 2024 margin
- Toss-up / Even · D 50.0% · R 49.2%
- 2008→2024 swing
- -22.1pp toward R · 2008: 22.9pp · 2024: 0.8pp
- All cycles
- 2024: D+0.8 2020: D+12.8 2016: D+15.3 2012: D+17.0 2008: D+22.9
Not yet ingested
- Civics
- —
Market trends
- HPI YoY
- ▼ -232.73%
- Current HPI
- 254.5016
- Rent YoY
- ▲ 4.28%
- Metro
- Miami-Fort Lauderdale-Pompano Beach, FL
- State GDP YoY
- ▲ 3.28%
- F500 in state
- 36
Industry mix (Fortune 500 HQ in FL)
| Industry | F500 HQs | Revenue |
|---|---|---|
| Industrial Technology | 2 | $29B |
|
||
| Insurance | 2 | $17B |
|
||
| Retail | 1 | $60B |
|
||
| Technology Distribution | 1 | $58B |
|
||
| Homebuilding | 1 | $35B |
|
||
| Technology Manufacturing | 1 | $35B |
|
||
Price history
+334.0% since first listed15 events — show timeline
- 2026-05-01 Price Changed $230,000 Beaches MLS
- 2026-03-24 Price Changed $240,000 Beaches MLS
- 2025-11-13 Relisted — Beaches MLS
- 2025-11-07 Listing Removed — Beaches MLS
- 2025-11-07 Listed $250,000 Beaches MLS
- 2025-10-17 Coming Soon $250,000 Beaches MLS
- 2024-01-17 Rental Removed $1,700 GFLMLS
- 2023-12-23 Listed for Rent $1,700 GFLMLS
- 2013-09-22 Listing Removed — Beaches MLS
- 2000-10-17 Sold (Public Records) $63,000 Public Records
- 2000-10-04 Sold (MLS) $63,000 Beaches MLS
- 2000-08-04 Listing Removed — Beaches MLS
- 2000-03-10 Listed $64,900 Beaches MLS
- 1999-08-16 Listed $59,900 Beaches MLS
- 1982-07-01 Sold (Public Records) $53,000 Public Records
Property tax history
+15.8%/yrLatest (2025): $3,425 · -4.5% YoY. Source: county tax records.
Cash-flow waterfall
monthlySold comps — $/sqft
last 12 mo · ≤1 miLoading sold comps…