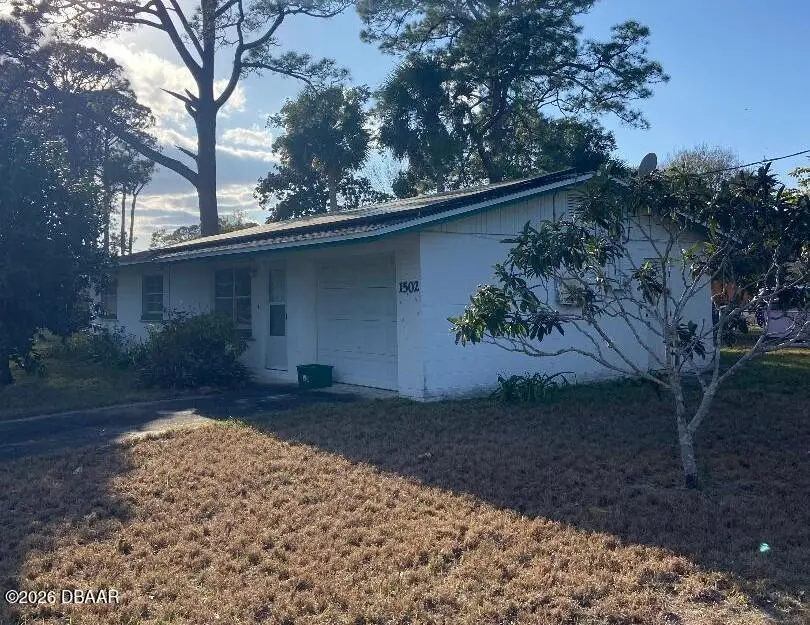
1502 Tuscaloosa Ave · Holly Hill, FL
Flood risk 6/10 · Moderate
- FEMA flood zone
- X (shaded)
- Chance of flooding over 30 yrs
- 0.51%
- Est. flood insurance / yr
- $507 – $1,088
Fire risk 1/10 · Minimal
- Est. fire insurance / yr
- $947 – $1,759
Heat risk 10/10 · Severe
- Hot days now (above 104°F)
- 7 days/yr
- Hot days in 30 yrs
- 20 days/yr
Wind risk 10/10 · Severe
- Chance of severe wind over 30 yrs
- 99.0%
Air-quality risk 2/10 · Minimal
- Unhealthy air days now
- 1 days/yr
- Unhealthy air days in 30 yrs
- 1 days/yr
Risk factors via First Street. Map © Google.
Why this score? — see what drove the C- grade
The composite is a weighted blend of 9 inputs, each scored 0–100. Each bar is that input's sub-score; the figure is the points it added to the 100-point composite (weight × sub-score).
- Cash flow +19.6/30.0
- ARV discount +7.5/15.0
- DSCR +6.2/10.0
- 1% rule +5.7/10.0
- Schools +3.9/10.0
- Livability +3.6/5.0
- Rent growth +2.8/5.0
- Condition / age +2.5/5.0
- Appreciation +0.0/10.0
$149,900
🖨 Deal sheet 📄 Offer letter ✓ Due diligence
Listing remarks
Great location in the heart of Holly Hill, nice corner lot on a quiet street close to shopping, recreation and local Colleges. This is a true 3 bedroom that the county assessor mislabeled as a 2. 1/2 bath is off the primary bedroom. Split floor plan with a screened Florida room that runs the length of the house provides additional space. Needs work to pass a 4 point inspection for insurance, cash or rehab loans only. Solar system is inoperable.
Key facts
- Quiet street
- Corner lot
- 9,583 sq ft lot
Tags
Property features AI
Exterior
- Parking: Attached garage (1 car)
- Utilities: Public water; Public sewer; 150 Amp electrical service; Electricity connected; Water available; Sewer connected
- Home design: Single-family residence; One story; Faces south; Listed as fixer condition
- Construction: Shingle roof; Block foundation; Built with standard residential construction
- Exterior features: Screened rear porch; Corner lot; Asphalt city street frontage; Publicly maintained road
Interior
- Kitchen: Electric range
- Flooring: Laminate flooring; Tile flooring
- Bathrooms: 1 full bathroom; 1 half bathroom
- Heating & cooling: Central heating (electric); Central air conditioning; Ceiling fan(s)
- Interior features: Ceiling fans
- Laundry & utility: Washer hookup; Electric dryer hookup; Laundry area in garage
Neighborhood map
What this means for you Summary
Snapshot
- This is a 2-bed/1.5-bath single-family listed at $150k.
Deal economics
- At list price, monthly cash flow is $172 ($2k/yr) — positive.
- The deal already cash-flows at list — no discount required.
- Meets the 1% rule at list price ($2k rent vs $150k).
- Recommended offer: $132k (12.0% below list) — sets the bar for market timing.
Location & tenants
- Location reads 72/100 on livability (#325 in FL) — a middle-class / working-renter tenant base. Strengths: cost of living A+, housing A+, health & safety A+; Watch: schools F, amenities F, commute F.
- Volusia (suburban): math 44% / reading 49% proficiency, ranked #47 of 73 in FL (top 64%) — families likely to look elsewhere, expect single-tenant / working-renter base with shorter leases.
- Market conditions: Rents rising (+1.0%/yr); 332 active listings in the ZIP; 25 comparable units currently listed for rent nearby; rentals at typical pace (median 23d on market — plan ~3-4 weeks tenant-placement turnaround); 3,402 units permitted in Volusia County in 2024 (681 in 5+ unit buildings).
- This rent runs 34% of the median local income ($56k/yr) — at the standard rent-burdened threshold; future hikes will face affordability resistance.
Forward outlook
- Local home prices are declining (-3.0%/yr); year-one equity from $1k of loan paydown is wiped out by about $4k of value loss. Plan a longer hold.
- Volusia County population projected at +19% by 2050 — long-run rental-demand tailwind backs the buy-and-hold thesis.
Negotiation context
- It's been on market 137 days — a 12% lower offer ($132k) is reasonable based on typical stale-listing flexibility.
- 5 sale attempts since 7y ago; this cycle's ask has dropped $20k (12%) from the opening price — seller is motivated, your offer sets the floor, not the list.
- Current owner paid $52k; list at $150k implies a 186% gain — meaningful room to come down on a strong offer.
Risks & watch-outs
- Climate carrying-cost: major flood risk; severe wind risk, 99% chance of damaging wind over 30y; extreme-heat days projected 7→20/yr by 2055 (HVAC capex compounding) — expect insurance premiums to compound above CPI over the hold.
Questions for the listing agent
- It's been on market 137 days. Have you received any prior offers? Is the seller open to a 12% concession, seller financing, or rate buy-down credit?
- Built in 1972 — when were the roof, HVAC, electrical panel, plumbing, and water heater last replaced?
- Why hasn't it sold? Are there any deal-killer items the seller is aware of (foundation, flood, title, zoning, code violations)?
- Is there a deadline driving the sale (1031 exchange, divorce, estate, relocation)? That informs how much negotiation room exists.
- Schools are F-rated, which usually means shorter tenancies and higher turnover. Who's the typical renter profile here, and what's been the actual vacancy rate?
- What's the average days-on-market for RENTAL listings here right now (not sales)? A rising rental-DOM trend means longer vacancies and softer asking-rent achievability than the comps imply.
- What's the recent tenant-quality profile in this submarket — average credit score on applications, eviction rate, late-payment / NSF rate, and stable-employment percentage? A property-management company in the area should have these aggregated.
- How much new for-sale + rental construction is in the pipeline within 1–3 miles? Heavy new supply typically softens prices + rents 12–24 months out; constrained supply supports both.
Investment metrics
- 1% rule
- 1.07% ✓
- Cap rate
- 7.67%
- Cash-on-cash
- 4.91%
- DSCR
- 1.22
- GRM
- 7.8
CMA / ARV
No comps found within radius.
Projected returns pro-forma
-3.0% appreciation · 1.01% rent growth · sell at horizon
- IRR
- -11.0%
- Equity multiple
- 0.61×
- Total profit
- $-16,422
- Equity at exit
- $22,351
- IRR
- -4.9%
- Equity multiple
- 0.71×
- Total profit
- $-12,332
- Equity at exit
- $12,961
Cash invested: $41,972 (down + closing). Projections, not guarantees.
Landlord ↔ Tenant lean methodology
- Overall (STATE)
- 87 Strongly Landlord-Friendly
- State Florida
- 87 Strongly Landlord-Friendly · R+3
- County
- — inherits STATE
- City
- — inherits STATE
ZIP-level market 32117
- Home prices YoY
- -8.2%
- Rents YoY
- 1.0%
- Active inventory
- 332
- Price-to-rent
- 7.8×
Monthly cashflow live
- Estimated rent
- $1,597 high interval (Pro) →
- Mortgage (P&I)
- −$786
- Tax from tax record
- −$241 /mo · $2,890/yr
- Insurance
- −$62
- HOA
- −$0
- Vacancy / Maint / Mgmt
- −$335
- Net cashflow
- $172
Break-even live
UW: 25.0% down · 7.5% · 30yr · 1.5% tax · 5.0% vac · 8.0% maint · 8.0% mgmt
Financing live
Cash to close
- Down payment
- $37,475
- Closing costs
- $4,497
- Reserves months
- —
- Total cash needed
- —
Loan-product check · same deal, 3 products live
Conventional
25% down · 7.5% · 30yr
- Down + closing
- —
- Monthly P&I
- —
- Monthly cashflow
- —
- DSCR
- —
- Eligible?
- —
Personal DTI + credit; lowest rate.
DSCR
20% down · 8.5% · 30yr
- Down + closing
- —
- Monthly P&I
- —
- Monthly cashflow
- —
- DSCR
- —
- Eligible?
- —
No personal income docs; deal must DSCR.
Hard money
10% down · 12.0% · 12mo
- Down + closing
- —
- Monthly P&I
- —
- Monthly cashflow
- —
- DSCR
- —
- Eligible?
- —
Short-term bridge; refi at stabilization.
Rent comps 25 comps
| Address | Beds | Baths | Sqft | Rent | $/sqft | DOM | Units | Dist |
|---|---|---|---|---|---|---|---|---|
| 1540 Espanola Ave Unit 9 Daytona Beach, FL | 1.0 | 1.0 | 600 | $900 | $1.50 | 23d | 1 | 0.40mi |
| 946 15th St Daytona Beach, FL | 2.0 | 2.0 | 1010 | $1,500 | $1.49 | 23d | 1 | 0.47mi |
| 1563 Hancock Ln Daytona Beach, FL | 2.0 | 2.0 | 912 | $1,475 | $1.62 | 11d | 1 | 0.52mi |
| 638 LPGA Blvd Unit B Daytona Beach, FL | 3.0 | 2.0 | 1111 | $2,490 | $2.24 | 23d | 1 | 0.56mi |
| 1355 Hiawatha Ave Daytona Beach, FL | 2.0 | 1.0 | 780 | $1,675 | $2.15 | 14d | 1 | 0.61mi |
| 900 LPGA Blvd Daytona Beach, FL | 1.0–2.0 | 1.0–2.0 | 885 | $1,495 | $1.69 | 14d | 14 | 0.65mi |
| 1521 Moravia Ave Daytona Beach, FL | 2.0 | 2.0 | 700 | $2,000 | $2.86 | 19d | 1 | 0.72mi |
| 1559 Hammock Dr Unit B Holly Hill, FL | 2.0 | 1.5 | 1100 | $1,375 | $1.25 | 14d | 1 | 0.75mi |
| 1707 Evergreen St Ormond Beach, FL | 2.0 | 1.0 | 868 | $1,750 | $2.02 | 23d | 1 | 0.94mi |
| 840 Center Ave Apt 75 Holly Hill, FL | 2.0 | 1.0 | 900 | $1,250 | $1.39 | 23d | 1 | 0.96mi |
| 851 State Ave Daytona Beach, FL | 2.0 | 1.0 | 682 | $1,495 | $2.19 | 23d | 1 | 0.98mi |
| 660 8th St Daytona Beach, FL | 2.0 | 1.0 | 900 | $1,375 | $1.53 | 23d | 1 | 1.01mi |
| 921 Daytona Ave Unit A Daytona Beach, FL | 2.0 | 1.0 | 1100 | $1,775 | $1.61 | 23d | 1 | 1.03mi |
| 820 State Ave Unit 2 Daytona Beach, FL | 2.0 | 1.0 | 690 | $1,250 | $1.81 | 23d | 1 | 1.05mi |
| 820 State Ave Apt 1 Daytona Beach, FL | 2.0 | 2.0 | 841 | $1,470 | $1.75 | 23d | 1 | 1.05mi |
| 820 State Ave Unit 3 Daytona Beach, FL | 2.0 | 1.0 | 841 | $1,370 | $1.63 | 23d | 1 | 1.05mi |
| 1615 Derbyshire Rd Daytona Beach, FL | 3.0 | 1.5 | 1000 | $1,950 | $1.95 | 14d | 1 | 1.22mi |
| 2711 N Halifax Ave Daytona Beach, FL | 1.0–2.0 | 1.0 | 785 | $1,675 | $2.13 | 23d | 2 | 1.35mi |
| 2711 N Halifax Ave Daytona Beach, FL | 1.0–2.0 | 1.0 | 785 | $1,675 | $2.13 | 14d | 3 | 1.35mi |
| 3009 N Halifax Ave #2 Daytona Beach, FL | 1.0 | 1.0 | 612 | $1,250 | $2.04 | 23d | 1 | 1.38mi |
| 3009 N Halifax Ave #1 Daytona Beach, FL | 2.0 | 1.5 | 816 | $1,650 | $2.02 | 23d | 1 | 1.38mi |
| 410 Sauls St Ormond Beach, FL | 3.0 | 1.0 | 990 | $1,500 | $1.52 | 23d | 1 | 1.39mi |
| 430 Dorothy Ave Daytona Beach, FL | 3.0 | 1.0 | 1103 | $1,700 | $1.54 | 14d | 1 | 1.42mi |
| 100 Windflower LN Daytona Beach, FL | 1.0–3.0 | 1.0–2.0 | 1021 | $2,014 | $1.97 | 11d | 63 | 1.48mi |
| 101 Claysburg LN Holly Hill, FL | 1.0–3.0 | 1.0–2.0 | 1163 | $2,322 | $2.00 | 14d | 25 | 1.48mi |
Listing history 31 events
-
2026-06-18days on market $149,900 Active 137 DOM
-
2026-06-17remarks 448-char remark
-
2026-06-17price $149,900 Active 136 DOM
-
2026-06-17days on market $154,900 Active 136 DOM
-
2026-06-16days on market $154,900 Active 135 DOM
-
2026-06-15days on market $154,900 Active 134 DOM
-
2026-06-14days on market $154,900 Active 132 DOM
-
2026-06-10days on market $154,900 Active 129 DOM
-
2026-06-09days on market $154,900 Active 128 DOM
-
2026-06-08days on market $154,900 Active 127 DOM
-
2026-06-07days on market $154,900 Active 126 DOM
-
2026-06-05days on market $154,900 Active 123 DOM
-
2026-06-03days on market $154,900 Active 122 DOM
-
2026-06-03days on market $154,900 Active 121 DOM
-
2026-06-01days on market $154,900 Active 120 DOM
-
2026-05-31days on market $154,900 Active 119 DOM
-
2026-05-31days on market $154,900 Active 118 DOM
-
2026-05-19status Active
-
2026-05-08historical Active Under Contract
-
2026-04-10price $154,900
-
2026-03-25status Active
-
2026-03-11historical Active Under Contract
-
2026-03-05price $159,900
-
2026-02-01$169,900 Active
-
2026-01-15$5,000 Active
-
2019-10-30historical
-
2019-10-08$175,000 Active
-
1996-11-03soldstatus $52,500
-
1988-11-01soldstatus $55,000
-
1986-12-01soldstatus $49,000
-
1981-12-01soldstatus $39,000
ⓘ Source: listings_history table (triggers on properties + properties_extension) + one-shot
backfill from property_details.listing_events for pre-trigger history.
Tax reassessment forecast FL · Resets to sale price
- Current annual tax
- $2,890 · $241/mo
- Projected year-2 tax
- $2,890 · $241/mo
- Expected delta
- $0/yr ($0/mo · 0.0%)
ⓘ Screening estimate from a state-policy table — verify with the county assessor before closing.
Climate risk First Street
- Flood 6/10 Major FEMA zone X (shaded) · 51% chance over 30 yrs
- Wildfire 1/10 Low
- Heat 10/10 Extreme 7 d/yr ≥104°F today · 20 d/yr by 30 yrs out
- Wind 10/10 Extreme 99% chance of damaging wind over 30 yrs
- Air quality 2/10 Low 1 unhealthy d/yr today · 1 by 30 yrs out
Nearby sold comps map
Loading sold comps map…
Walkable amenities ~0.75 mi
Loading nearby amenities…
Taxation est. · year 1
- Rental income
- $19,158
- − Mortgage interest
- −$8,397
- − Property taxes
- −$2,890
- − Insurance
- −$750
- − Repairs & maintenance
- −$1,533
- − Management
- −$1,533
- − Depreciation
- −$4,361
- Taxable loss
- −$304
- Est. tax savings @ 24.0%
- +$73
- After-tax cash flow
- $2,135/yr
For passive investors: Depreciation is non-cash, so a rental often shows a tax loss while cash-flowing — sheltering income. Rental losses are passive: they offset passive income freely, and up to $25,000/yr can offset ordinary (W-2) income if you actively participate and your MAGI is under $100k (phasing out to $0 by $150k); unused losses carry forward. On sale, claimed depreciation is recaptured at up to 25%, and gains may owe capital-gains tax (a 1031 exchange can defer both). Figures are a year-1 estimate at your 24.0% rate — not tax advice; consult a CPA.
Schools (NCES district)
- District
- Volusia
- NCES district ID
- 1201920
- Math proficiency
- 44% ▼ -9.00%
- Reading proficiency
- 49% ▼ -3.00%
- Median HH income
- $42,946
- Composite
- 39.2/100
- National rank
- #4019
- State rank
- #47 of 73 in FL
Livability — Holly Hill
- Score
- 72/100
- State rank
- #325
- US rank
- #5737
Category grades
Schools grade is shown separately in the Schools card above.
Census & demographics
- Census place
- Holly Hill, FL
- County
- Volusia County · 556,871 people
- Metro
- Deltona-Daytona Beach-Ormond Beach, FL
- Population (ZIP)
- 30,955
- Household income
- $56,419
- Rent vs Own
- Severe rent burden
- 1781.0
Population outlook (Volusia County) Hauer SSP2
- Today (2025)
- 572,749 people
- By 2030
- 598,695 · +4.5%
- By 2040
- 644,880 · +12.6%
- By 2050
- 681,451 · +19.0%
- By 2075
- 759,957 · +32.7%
- By 2100
- 778,902 · +36.0%
Race, ethnicity, and origin ACS 2023
- Neighborhood character
- Diverse neighborhood (Simpson 0.63)
- Race & ethnicity
- White 53% Black 27% Hispanic / Latino 10% Two or more races 9% Asian 3%
- Hispanic origin (detail)
- Mexican 2% Puerto Rican 3%
- Common ancestry
- Romanian 2% Lithuanian 2% Slovak 1%
- Foreign-born
- 8% · Canada, Vietnam, Jamaica
- Languages at home
- 86% English-only · Spanish 8% Vietnamese 1% Other Indo-European 1%
Political lean MEDSL · Volusia
- 2024 margin
- Strong R (+21.8) · D 38.7% · R 60.5%
- 2008→2024 swing
- -27.4pp toward R · 2008: 5.7pp · 2024: -21.8pp
- All cycles
- 2024: R+21.8 2020: R+14.1 2016: R+13.1 2012: R+1.2 2008: D+5.7
Not yet ingested
- Civics
- —
Market trends
- HPI YoY
- ▼ -96.62%
- Current HPI
- 1084.54
- Rent YoY
- ▲ 1.01%
- Metro
- Deltona-Daytona Beach-Ormond Beach, FL
- State GDP YoY
- ▲ 3.28%
- F500 in state
- 36
Industry mix (Fortune 500 HQ in FL)
| Industry | F500 HQs | Revenue |
|---|---|---|
| Industrial Technology | 2 | $29B |
|
||
| Insurance | 2 | $17B |
|
||
| Retail | 1 | $60B |
|
||
| Technology Distribution | 1 | $58B |
|
||
| Homebuilding | 1 | $35B |
|
||
| Technology Manufacturing | 1 | $35B |
|
||
Price history
+297.2% since first listed14 events — show timeline
- 2026-05-19 Relisted — Daytona MLS
- 2026-05-08 Contingent — Daytona MLS
- 2026-04-10 Price Changed $154,900 Daytona MLS
- 2026-03-25 Relisted — Daytona MLS
- 2026-03-11 Contingent — Daytona MLS
- 2026-03-05 Price Changed $159,900 Daytona MLS
- 2026-02-01 Listed $169,900 Daytona MLS
- 2026-01-15 Listed $5,000 NFMLS
- 2019-10-30 Listing Removed — Daytona MLS
- 2019-10-08 Listed $175,000 Daytona MLS
- 1996-11-03 Sold (Public Records) $52,500 Public Records
- 1988-11-01 Sold (Public Records) $55,000 Public Records
- 1986-12-01 Sold (Public Records) $49,000 Public Records
- 1981-12-01 Sold (Public Records) $39,000 Public Records
Property tax history
+30.8%/yrLatest (2025): $2,890 · -7.0% YoY. Source: county tax records.
Cash-flow waterfall
monthlySold comps — $/sqft
last 12 mo · ≤1 miLoading sold comps…