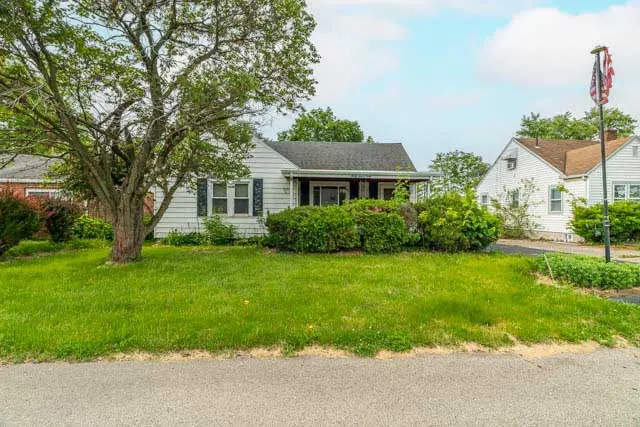
3740 Evansville Ave · Fort McKinley, OH
Flood risk 1/10 · Minimal
- FEMA flood zone
- X (unshaded)
- Chance of flooding over 30 yrs
- 0.0%
- Est. flood insurance / yr
- $473 – $860
Fire risk 1/10 · Minimal
- Est. fire insurance / yr
- $713 – $1,323
Heat risk 3/10 · Minor
- Hot days now (above 103°F)
- 7 days/yr
- Hot days in 30 yrs
- 18 days/yr
Wind risk 2/10 · Minimal
- Chance of severe wind over 30 yrs
- —
Air-quality risk 3/10 · Minor
- Unhealthy air days now
- 3 days/yr
- Unhealthy air days in 30 yrs
- 4 days/yr
Risk factors via First Street. Map © Google.
Why this score? — see what drove the B grade
The composite is a weighted blend of 9 inputs, each scored 0–100. Each bar is that input's sub-score; the figure is the points it added to the 100-point composite (weight × sub-score).
- Cash flow +27.9/30.0
- ARV discount +15.0/15.0
- DSCR +9.8/10.0
- 1% rule +8.5/10.0
- Rent growth +3.3/5.0
- Livability +2.5/5.0
- Condition / age +2.5/5.0
- Schools +1.3/10.0
- Appreciation +0.0/10.0
$69,900
🖨 Deal sheet 📄 Offer letter ✓ Due diligence
Listing remarks
Opportunity awaits with this 2-bedroom, 1-bath home offering 918 square feet of living space. Inside, you'll find hard surface flooring throughout, a functional layout with both living and family room spaces, and a covered front porch that adds to the home's appeal. Additional features include a partial unfinished basement, detached 1-car garage, and off-street parking. Whether you're looking to add to your rental portfolio, renovate and resell, or create equity through improvements, this property offers plenty of potential. Property is being sold as-is.
Key facts
- Covered front porch
- Functional layout
- Off-street parking
Tags
Property features AI
Finance
- Financial info: Offered for sale
Exterior
- Parking: Detached one-car garage
- Home design: Single-story home
- Construction: Frame construction
- Exterior features: Residential lot approximately 53 x 148
Interior
- Kitchen: Eat-in kitchen (approximately 15 x 8)
- Bedrooms: Two main-level bedrooms (approximately 10 x 10 and 10 x 11)
- Bathrooms: One full bathroom on the main level
- Heating & cooling: Forced air heating (natural gas); Wall cooling unit(s)
- Interior features: Partial, unfinished basement; Fireplace (one)
Neighborhood map
What this means for you Summary
Snapshot
- This is a 2-bed/1.0-bath single-family listed at $70k.
Deal economics
- At list price, monthly cash flow is $214 ($3k/yr) — positive.
- The deal already cash-flows at list — no discount required.
- Meets the 1% rule at list price ($945 rent vs $70k).
Location & tenants
- Location reads: area grade B — affects rentability + tenant quality, not the cash-flow math above.
- Dayton City (urban): math 12% / reading 21% proficiency, ranked #641 of 656 in OH (top 98%) — low school quality limits family demand, transient renter base, plan for 1-2y turnover; 74% free/reduced lunch — lower-income household profile, screen leases tightly.
- Market conditions: Rents rising (+3.0%/yr); 156 active listings in the ZIP; 39 comparable units currently listed for rent nearby; rentals lingering (median 44d on market — plan ~5-8 weeks vacancy on turnover, expect pricing pressure); 54% of comp listings sitting > 30 days — soft ceiling on asking rent; lower-income renter base — watch delinquency; 907 units permitted in Montgomery County in 2024 (416 in 5+ unit buildings).
Forward outlook
- Local home prices are declining (-3.0%/yr); year-one equity from $483 of loan paydown is wiped out by about $2k of value loss. Plan a longer hold.
- Montgomery County population projected at -10% by 2050 — secular population decline; favor cash flow + early exit over multi-decade hold.
- At projected returns (-3.0% appreciation + 3.0% rent growth), your $20k cash investment doubles in ~9 years — after that, you're playing with house money.
Negotiation context
- Only 7 days on market — expect competitive offers; lowballing is unlikely to land.
- Current owner paid $16k; list at $70k implies a 324% gain — meaningful room to come down on a strong offer.
Risks & watch-outs
- Watch-outs: built in 1937 — expect roof / HVAC / electrical / plumbing capex.
Questions for the listing agent
- Built in 1937 — when were the roof, HVAC, electrical panel, plumbing, and water heater last replaced?
- Is there a deadline driving the sale (1031 exchange, divorce, estate, relocation)? That informs how much negotiation room exists.
- What's the average days-on-market for RENTAL listings here right now (not sales)? A rising rental-DOM trend means longer vacancies and softer asking-rent achievability than the comps imply.
- What's the recent tenant-quality profile in this submarket — average credit score on applications, eviction rate, late-payment / NSF rate, and stable-employment percentage? A property-management company in the area should have these aggregated.
- How much new for-sale + rental construction is in the pipeline within 1–3 miles? Heavy new supply typically softens prices + rents 12–24 months out; constrained supply supports both.
Investment metrics
- 1% rule
- 1.35% ✓
- Cap rate
- 9.97%
- Cash-on-cash
- 13.14%
- DSCR
- 1.58
- GRM
- 6.2
CMA / ARV
- ARV (on-the-fly)
- $111,996
- Comps found
- 12
Show comp detail 12 sales within ~0.75 mi
| Address | Dist | Beds/Ba | Sqft | Sold | Price | $/sf | Match |
|---|---|---|---|---|---|---|---|
| 3656 Detroit Ave | 0.17mi | 2/1.0 | 967 (+5%) | 3mo | $102,000 | $105 | 81 |
| 2660 Grant Ave | 0.24mi | 3/1.5 (+1) | 912 (-1%) | 1mo | $78,000 | $86 | 79 |
| 3538 Pittsburg Ave | 0.31mi | 2/1.0 | 864 (-6%) | 3mo | $109,900 | $127 | 73 |
| 3678 Wilmore St | 0.21mi | 3/1.5 (+1) | 864 (-6%) | 3mo | $131,900 | $153 | 71 |
| 4288 Redonda Ln | 0.47mi | 3/2.0 (+1) | 864 (-6%) | 4mo | $125,000 | $145 | 56 |
| 4460 Curundu Ave | 0.64mi | 3/1.0 (+1) | 864 (-6%) | 3mo | $80,000 | $93 | 52 |
| 4247 Otis Dr | 0.63mi | 3/1.0 (+1) | 984 (+7%) | 2mo | $120,000 | $122 | 52 |
| 4466 Gatewood Pl | 0.63mi | 3/1.0 (+1) | 864 (-6%) | 5mo | $77,400 | $90 | 51 |
| 4342 Nevada Ave | 0.60mi | 3/1.0 (+1) | 997 (+9%) | 5mo | $115,000 | $115 | 49 |
| 4354 Free Pike | 0.55mi | 3/1.0 (+1) | 1,044 (+14%) | 3mo | $82,500 | $79 | 44 |
| 3462 Arlene Ave | 0.57mi | 3/1.0 (+1) | 1,044 (+14%) | 3mo | $130,000 | $125 | 43 |
| 4477 Gatewood Pl | 0.64mi | 3/1.5 (+1) | 1,032 (+12%) | 1mo | $144,897 | $140 | 42 |
Match score weights: distance 35% · size 25% · config 20% · recency 20%. Top-matched comps best support the ARV.
Projected returns pro-forma
-3.0% appreciation · 3.03% rent growth · sell at horizon
- IRR
- 3.2%
- Equity multiple
- 1.12×
- Total profit
- $2,397
- Equity at exit
- $10,422
- IRR
- 12.8%
- Equity multiple
- 2.02×
- Total profit
- $19,962
- Equity at exit
- $6,044
Cash invested: $19,572 (down + closing). Projections, not guarantees.
Landlord ↔ Tenant lean methodology
- Overall (STATE)
- 73 Landlord-Friendly
- State Ohio
- 73 Landlord-Friendly · R+6
- County
- — inherits STATE
- City
- — inherits STATE
ZIP-level market 45406
- Rents YoY
- 3.0%
- Active inventory
- 156
- Price-to-rent
- 6.2×
Monthly cashflow live
- Estimated rent
- $945 high interval (Pro) →
- Mortgage (P&I)
- −$367
- Tax from tax record
- −$136 /mo · $1,635/yr
- Insurance
- −$29
- HOA
- −$0
- Vacancy / Maint / Mgmt
- −$198
- Net cashflow
- $214
Break-even live
UW: 25.0% down · 7.5% · 30yr · 1.5% tax · 5.0% vac · 8.0% maint · 8.0% mgmt
Financing live
Cash to close
- Down payment
- $17,475
- Closing costs
- $2,097
- Reserves months
- —
- Total cash needed
- —
Loan-product check · same deal, 3 products live
Conventional
25% down · 7.5% · 30yr
- Down + closing
- —
- Monthly P&I
- —
- Monthly cashflow
- —
- DSCR
- —
- Eligible?
- —
Personal DTI + credit; lowest rate.
DSCR
20% down · 8.5% · 30yr
- Down + closing
- —
- Monthly P&I
- —
- Monthly cashflow
- —
- DSCR
- —
- Eligible?
- —
No personal income docs; deal must DSCR.
Hard money
10% down · 12.0% · 12mo
- Down + closing
- —
- Monthly P&I
- —
- Monthly cashflow
- —
- DSCR
- —
- Eligible?
- —
Short-term bridge; refi at stabilization.
Rent comps 39 comps
| Address | Beds | Baths | Sqft | Rent | $/sqft | DOM | Units | Dist |
|---|---|---|---|---|---|---|---|---|
| 3711 Pittsburg Ave Dayton, OH | 2.0 | 1.0 | 800 | $875 | $1.09 | 44d | 1 | 0.10mi |
| 4113 Crest Dr Dayton, OH | 1.0 | 1.0 | 650 | $650 | $1.00 | 44d | 1 | 0.27mi |
| 3858 Haney Rd Dayton, OH | 2.0 | 1.0 | 850 | $825 | $0.97 | 3d | 1 | 0.36mi |
| 2675-2727 N Gettysburg Ave Dayton, OH | 1.0 | 1.0 | 650 | $600 | $0.92 | 14d | 22 | 0.38mi |
| 2675-2727 N Gettysburg Ave Unit 2727-22 Dayton, OH | 1.0 | 1.0 | 650 | $600 | $0.92 | 44d | 1 | 0.38mi |
| 4132 Natchez Ave Dayton, OH | 3.0 | 1.5 | 991 | $1,250 | $1.26 | 3d | 1 | 0.52mi |
| 2609 Fairport Ave Dayton, OH | 3.0 | 1.0 | 1000 | $1,025 | $1.02 | 3d | 1 | 0.53mi |
| 2501 Fairport Ave Dayton, OH | 2.0 | 1.0 | 605 | $850 | $1.40 | 44d | 1 | 0.55mi |
| 4161 Mapleleaf Dr Dayton, OH | 3.0 | 1.0 | 960 | $1,250 | $1.30 | 3d | 1 | 0.60mi |
| 2408 Falmouth Ave Dayton, OH | 2.0 | 1.0 | 806 | $950 | $1.18 | 23d | 1 | 0.61mi |
| 2414 Hancock Ave Unit 2418 Dayton, OH | 1.0 | 1.0 | 600 | $650 | $1.08 | 44d | 1 | 0.62mi |
| 4425 Thompson Dr Dayton, OH | 3.0 | 1.0 | 864 | $1,150 | $1.33 | 3d | 1 | 0.79mi |
| 4003 Whitestone Ct Dayton, OH | 3.0 | 1.0 | 1096 | $1,275 | $1.16 | 44d | 1 | 0.83mi |
| 4527 Channing Ln Dayton, OH | 3.0 | 1.0 | 946 | $1,600 | $1.69 | 44d | 1 | 0.86mi |
| 4446 Waymire Ave Dayton, OH | 3.0 | 1.0 | 1100 | $1,100 | $1.00 | 21d | 1 | 0.92mi |
| 4365 Parkway Dr Trotwood, OH | 2.0 | 1.0 | 600 | $800 | $1.33 | 44d | 1 | 1.00mi |
| 5112 W Hillcrest Ave Unit 1 Dayton, OH | 3.0 | 1.0 | 972 | $700 | $0.72 | 23d | 1 | 1.03mi |
| 2257 Hepburn Ave Dayton, OH | 1.0 | 1.0 | 600 | $695 | $1.16 | 44d | 1 | 1.09mi |
| 2002 Val Vista Ct Dayton, OH | 3.0 | 1.0 | 975 | $1,095 | $1.12 | 21d | 1 | 1.11mi |
| 1330 W Hillcrest Ave Dayton, OH | 1.0 | 1.0 | 525 | $825 | $1.57 | 44d | 1 | 1.13mi |
| 4629 Queens Ave Dayton, OH | 2.0 | 1.0 | 900 | $1,100 | $1.22 | 44d | 1 | 1.17mi |
| 2014 Hickorydale Dr Unit 2016 Dayton, OH | 2.0 | 1.0 | 800 | $900 | $1.12 | 44d | 1 | 1.18mi |
| 2109 Victoria Ave Dayton, OH | 2.0 | 1.0 | 714 | $950 | $1.33 | 3d | 1 | 1.23mi |
| 1720 Kings Mill Ct Dayton, OH | 2.0 | 1.5 | 975 | $925 | $0.95 | 23d | 1 | 1.27mi |
| 3813 Briar Pl Apt 9 Dayton, OH | 1.0 | 1.0 | 900 | $925 | $1.03 | 23d | 1 | 1.32mi |
| 1982 Victoria Ave Dayton, OH | 1.0 | 1.0 | 675 | $700 | $1.04 | 44d | 1 | 1.35mi |
| 3537 Otterbein Ave Unit d Dayton, OH | 2.0 | 1.0 | 900 | $925 | $1.03 | 44d | 1 | 1.35mi |
| 1934 Tennyson Ave Dayton, OH | 1.0 | 1.0 | 675 | $700 | $1.04 | 44d | 1 | 1.37mi |
| 3311 Otterbein Ave Dayton, OH | 3.0 | 1.5 | 1004 | $1,300 | $1.29 | 11d | 1 | 1.39mi |
| 829 Uhrig Ave Unit 3 Dayton, OH | 2.0 | 1.0 | 760 | $875 | $1.15 | 14d | 1 | 1.41mi |
| 1732 Harold Dr Dayton, OH | 2.0 | 1.0 | 805 | $925 | $1.15 | 44d | 1 | 1.44mi |
| 4278 Catalpa Dr Unit 4 Dayton, OH | 2.0 | 1.0 | 800 | $795 | $0.99 | 44d | 1 | 1.45mi |
| 3650 Otterbein Ave Unit 3650 Dayton, OH | 2.0 | 1.0 | 900 | $800 | $0.89 | 3d | 1 | 1.46mi |
| 3652 Otterbein Ave Unit 3652 Dayton, OH | 2.0 | 1.0 | 700 | $800 | $1.14 | 3d | 1 | 1.46mi |
| 1207 W Fairview Ave Dayton, OH | 2.0 | 1.0 | 1023 | $825 | $0.81 | 44d | 1 | 1.47mi |
| 1207 W Fairview Ave Dayton, OH | 2.0 | 1.0 | 1023 | $825 | $0.81 | 3d | 1 | 1.47mi |
| 111 Bennington Dr Unit 1 Dayton, OH | 1.0 | 1.0 | 800 | $700 | $0.88 | 44d | 1 | 1.47mi |
| 111 Bennington Dr Unit 4 Dayton, OH | 1.0 | 1.0 | 750 | $750 | $1.00 | 44d | 1 | 1.47mi |
| 1203 W Fairview Ave Dayton, OH | 1.0 | 1.0 | 806 | $750 | $0.93 | 44d | 1 | 1.48mi |
Listing history 7 events
-
2026-06-18days on market $69,900 Active 7 DOM
-
2026-06-17days on market $69,900 Active 6 DOM
-
2026-06-16days on market $69,900 Active 5 DOM
-
2026-06-15days on market $69,900 Active 4 DOM
-
2026-06-14days on market $69,900 Active 2 DOM
-
2026-06-13remarks 560-char remark
-
2026-06-13$69,900 Active 1 DOM
ⓘ Source: listings_history table (triggers on properties + properties_extension) + one-shot
backfill from property_details.listing_events for pre-trigger history.
Tax reassessment forecast OH · Partial reset (capped growth)
- Current annual tax
- $1,635 · $136/mo
- Projected year-2 tax
- $1,635 · $136/mo
- Expected delta
- $0/yr ($0/mo · 0.0%)
ⓘ Screening estimate from a state-policy table — verify with the county assessor before closing.
Climate risk First Street
- Flood 1/10 Low FEMA zone X (unshaded) · 0% chance over 30 yrs
- Wildfire 1/10 Low
- Heat 3/10 Moderate 7 d/yr ≥103°F today · 18 d/yr by 30 yrs out
- Wind 2/10 Low
- Air quality 3/10 Moderate 3 unhealthy d/yr today · 4 by 30 yrs out
Nearby sold comps map
Loading sold comps map…
Walkable amenities ~0.75 mi
Loading nearby amenities…
Taxation est. · year 1
- Rental income
- $11,336
- − Mortgage interest
- −$3,915
- − Property taxes
- −$1,635
- − Insurance
- −$350
- − Repairs & maintenance
- −$907
- − Management
- −$907
- − Depreciation
- −$2,033
- Taxable income
- $1,589
- Est. tax owed @ 24.0%
- −$381
- After-tax cash flow
- $2,191/yr
For passive investors: Depreciation is non-cash, so a rental often shows a tax loss while cash-flowing — sheltering income. Rental losses are passive: they offset passive income freely, and up to $25,000/yr can offset ordinary (W-2) income if you actively participate and your MAGI is under $100k (phasing out to $0 by $150k); unused losses carry forward. On sale, claimed depreciation is recaptured at up to 25%, and gains may owe capital-gains tax (a 1031 exchange can defer both). Figures are a year-1 estimate at your 24.0% rate — not tax advice; consult a CPA.
Schools (NCES district)
- District
- Dayton City
- NCES district ID
- 3904384
- Math proficiency
- 12% ▼ -12.00%
- Reading proficiency
- 21% ▼ -11.00%
- Median HH income
- $28,688
- Composite
- 12.94/100
- National rank
- #9579
- State rank
- #641 of 656 in OH
Livability — Fort McKinley
No livability data for this city. (Only ~50 U.S. cities are tracked.)
Census & demographics
- Census place
- Fort McKinley, OH
- County
- Montgomery County · 459,541 people
- City population
- 164,387
- Metro
- Dayton-Kettering, OH
- Population (ZIP)
- 19,991
- Household income
- $41,796
- Rent vs Own
- Severe rent burden
- 1504.0
Population outlook (Montgomery County) Hauer SSP2
- Today (2025)
- 523,241 people
- By 2030
- 514,948 · -1.6%
- By 2040
- 493,378 · -5.7%
- By 2050
- 469,639 · -10.2%
- By 2075
- 418,360 · -20.0%
- By 2100
- 353,315 · -32.5%
Race, ethnicity, and origin ACS 2023
- Neighborhood character
- Predominantly Black (75%)
- Race & ethnicity
- Black 75% White 16% Two or more races 7% Hispanic / Latino 3%
- Common ancestry
- Italian 2% Lithuanian 1% Slovak 1%
- Foreign-born
- 2% · Canada
- Languages at home
- 97% English-only · Spanish 1%
Political lean MEDSL · Montgomery
- 2024 margin
- Toss-up / Even · D 49.8% · R 49.3%
- 2008→2024 swing
- -5.8pp toward R · 2008: 6.2pp · 2024: 0.5pp
- All cycles
- 2024: D+0.5 2020: D+2.2 2016: R+1.2 2012: D+3.1 2008: D+6.2
Not yet ingested
- Civics
- —
Market trends
- HPI YoY
- ▼ -113.75%
- Current HPI
- 197.1302
- Rent YoY
- ▲ 3.03%
- Metro
- Dayton-Kettering, OH
- State GDP YoY
- ▲ 1.98%
- F500 in state
- 48
Industry mix (Fortune 500 HQ in OH)
| Industry | F500 HQs | Revenue |
|---|---|---|
| Insurance | 3 | $145B |
|
||
| Industrial Machinery | 3 | $49B |
|
||
| Financial Services | 3 | $24B |
|
||
| Consumer Goods | 2 | $93B |
|
||
| Aerospace / Defense | 2 | $47B |
|
||
| Utilities | 2 | $33B |
|
||
Price history
+323.6% since first listed2 events — show timeline
- 2026-06-09 Listed $69,900 Dayton MLS
- 1978-08-02 Sold (Public Records) $16,500 Public Records
Property tax history
+20.3%/yrLatest (2025): $1,635 · +400.2% YoY. Source: county tax records.
Cash-flow waterfall
monthlySold comps — $/sqft
last 12 mo · ≤1 miLoading sold comps…