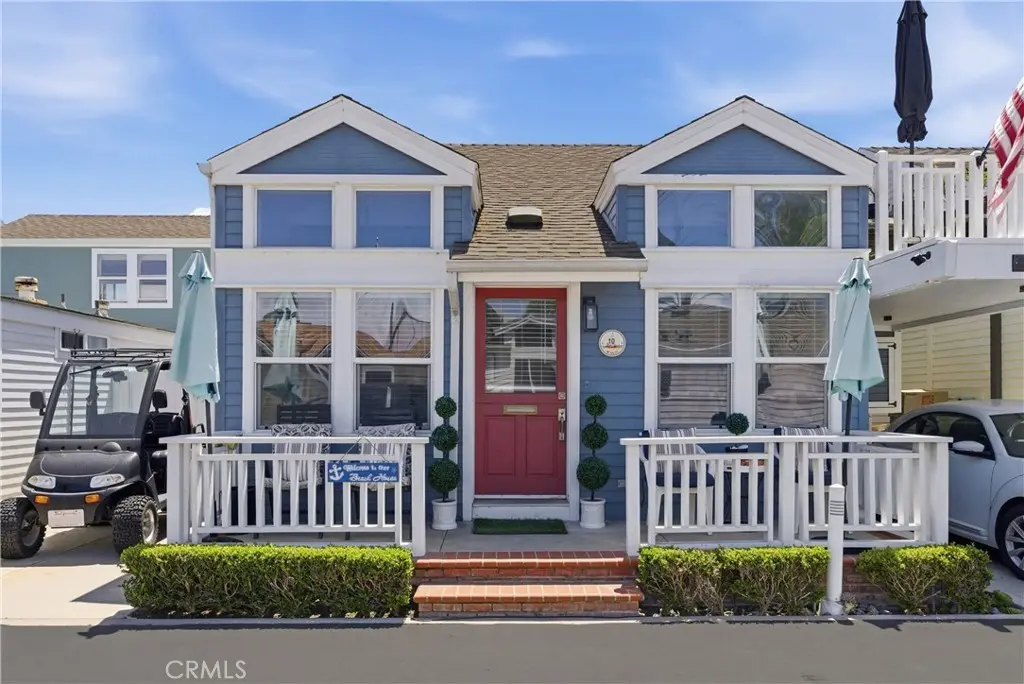
10 Anza St · Newport Beach, CA
Flood risk 10/10 · Severe
- FEMA flood zone
- X (shaded)
- Chance of flooding over 30 yrs
- 0.99%
- Est. flood insurance / yr
- $507 – $1,088
Fire risk 1/10 · Minimal
- Est. fire insurance / yr
- $659 – $1,223
Heat risk 5/10 · Moderate
- Hot days now (above 82°F)
- 7 days/yr
- Hot days in 30 yrs
- 21 days/yr
Wind risk 1/10 · Minimal
- Chance of severe wind over 30 yrs
- —
Air-quality risk 4/10 · Minor
- Unhealthy air days now
- 6 days/yr
- Unhealthy air days in 30 yrs
- 6 days/yr
Risk factors via First Street. Map © Google.
Why this score? — see what drove the D grade
The composite is a weighted blend of 9 inputs, each scored 0–100. Each bar is that input's sub-score; the figure is the points it added to the 100-point composite (weight × sub-score).
- ARV discount +10.2/15.0
- Appreciation +10.0/10.0
- Cash flow +6.9/30.0
- Schools +4.8/10.0
- Livability +3.8/5.0
- Rent growth +3.1/5.0
- Condition / age +2.5/5.0
- 1% rule +1.8/10.0
- DSCR +1.1/10.0
$769,500
🖨 Deal sheet (PDF) 📄 Offer letter ✓ Due diligence
Listing remarks MLS
This quintessential beach cottage is located in Newport on the harbor, seconds away from the private beach. This home has two bedrooms, two baths, and a loft/office area. Highlights include hard flooring throughout, updated modern bathrooms, vaulted ceilings, and a master suite and laundry closet on main floor. Open kitchen with updated counters. Living room and master suite open to large decks with ocean breezes - perfect for entertaining! Great property for a light remodel. Located in one of Newport Beach's most exclusive private communities with a private beach, security, heated pool, hot tub, clubhouse, gym, and ample private parking for guests and residents, kayak & golf cart storage, and boat slip rentals steps away from your home. Possible available boat slips for purchase. Within walking distance of Newport's hottest restaurants and shopping areas (Lido Marina Village, Nobu, The Cannery). If you are looking for a quiet and secluded area in Newport while still having a great sense of community, this home could be what you are looking for in Newport’s best kept secret! Low Land Lease of $2,595/Mo. Ask about the low property tax rate.
Key facts
- Oversized decks
- Remodeled kitchen
- Private beach
Tags
Property features AI
Finance
- Other: Manager approval required; Park name: Lido Resort; Subdivision: Lido Peninsula (LIPN)
- Financial info: Land lease (park) with monthly payment; rent includes trash and pool
- HOA & community: Onsite property management; Pool and spa; Clubhouse; Gym/exercise room; Barbecue area; Trash service; Street lighting and storm drains in community; Association has pet rules (size, number, breed restrictions) and weight limits; call for rules; Guard on site; call for rules
Exterior
- Parking: Located in Lido Resort park
- Utilities: Public sewer; District/Public water
- Home design: Courtyard Home model; 2 total stories; Mobile home remains
- Construction: Year built per public records; Mobile dimensions approximately 26 by 27 feet
- Exterior features: Association heated pool; Zero lot line
Interior
- Bathrooms: 2 full bathrooms
- Heating & cooling: Central furnace heating
- Interior features: Two-level layout; Entry on level 1; Association-maintained heated in-ground spa
- Laundry & utility: In-closet stackable laundry
Neighborhood map
What this means for you Summary
Snapshot
- This is a 2-bed/2.0-bath manufactured listed at $770k.
Deal economics
- At list price, monthly cash flow is $-1k ($-15k/yr) — negative.
- To cash-flow at today's rent, offer at most $591k (23.2% below list).
- To meet the 1% rule (rent ≥ 1% of price), the offer needs to be $525k (31.7% below list).
- Recommended offer: $525k (31.7% below list) — sets the bar for 1% rule.
- Cap rate 4.5% vs local median 0.6% in Newport Beach — top-decile yield for the area; either an underpriced asset or a hidden risk that comps aren't pricing in. Stress-test before assuming the spread holds.
Location & tenants
- Location reads 76/100 on livability (#101 in CA, #3,645 nationally) — a middle-class / working-renter tenant base. Strengths: amenities A+, employment A+, commute A; Watch: health & safety C-, cost of living F.
- Newport-Mesa Unified (urban): math 46% / reading 58% proficiency, ranked #106 of 517 in CA (top 20%) — acceptable for families but not a draw, mixed tenant base, ~2y average lease.
- Zoned schools: Newport Elementary (math 67%, 313 students, 26% FRL); Horace Ensign Intermediate (math 49%, 915 students, 48% FRL); Newport Harbor High (math 44% / reading 66%, grade C, #249 of 1,170 statewide, top 22%, 2,268 students, 44% FRL) — zoned schools at 39% FRL track the district average.
- Market conditions: Rents rising (+2.6%/yr); 121 active listings in the ZIP; 40 comparable units currently listed for rent nearby; rentals at typical pace (median 24d on market — plan ~3-4 weeks tenant-placement turnaround); high-income renter base; 6,974 units permitted in Orange County in 2024 (3,839 in 5+ unit buildings).
Forward outlook
- In year one you build about $82k of equity ($5k loan paydown + $77k appreciation (10.0% local appreciation)).
- Orange County population projected at +14% by 2050 — modest demand growth; plan on rents tracking national, not racing it.
- By year 2, paydown + projected appreciation supports a ~$132k cash-out refi (75% LTV) — recoverable capital for the next deal without selling this one.
Negotiation context
- It's been on market 22 days — a 2% lower offer ($758k) is reasonable based on typical stale-listing flexibility.
- 5 sale attempts since 21y ago with the ask held roughly flat each time — persistent listings suggest the price (not the market) is what's stuck; bring a comps-based counter.
- Current owner paid $425k; list at $770k implies a 81% gain — meaningful room to come down on a strong offer.
Risks & watch-outs
- Watch-outs: flood insurance adds $66/mo.
- Climate carrying-cost: severe flood risk; extreme-heat days projected 7→21/yr by 2055 (HVAC capex compounding) — expect insurance premiums to compound above CPI over the hold.
Questions for the listing agent
- What do current leases actually rent for vs. the listed asking? Can we see a recent rent roll and the last 12 months of T-12 income?
- What's the actual annual flood-insurance premium (NFIP or private), and is the property in a SFHA with mandatory coverage?
- Is there a deadline driving the sale (1031 exchange, divorce, estate, relocation)? That informs how much negotiation room exists.
- Schools are A-rated — typically a magnet for longer-tenancy family renters. What's the average tenant stay here, and is there a school-zone premium baked into asking?
- The area grade is low — what's the realistic commute time and amenity access for the typical tenant pool here? Any planned neighborhood developments (good or bad) we should know about?
- What's the average days-on-market for RENTAL listings here right now (not sales)? A rising rental-DOM trend means longer vacancies and softer asking-rent achievability than the comps imply.
- What's the recent tenant-quality profile in this submarket — average credit score on applications, eviction rate, late-payment / NSF rate, and stable-employment percentage? A property-management company in the area should have these aggregated.
- How much new for-sale + rental construction is in the pipeline within 1–3 miles? Heavy new supply typically softens prices + rents 12–24 months out; constrained supply supports both.
Investment metrics
- 1% rule
- 0.68% ✗
- Cap rate
- 4.47%
- Cash-on-cash
- -6.50%
- DSCR
- 0.71
- GRM
- 12.2
CMA / ARV
- ARV (on-the-fly)
- $819,000
- Comps found
- 8
Show comp detail 8 sales within ~0.75 mi
| Address | Dist | Beds/Ba | Sqft | Sold | Price | $/sf | Match |
|---|---|---|---|---|---|---|---|
| 11 Bolivar St | 0.04mi | 2/2.0 | 1,000 (0%) | 6mo | $818,500 | $819 | 93 |
| 45 Drake St | 0.12mi | 2/2.0 | 1,000 (0%) | 6mo | $750,000 | $750 | 90 |
| 16 Cabrillo St | 0.05mi | 2/2.0 | 1,000 (0%) | 16mo | $825,000 | $825 | 84 |
| 33 El Paseo St | 0.10mi | 2/2.0 | 1,000 (0%) | 20mo | $750,000 | $750 | 79 |
| 29 Drake St | 0.05mi | 2/2.0 | 1,000 (0%) | 24mo | $760,000 | $760 | 78 |
| 1 Bolivar St | 0.02mi | 2/2.0 | 944 (-6%) | 22mo | $772,500 | $818 | 71 |
| 45 Beach Dr | 0.09mi | 2/2.0 | 1,107 (+11%) | 9mo | $990,000 | $894 | 70 |
| 51 Beach Dr | 0.11mi | 2/2.0 | 1,107 (+11%) | 11mo | $1,050,000 | $949 | 68 |
Match score weights: distance 35% · size 25% · config 20% · recency 20%. Top-matched comps best support the ARV.
Projected returns pro-forma
10.0% appreciation · 2.56% rent growth · sell at horizon
- IRR
- 19.3%
- Equity multiple
- 2.57×
- Total profit
- $338,276
- Equity at exit
- $693,227
- IRR
- 17.7%
- Equity multiple
- 5.89×
- Total profit
- $1,053,616
- Equity at exit
- $1,494,969
Cash invested: $215,460 (down + closing). Projections, not guarantees.
Landlord ↔ Tenant lean methodology
- Overall (STATE)
- 18 Strongly Tenant-Friendly
- State California
- 18 Strongly Tenant-Friendly · D+13
- County
- — inherits STATE
- City
- — inherits STATE
ZIP-level market 92663
- Home prices YoY
- 3.6%
- Rents YoY
- 2.6%
- Active inventory
- 121
- Price-to-rent
- 12.2×
Monthly cashflow live
- Estimated rent
- $5,253 high interval (Pro) →
- Mortgage (P&I)
- −$4,035
- Tax est. 1.5%
- −$962 /mo · $11,542/yr
- Insurance
- −$321
- Flood insurance flood zone
- −$66 /mo · $798/yr
- HOA
- −$0
- Vacancy / Maint / Mgmt
- −$1,103
- Net cashflow
- $-1,234
Break-even live
Sensitivity live
| Price | -10% $-703 | -5% $-968 | +0% $-1,234 | +5% $-1,500 | +10% $-1,766 |
|---|---|---|---|---|---|
| Rent | -10% $-1,649 | -5% $-1,442 | +0% $-1,234 | +5% $-1,027 | +10% $-819 |
| Rate | -1.0pp $-847 | -0.5pp $-1,039 | base $-1,234 | +0.5pp $-1,434 | +1.0pp $-1,637 |
UW: 25.0% down · 7.5% · 30yr · 1.5% tax · 5.0% vac · 8.0% maint · 8.0% mgmt
Financing live
Cash to close
- Down payment
- $192,375
- Closing costs
- $23,085
- Reserves months
- —
- Total cash needed
- —
Loan-product check · same deal, 3 products live
Conventional
25% down · 7.5% · 30yr
- Down + closing
- —
- Monthly P&I
- —
- Monthly cashflow
- —
- DSCR
- —
- Eligible?
- —
Personal DTI + credit; lowest rate.
DSCR
20% down · 8.5% · 30yr
- Down + closing
- —
- Monthly P&I
- —
- Monthly cashflow
- —
- DSCR
- —
- Eligible?
- —
No personal income docs; deal must DSCR.
Hard money
10% down · 12.0% · 12mo
- Down + closing
- —
- Monthly P&I
- —
- Monthly cashflow
- —
- DSCR
- —
- Eligible?
- —
Short-term bridge; refi at stabilization.
Rent comps 40 comps
| Address | Beds | Baths | Sqft | Rent | $/sqft | DOM | Units | Dist |
|---|---|---|---|---|---|---|---|---|
| 601 Lido Park Dr Unit G Newport Beach, CA | 2.0 | 2.0 | 1500 | $9,000 | $6.00 | 45d | 1 | 0.22mi |
| 601 Lido Park Dr Unit G Newport Beach, CA | 2.0 | 2.0 | 1500 | $9,000 | $6.00 | 9d | 1 | 0.22mi |
| 223 20th St Newport Beach, CA | 3.0 | 2.0 | 1500 | $6,300 | $4.20 | 45d | 1 | 0.27mi |
| 1826 W Balboa Blvd Unit A Newport Beach, CA | 3.0 | 2.0 | 1100 | $6,200 | $5.64 | 5d | 1 | 0.34mi |
| 1808 W Balboa Blvd Unit B Newport Beach, CA | 3.0 | 2.0 | 1200 | $6,300 | $5.25 | 45d | 1 | 0.35mi |
| 307 33rd St Unit B Newport Beach, CA | 1.0 | 1.0 | 700 | $3,300 | $4.71 | 16d | 1 | 0.46mi |
| 3012 W Oceanfront Newport Beach, CA | 3.0 | 2.0 | 1200 | $15,000 | $12.50 | 45d | 1 | 0.47mi |
| 2530 W Coast Hwy Newport Beach, CA | 2.0 | 2.0 | 1015 | $4,800 | $4.73 | 9d | 1 | 0.49mi |
| 2530 W Coast Hwy Newport Beach, CA | 2.0 | 2.0 | 1127 | $5,500 | $4.88 | 4d | 1 | 0.49mi |
| 1411 W Bay Ave Newport Beach, CA | 2.0 | 1.0 | 815 | $4,250 | $5.21 | 15d | 1 | 0.49mi |
| 121 33rd St Unit A Newport Beach, CA | 3.0 | 2.0 | 1327 | $4,400 | $3.32 | 45d | 1 | 0.52mi |
| 3206 W Oceanfront Newport Beach, CA | 2.0 | 2.0 | 800 | $12,000 | $15.00 | 45d | 1 | 0.52mi |
| 3121 W Coast Hwy Unit 7D Newport Beach, CA | 2.0 | 2.0 | 1240 | $6,500 | $5.24 | 16d | 1 | 0.54mi |
| 502 36th St Unit A Newport Beach, CA | 2.0 | 2.0 | 1015 | $5,300 | $5.22 | 45d | 1 | 0.55mi |
| 626 Clubhouse Ave Unit 626 Clubhouse D Newport Beach, CA | 2.0 | 1.0 | 700 | $4,750 | $6.79 | 16d | 1 | 0.55mi |
| 121 35th St Newport Beach, CA | 2.0 | 2.0 | 900 | $3,700 | $4.11 | 26d | 1 | 0.59mi |
| 52 Balboa Cvs Newport Beach, CA | 3.0 | 2.0 | 1380 | $11,500 | $8.33 | 45d | 1 | 0.67mi |
| 226 La Jolla Dr Newport Beach, CA | 2.0 | 1.0 | 1014 | $7,500 | $7.40 | 16d | 1 | 0.69mi |
| 1144 W Balboa Blvd Unit A Newport Beach, CA | 2.0 | 1.0 | 1100 | $4,750 | $4.32 | 26d | 1 | 0.70mi |
| 1144 W Balboa Blvd Unit A1 Newport Beach, CA | 2.0 | 1.0 | 1100 | $6,500 | $5.91 | 26d | 1 | 0.70mi |
| 222 N Newport Blvd Newport Beach, CA | 3.0 | 2.5 | 1300 | $5,750 | $4.42 | 4d | 1 | 0.70mi |
| 1114 W Balboa Blvd Unit 1114 Newport Beach, CA | 2.0 | 1.0 | 800 | $3,850 | $4.81 | 26d | 1 | 0.74mi |
| 312 Saint Andrews Rd Unit B Newport Beach, CA | 2.0 | 1.0 | 1000 | $4,850 | $4.85 | 45d | 1 | 0.75mi |
| 320 Catalina Dr Unit A Newport Beach, CA | 3.0 | 2.0 | 1200 | $5,250 | $4.38 | 45d | 1 | 0.76mi |
| 280 Cagney Ln #312 Newport Beach, CA | 1.0 | 1.0 | 915 | $4,750 | $5.19 | 4d | 1 | 0.80mi |
| 205 41st St Newport Beach, CA | 3.0 | 2.0 | 1450 | $7,500 | $5.17 | 20d | 1 | 0.81mi |
| 4208 River Ave Unit B Newport Beach, CA | 2.0 | 1.0 | 850 | $4,500 | $5.29 | 19d | 1 | 0.85mi |
| 950 Cagney Ln #304 Newport Beach, CA | 2.0 | 2.0 | 1320 | $5,995 | $4.54 | 45d | 1 | 0.87mi |
| 1400 Haven Pl Unit 533 Newport Beach, CA | 2.0 | 1.0 | 980 | $3,800 | $3.88 | 4d | 1 | 0.88mi |
| 533 Saint Andrews Rd Newport Beach, CA | 2.0 | 1.0 | 980 | $3,800 | $3.88 | 4d | 1 | 0.88mi |
| 210 Lille Ln #208 Newport Beach, CA | 2.0 | 2.0 | 1087 | $8,000 | $7.36 | 23d | 1 | 0.90mi |
| 2101 E 15th St #8 Newport Beach, CA | 2.0 | 1.5 | 1025 | $4,350 | $4.24 | 45d | 1 | 0.90mi |
| 913 W Balboa Blvd Newport Beach, CA | 3.0 | 3.0 | 1423 | $8,500 | $5.97 | 18d | 1 | 0.92mi |
| 913 W Balboa Blvd Unit C Newport Beach, CA | 3.0 | 3.0 | 1423 | $8,250 | $5.80 | 0d | 1 | 0.92mi |
| 500 Cagney Ln #109 Newport Beach, CA | 1.0 | 1.0 | 900 | $3,100 | $3.44 | 45d | 1 | 0.92mi |
| 101 Scholz Plz #224 Newport Beach, CA | 2.0 | 2.0 | 1231 | $6,500 | $5.28 | 20d | 1 | 0.93mi |
| 300 Cagney Ln #9 Newport Beach, CA | 1.0 | 1.0 | 814 | $3,700 | $4.55 | 45d | 1 | 0.95mi |
| 240 Nice Ln Newport Beach, CA | 2.0 | 2.0 | 1320 | $4,995 | $3.78 | 45d | 1 | 0.95mi |
| 240 Nice Ln #102 Newport Beach, CA | 2.0 | 1.0 | 1136 | $4,400 | $3.87 | 7d | 1 | 0.95mi |
| 102 Scholz Plz Newport Beach, CA | 1.0 | 1.0 | 726 | $3,045 | $4.19 | 4d | 1 | 0.95mi |
Listing history 16 events
-
2026-06-21days on market $769,500 Active 22 DOM
-
2026-06-18days on market $769,500 Active 19 DOM
-
2026-06-17days on market $769,500 Active 18 DOM
-
2026-06-16days on market $769,500 Active 17 DOM
-
2026-06-15days on market $769,500 Active 16 DOM
-
2026-06-13days on market $769,500 Active 14 DOM
-
2026-06-13days on market $769,500 Active 13 DOM
-
2026-06-09days on market $769,500 Active 10 DOM
-
2026-06-08days on market $769,500 Active 9 DOM
-
2026-06-07pricedays on market $769,500 Active 8 DOM
-
2026-06-04days on market $799,500 Active 5 DOM
-
2026-06-03days on market $799,500 Active 4 DOM
-
2026-06-02days on market $799,500 Active 3 DOM
-
2026-06-01days on market $799,500 Active 2 DOM
-
2026-05-31remarks 699-char remark
-
2026-05-31$799,500 Active 1 DOM
ⓘ Source: listings_history table (triggers on properties + properties_extension) + one-shot
backfill from property_details.listing_events for pre-trigger history.
Climate risk First Street
- Flood 10/10 Extreme FEMA zone X (shaded) · 99% chance over 30 yrs
- Wildfire 1/10 Low
- Heat 5/10 Major 7 d/yr ≥82°F today · 21 d/yr by 30 yrs out
- Wind 1/10 Low
- Air quality 4/10 Moderate 6 unhealthy d/yr today · 6 by 30 yrs out
Nearby sold comps map
Loading sold comps map…
Walkable amenities ~0.75 mi
Loading nearby amenities…
Taxation est. · year 1
- Rental income
- $63,037
- − Mortgage interest
- −$43,104
- − Property taxes
- −$11,542
- − Insurance
- −$4,645
- − Repairs & maintenance
- −$5,043
- − Management
- −$5,043
- − Depreciation
- −$22,385
- Taxable loss
- −$28,726
- Est. tax savings @ 24.0%
- +$6,894
- After-tax cash flow
- $-7,918/yr
For passive investors: Depreciation is non-cash, so a rental often shows a tax loss while cash-flowing — sheltering income. Rental losses are passive: they offset passive income freely, and up to $25,000/yr can offset ordinary (W-2) income if you actively participate and your MAGI is under $100k (phasing out to $0 by $150k); unused losses carry forward. On sale, claimed depreciation is recaptured at up to 25%, and gains may owe capital-gains tax (a 1031 exchange can defer both). Figures are a year-1 estimate at your 24.0% rate — not tax advice; consult a CPA.
Schools (NCES district)
- District
- Newport-Mesa Unified
- NCES district ID
- 0627240
- Math proficiency
- 46% ▼ -6.00%
- Reading proficiency
- 58% ▼ -5.00%
- Median HH income
- $83,922
- Composite
- 47.64/100
- National rank
- #2248
- State rank
- #106 of 517 in CA
Livability — Newport Beach
- Score
- 76/100
- State rank
- #101
- US rank
- #3645
Category grades
Schools grade is shown separately in the Schools card above.
Census & demographics
- Census place
- Newport Beach, CA
- County
- Orange County · 3,096,323 people
- City population
- 83,845
- Metro
- Los Angeles-Long Beach-Anaheim, CA
- Population (ZIP)
- 21,368
- Household income
- $141,541
- Rent vs Own
- Severe rent burden
- 1158.0
Population outlook (Orange County) Hauer SSP2
- Today (2025)
- 3,477,456 people
- By 2030
- 3,613,117 · +3.9%
- By 2040
- 3,835,945 · +10.3%
- By 2050
- 3,968,736 · +14.1%
- By 2075
- 4,097,053 · +17.8%
- By 2100
- 3,903,633 · +12.3%
Race, ethnicity, and origin ACS 2023
- Neighborhood character
- Predominantly White (81%)
- Race & ethnicity
- White 81% Hispanic / Latino 13% Two or more races 8% Asian 3%
- Hispanic origin (detail)
- Mexican 9%
- Common ancestry
- Lithuanian 5% Italian 5% Romanian 4%
- Foreign-born
- 11% · Canada, Dominican Republic, Vietnam
- Languages at home
- 84% English-only · Spanish 7% Other Indo-European 3% Russian/Polish/Slavic 2%
Political lean MEDSL · Orange
- 2024 margin
- Toss-up / Even · D 49.7% · R 47.1% · Other 3.2%
- 2008→2024 swing
- +5.2pp toward D · 2008: -2.6pp · 2024: 2.6pp
- All cycles
- 2024: D+2.6 2020: D+9.0 2016: D+7.7 2012: R+8.3 2008: R+2.6
Not yet ingested
- Civics
- —
Market trends
- HPI YoY
- ▲ 19.24%
- Current HPI
- 552.1519
- Rent YoY
- ▲ 2.56%
- Metro
- Los Angeles-Long Beach-Anaheim, CA
- State GDP YoY
- ▲ 3.21%
- F500 in state
- 116
Industry mix (Fortune 500 HQ in CA)
| Industry | F500 HQs | Revenue |
|---|---|---|
| Technology | 27 | $1,492B |
|
||
| Financial Services | 3 | $174B |
|
||
| Retail | 3 | $44B |
|
||
| Insurance | 3 | $26B |
|
||
| Media / Entertainment | 2 | $115B |
|
||
| Pharmaceuticals / Biotech | 2 | $62B |
|
||
Price history
+190.8% since first listed19 events — show timeline
- 2026-05-30 Listed $799,500 CRMLS
- 2022-03-28 Sold (MLS) $425,000 CRMLS
- 2022-03-16 Pending — CRMLS
- 2022-02-25 Contingent — CRMLS
- 2022-02-17 Listed $435,000 CRMLS
- 2022-02-12 Coming Soon $435,000 CRMLS
- 2015-09-03 Sold (MLS) $315,000 CRMLS
- 2015-08-31 Pending — CRMLS
- 2015-08-26 Contingent — CRMLS
- 2015-07-17 Price Changed $339,000 CRMLS
- 2015-06-25 Price Changed $349,900 CRMLS
- 2015-05-14 Price Changed $365,000 CRMLS
- 2015-04-10 Price Changed $375,000 CRMLS
- 2015-02-20 Listed $399,000 CRMLS
- 2013-12-05 Sold (MLS) $254,000 CRMLS
- 2013-11-20 Pending — CRMLS
- 2013-09-20 Listed $259,900 CRMLS
- 2005-07-13 Listing Removed — CRMLS
- 2005-06-28 Listed $274,900 CRMLS
Property tax history
-2.1%/yrLatest (2025): $401 · -0.4% YoY. Source: county tax records.
Cash-flow waterfall
monthlySold comps — $/sqft
last 12 mo · ≤1 miLoading sold comps…