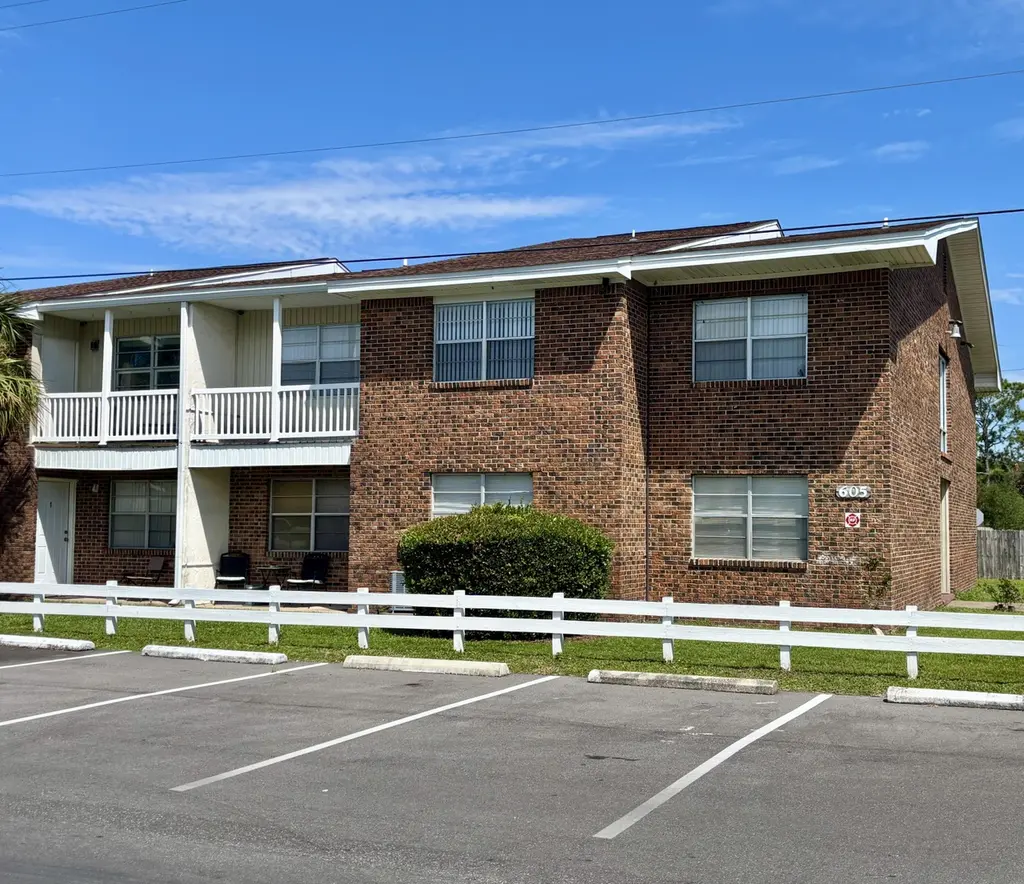
605 Colonial Dr #2 · Wright, FL
Flood risk No data
- FEMA flood zone
- —
- Chance of flooding over 30 yrs
- —
- Est. flood insurance / yr
- —
Fire risk No data
- Est. fire insurance / yr
- —
Heat risk No data
- Hot days now (above threshold)
- —
- Hot days in 30 yrs
- —
Wind risk No data
- Chance of severe wind over 30 yrs
- —
Air-quality risk No data
- Unhealthy air days now
- —
- Unhealthy air days in 30 yrs
- —
Risk factors via First Street. Map © Google.
Why this score? — see what drove the C- grade
The composite is a weighted blend of 9 inputs, each scored 0–100. Each bar is that input's sub-score; the figure is the points it added to the 100-point composite (weight × sub-score).
- ARV discount +15.0/15.0
- Cash flow +10.8/30.0
- 1% rule +10.0/10.0
- Schools +5.2/10.0
- Livability +4.0/5.0
- DSCR +3.1/10.0
- Rent growth +2.5/5.0
- Condition / age +2.5/5.0
- Appreciation +0.0/10.0
$99,900
🖨 Deal sheet 📄 Offer letter ✓ Due diligence
Listing remarks MLS
lowest-price 2Br/2Ba in the market! . .. split bedroom floorplan . .. DIY option -- choose your own interior materials and colors . .. Ask about a seller-to-buyer $10,000 remodel allowance . .. Fair Oaks Village is conveniently located betwixt Beal Parkway and Racetrack Road and Eglin Parkway . .. convenient to Wright Elementary and Pryor Middle School and Choctawhatchee High School . .. Pool: enjoy the pool . .. Beach: 10-minute drive to the Okaloosa Island beach
Key facts
- Conveniently located
- $604 HOA
- Community pool
Tags
Neighborhood map
What this means for you Summary
Snapshot
- This is a 2-bed/2.0-bath condo listed at $100k.
Deal economics
- At list price, monthly cash flow is $-46 ($-548/yr) — negative.
- To cash-flow at today's rent, offer at most $92k (8.1% below list).
- Meets the 1% rule at list price ($2k rent vs $100k).
- Recommended offer: $88k (12.0% below list) — sets the bar for market timing.
- Cap rate 5.7% vs local median 4.2% in Wright — top-decile yield for the area; either an underpriced asset or a hidden risk that comps aren't pricing in. Stress-test before assuming the spread holds.
Location & tenants
- Location reads 80/100 on livability (#117 in FL, #1,790 nationally) — a professional / high-income tenant draw. Strengths: commute A+, cost of living A+, housing A+; Watch: schools D, amenities F.
- Okaloosa (other): math 60% / reading 60% proficiency, ranked #12 of 73 in FL (top 16%) — acceptable for families but not a draw, mixed tenant base, ~2y average lease.
- Market conditions: Rents soft (-0.1%/yr); 224 active listings in the ZIP; 40 comparable units currently listed for rent nearby; rentals lingering (median 44d on market — plan ~5-8 weeks vacancy on turnover, expect pricing pressure); 55% of comp listings sitting > 30 days — soft ceiling on asking rent; 1,268 units permitted in Okaloosa County in 2024 (175 in 5+ unit buildings).
Forward outlook
- Local home prices are declining (-3.0%/yr); year-one equity from $691 of loan paydown is wiped out by about $3k of value loss. Plan a longer hold.
- Okaloosa County population projected at +37% by 2050 — long-run rental-demand tailwind backs the buy-and-hold thesis.
Negotiation context
- It's been on market 264 days — a 12% lower offer ($88k) is reasonable based on typical stale-listing flexibility.
- 2 sale attempts since 18y ago with the ask held roughly flat each time — persistent listings suggest the price (not the market) is what's stuck; bring a comps-based counter.
- Current owner paid $64k; list at $100k implies a 56% gain — meaningful room to come down on a strong offer.
Risks & watch-outs
- Watch-outs: HOA is 39% of rent.
Questions for the listing agent
- What do current leases actually rent for vs. the listed asking? Can we see a recent rent roll and the last 12 months of T-12 income?
- It's been on market 264 days. Have you received any prior offers? Is the seller open to a 12% concession, seller financing, or rate buy-down credit?
- Built in 1975 — when were the roof, HVAC, electrical panel, plumbing, and water heater last replaced?
- What does the HOA fee cover, when was the last increase, and are there any pending special assessments or reserve-fund shortfalls?
- Any open or pending special assessments — roof, HVAC, plumbing, elevator, façade? What's the per-unit balance and payoff schedule, and is the seller paying it off at close or rolling it to the buyer?
- Why hasn't it sold? Are there any deal-killer items the seller is aware of (foundation, flood, title, zoning, code violations)?
- Is there a deadline driving the sale (1031 exchange, divorce, estate, relocation)? That informs how much negotiation room exists.
- Schools are D-rated, which usually means shorter tenancies and higher turnover. Who's the typical renter profile here, and what's been the actual vacancy rate?
- What's the average days-on-market for RENTAL listings here right now (not sales)? A rising rental-DOM trend means longer vacancies and softer asking-rent achievability than the comps imply.
- What's the recent tenant-quality profile in this submarket — average credit score on applications, eviction rate, late-payment / NSF rate, and stable-employment percentage? A property-management company in the area should have these aggregated.
- How much new apartment / multifamily construction is in the pipeline within 1–3 miles? Heavy new supply (>2% of stock underway) typically softens rents 12–24 months out; light construction supports rent growth.
Investment metrics
- 1% rule
- 1.53% ✓
- Cap rate
- 5.74%
- Cash-on-cash
- -1.96%
- DSCR
- 0.91
- GRM
- 5.4
CMA / ARV
- ARV (median comp)
- $135,265
- List price
- $99,900
- Delta
- -26.14%
- Verdict
- UNDERPRICED
- Comps
- 20 within 1.0 mi
Projected returns pro-forma
-3.0% appreciation · 0.0% rent growth · sell at horizon
- IRR
- -25.7%
- Equity multiple
- 0.17×
- Total profit
- $-23,216
- Equity at exit
- $14,895
- IRR
- -60.8%
- Equity multiple
- -0.42×
- Total profit
- $-39,799
- Equity at exit
- $8,638
Cash invested: $27,972 (down + closing). Projections, not guarantees.
Landlord ↔ Tenant lean methodology
- Overall (STATE)
- 87 Strongly Landlord-Friendly
- State Florida
- 87 Strongly Landlord-Friendly · R+3
- County
- — inherits STATE
- City
- — inherits STATE
ZIP-level market 32547
- Home prices YoY
- -29.3%
- Rents YoY
- -0.1%
- Active inventory
- 224
- Price-to-rent
- 5.4×
Monthly cashflow live
- Estimated rent
- $1,531 high interval (Pro) →
- Mortgage (P&I)
- −$524
- Tax from tax record
- −$86 /mo · $1,028/yr
- Insurance
- −$42
- HOA
- −$604
- Vacancy / Maint / Mgmt
- −$321
- Net cashflow
- $-46
Break-even live
UW: 25.0% down · 7.5% · 30yr · 1.5% tax · 5.0% vac · 8.0% maint · 8.0% mgmt
Financing live
Cash to close
- Down payment
- $24,975
- Closing costs
- $2,997
- Reserves months
- —
- Total cash needed
- —
Loan-product check · same deal, 3 products live
Conventional
25% down · 7.5% · 30yr
- Down + closing
- —
- Monthly P&I
- —
- Monthly cashflow
- —
- DSCR
- —
- Eligible?
- —
Personal DTI + credit; lowest rate.
DSCR
20% down · 8.5% · 30yr
- Down + closing
- —
- Monthly P&I
- —
- Monthly cashflow
- —
- DSCR
- —
- Eligible?
- —
No personal income docs; deal must DSCR.
Hard money
10% down · 12.0% · 12mo
- Down + closing
- —
- Monthly P&I
- —
- Monthly cashflow
- —
- DSCR
- —
- Eligible?
- —
Short-term bridge; refi at stabilization.
Rent comps 40 comps
| Address | Beds | Baths | Sqft | Rent | $/sqft | DOM | Units | Dist |
|---|---|---|---|---|---|---|---|---|
| 604 Colonial Dr Fort Walton Beach, FL | 1.0–2.0 | 1.0–2.0 | 818 | $1,624 | $1.99 | 43d | 1 | 0.04mi |
| 696 Tyner St #41 Fort Walton Beach, FL | 2.0 | 1.5 | 960 | $1,550 | $1.61 | 13d | 1 | 0.21mi |
| 321 Woodrow St NE Fort Walton Beach, FL | 1.0–3.0 | 1.0–2.0 | 1017 | $1,488 | $1.46 | 13d | 6 | 0.30mi |
| 517 Scott Ln Fort Walton Beach, FL | 3.0 | 2.0 | 980 | $1,595 | $1.63 | 43d | 1 | 0.32mi |
| 709 Greenwood St Unit B Fort Walton Beach, FL | 2.0 | 1.0 | 800 | $1,200 | $1.50 | 20d | 1 | 0.39mi |
| 709 Greenwood St Fort Walton Beach, FL | 2.0 | 1.0 | 800 | $1,200 | $1.50 | 13d | 1 | 0.39mi |
| 790 Navy St Fort Walton Beach, FL | 2.0 | 1.0 | 900 | $1,300 | $1.44 | 13d | 1 | 0.40mi |
| 800 Denton Blvd NW Fort Walton Beach, FL | 2.0 | 1.0 | 1000 | $1,600 | $1.60 | 13d | 1 | 0.42mi |
| 794 Navy St Fort Walton Beach, FL | 2.0 | 1.0 | 840 | $1,200 | $1.43 | 20d | 1 | 0.42mi |
| 337 Lewis St Unit F Fort Walton Beach, FL | 2.0 | 1.0 | 864 | $1,225 | $1.42 | 43d | 1 | 0.61mi |
| 712 Newport Dr Fort Walton Beach, FL | 3.0 | 1.0 | 1100 | $1,650 | $1.50 | 43d | 1 | 0.69mi |
| 320 Clifford St Fort Walton Beach, FL | 1.0 | 1.0 | 600 | $1,150 | $1.92 | 43d | 1 | 0.75mi |
| 607 W Sunset Blvd Unit B Fort Walton Beach, FL | 2.0 | 1.0 | 840 | $1,600 | $1.90 | 20d | 1 | 0.77mi |
| 1022 Rockport Dr Fort Walton Beach, FL | 2.0 | 2.0 | 864 | $1,500 | $1.74 | 20d | 1 | 0.88mi |
| 201 Taylor St Fort Walton Beach, FL | 1.0 | 1.0 | 800 | $1,200 | $1.50 | 43d | 1 | 0.89mi |
| 201 Taylor St Unit 12 Fort Walton Beach, FL | 1.0 | 1.0 | 650 | $1,150 | $1.77 | 43d | 1 | 0.89mi |
| 204 Davenport Rd Unit 15 Fort Walton Beach, FL | 2.0 | 1.0 | 800 | $1,200 | $1.50 | 43d | 1 | 0.93mi |
| 303 South Ave Unit 1 Fort Walton Beach, FL | 2.0 | 1.0 | 750 | $1,350 | $1.80 | 43d | 1 | 0.97mi |
| 210 Pelham Rd Fort Walton Beach, FL | 1.0–2.0 | 1.0 | 809 | $1,500 | $1.85 | 13d | 2 | 0.97mi |
| 943 Central Ave Unit C Fort Walton Beach, FL | 1.0 | 1.0 | 750 | $1,200 | $1.60 | 43d | 1 | 0.99mi |
| 211 Tooke St Apt C Fort Walton Beach, FL | 1.0 | 1.0 | 700 | $1,200 | $1.71 | 43d | 1 | 0.99mi |
| 914 Barrow St Unit 1 Fort Walton Beach, FL | 1.0 | 1.0 | 800 | $1,300 | $1.62 | 13d | 1 | 1.00mi |
| 936-938 Barrow St Fort Walton Beach, FL | 1.0 | 1.0 | 800 | $1,200 | $1.50 | 43d | 1 | 1.00mi |
| 910 Barrow St Unit 7 Fort Walton Beach, FL | 2.0 | 2.0 | 1020 | $1,500 | $1.47 | 13d | 1 | 1.00mi |
| 940 Barrow St Unit 7 Fort Walton Beach, FL | 1.0 | 1.0 | 800 | $1,200 | $1.50 | 43d | 1 | 1.00mi |
| 936 Barrow St Unit 5 Fort Walton Beach, FL | 2.0 | 2.0 | 1020 | $1,500 | $1.47 | 43d | 1 | 1.01mi |
| 912 Barrow St Unit 10 Fort Walton Beach, FL | 1.0 | 1.0 | 800 | $1,300 | $1.62 | 13d | 1 | 1.01mi |
| 433 Bear Rd Unit B Fort Walton Beach, FL | 2.0 | 1.0 | 782 | $1,200 | $1.53 | 43d | 1 | 1.07mi |
| 772 Rockport Ct Unit 4 Fort Walton Beach, FL | 1.0 | 1.0 | 900 | $1,200 | $1.33 | 43d | 1 | 1.10mi |
| 770 Rockport Ct Unit 2 Fort Walton Beach, FL | 1.0 | 1.0 | 900 | $1,200 | $1.33 | 43d | 1 | 1.11mi |
| 805 Hayley Marie Ct Fort Walton Beach, FL | 2.0 | 2.0 | 1095 | $1,650 | $1.51 | 43d | 1 | 1.19mi |
| 706 Shady Lane Dr Unit D Fort Walton Beach, FL | 2.0 | 1.0 | 900 | $1,650 | $1.83 | 20d | 1 | 1.19mi |
| 706 Shady Lane Dr Unit D Fort Walton Beach, FL | 2.0 | 1.0 | 900 | $1,650 | $1.83 | 13d | 1 | 1.19mi |
| 706 Shady Lane Dr Unit B Fort Walton Beach, FL | 2.0 | 1.0 | 900 | $1,680 | $1.87 | 43d | 1 | 1.19mi |
| 706 Shady Lane Dr Unit C Fort Walton Beach, FL | 2.0 | 1.0 | 900 | $1,600 | $1.78 | 13d | 1 | 1.19mi |
| 146 Alabama Ave NW Unit B Fort Walton Beach, FL | 1.0 | 1.0 | 750 | $1,250 | $1.67 | 43d | 1 | 1.25mi |
| 1863 Norwood Ct Unit 4 Fort Walton Beach, FL | 2.0 | 2.0 | 960 | $1,350 | $1.41 | 43d | 1 | 1.25mi |
| 402 Marshall Ct NW #6 Fort Walton Beach, FL | 2.0 | 2.0 | 1050 | $1,500 | $1.43 | 20d | 1 | 1.26mi |
| 2813 Bradford Pl NW Unit 2 Fort Walton Beach, FL | 2.0 | 2.0 | 928 | $1,300 | $1.40 | 13d | 1 | 1.27mi |
| 405 Marshall Ct Fort Walton Beach, FL | 2.0 | 2.0 | 1000 | $1,495 | $1.50 | 43d | 1 | 1.27mi |
HOA detail condo
- Monthly dues
- $604 · $7,248/yr
- Likely covers
- pool
- Assessments
- None detected in remarks — confirm with the listing agent.
Listing history 19 events
-
2026-06-18days on market $99,900 Active 264 DOM
-
2026-06-17days on market $99,900 Active 263 DOM
-
2026-06-16days on market $99,900 Active 262 DOM
-
2026-06-15days on market $99,900 Active 261 DOM
-
2026-06-14days on market $99,900 Active 259 DOM
-
2026-06-13days on market $99,900 Active 258 DOM
-
2026-06-10days on market $99,900 Active 256 DOM
-
2026-06-09days on market $99,900 Active 255 DOM
-
2026-06-08days on market $99,900 Active 254 DOM
-
2026-06-07days on market $99,900 Active 253 DOM
-
2026-06-05days on market $99,900 Active 250 DOM
-
2026-06-02days on market $99,900 Active 248 DOM
-
2026-06-01days on market $99,900 Active 247 DOM
-
2026-05-31days on market $99,900 Active 246 DOM
-
2026-05-30days on market $99,900 Active 245 DOM
-
2025-09-26$99,900 Active 468-char remark
Show marketing remark (468 chars)
lowest-price 2Br/2Ba in the market! . .. split bedroom floorplan . .. DIY option -- choose your own interior materials and colors . .. Ask about a seller-to-buyer $10,000 remodel allowance . .. Fair Oaks Village is conveniently located betwixt Beal Parkway and Racetrack Road and Eglin Parkway . .. convenient to Wright Elementary and Pryor Middle School and Choctawhatchee High School . .. Pool: enjoy the pool . .. Beach: 10-minute drive to the Okaloosa Island beach
-
2008-11-19$79,000
-
1999-01-05soldstatus $64,000
-
1984-11-01soldstatus $39,500
ⓘ Source: listings_history table (triggers on properties + properties_extension) + one-shot
backfill from property_details.listing_events for pre-trigger history.
Tax reassessment forecast FL · Resets to sale price
- Current annual tax
- $1,028 · $86/mo
- Projected year-2 tax
- $1,028 · $86/mo
- Expected delta
- $0/yr ($0/mo · 0.0%)
ⓘ Screening estimate from a state-policy table — verify with the county assessor before closing.
Nearby sold comps map
Loading sold comps map…
Walkable amenities ~0.75 mi
Loading nearby amenities…
Taxation est. · year 1
- Rental income
- $18,371
- − Mortgage interest
- −$5,596
- − Property taxes
- −$1,028
- − Insurance
- −$500
- − Repairs & maintenance
- −$1,470
- − Management
- −$1,470
- − HOA
- −$7,248
- − Depreciation
- −$2,906
- Taxable loss
- −$1,845
- Est. tax savings @ 24.0%
- +$443
- After-tax cash flow
- $-106/yr
For passive investors: Depreciation is non-cash, so a rental often shows a tax loss while cash-flowing — sheltering income. Rental losses are passive: they offset passive income freely, and up to $25,000/yr can offset ordinary (W-2) income if you actively participate and your MAGI is under $100k (phasing out to $0 by $150k); unused losses carry forward. On sale, claimed depreciation is recaptured at up to 25%, and gains may owe capital-gains tax (a 1031 exchange can defer both). Figures are a year-1 estimate at your 24.0% rate — not tax advice; consult a CPA.
Schools (NCES district)
- District
- Okaloosa
- NCES district ID
- 1201380
- Math proficiency
- 60% ▼ -12.00%
- Reading proficiency
- 60% ▼ -4.00%
- Median HH income
- $55,601
- Composite
- 51.62/100
- National rank
- #1705
- State rank
- #12 of 73 in FL
Livability — Wright
- Score
- 80/100
- State rank
- #117
- US rank
- #1790
Category grades
Schools grade is shown separately in the Schools card above.
Census & demographics
- Census place
- Wright, FL
- County
- Okaloosa County · 194,352 people
- City population
- 35,522
- Metro
- Crestview-Fort Walton Beach-Destin, FL
- Population (ZIP)
- 35,527
- Household income
- $70,711
- Rent vs Own
- Severe rent burden
- 1203.0
Population outlook (Okaloosa County) Hauer SSP2
- Today (2025)
- 235,133 people
- By 2030
- 253,483 · +7.8%
- By 2040
- 289,537 · +23.1%
- By 2050
- 322,954 · +37.3%
- By 2075
- 399,624 · +70.0%
- By 2100
- 425,311 · +80.9%
Race, ethnicity, and origin ACS 2023
- Neighborhood character
- Diverse neighborhood (Simpson 0.60)
- Race & ethnicity
- White 59% Hispanic / Latino 19% Two or more races 14% Black 11% Asian 3%
- Hispanic origin (detail)
- Mexican 5% Puerto Rican 3% Dominican 1%
- Common ancestry
- Slovak 2% Lithuanian 2% Scotch-Irish 2%
- Foreign-born
- 15% · Canada, Vietnam, Jamaica
- Languages at home
- 81% English-only · Spanish 14% Other Indo-European 1% Vietnamese 1%
Political lean MEDSL · Okaloosa
- 2024 margin
- Solid R (+42.4) · D 28.2% · R 70.7% · Other 1.1%
- 2008→2024 swing
- +2.5pp toward D · 2008: -44.9pp · 2024: -42.4pp
- All cycles
- 2024: R+42.4 2020: R+39.1 2016: R+47.8 2012: R+49.4 2008: R+44.9
Not yet ingested
- Civics
- —
Market trends
- HPI YoY
- ▼ -111.28%
- Current HPI
- 268.6497
- Rent YoY
- ▼ -0.13%
- Metro
- Crestview-Fort Walton Beach-Destin, FL
- State GDP YoY
- ▲ 3.28%
- F500 in state
- 36
Industry mix (Fortune 500 HQ in FL)
| Industry | F500 HQs | Revenue |
|---|---|---|
| Industrial Technology | 2 | $29B |
|
||
| Insurance | 2 | $17B |
|
||
| Retail | 1 | $60B |
|
||
| Technology Distribution | 1 | $58B |
|
||
| Homebuilding | 1 | $35B |
|
||
| Technology Manufacturing | 1 | $35B |
|
||
Price history
+152.9% since first listed4 events — show timeline
- 2025-09-26 Listed $99,900 ECAR
- 2008-11-19 Listed $79,000 ECAR
- 1999-01-05 Sold (Public Records) $64,000 Public Records
- 1984-11-01 Sold (Public Records) $39,500 Public Records
Property tax history
+7.2%/yrLatest (2025): $1,028 · +4.1% YoY. Source: county tax records.
Cash-flow waterfall
monthlySold comps — $/sqft
last 12 mo · ≤1 miLoading sold comps…