 Duplex
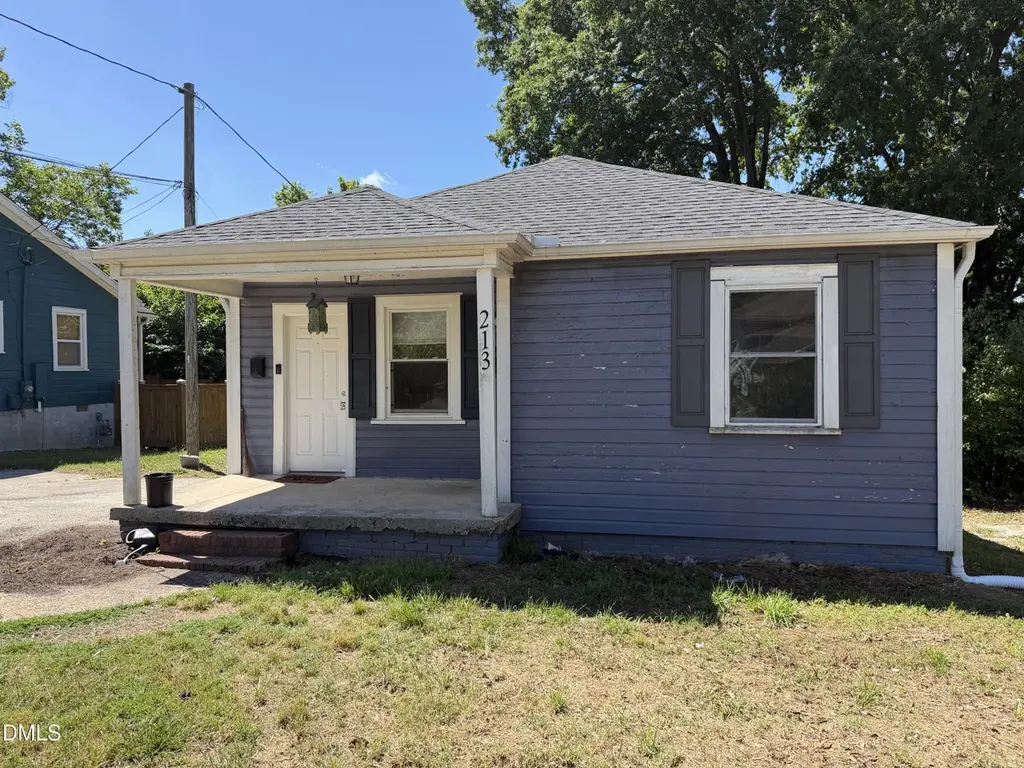
213 Hargrove St · Durham, NC
Flood risk 1/10 · Minimal
- FEMA flood zone
- X (unshaded)
- Chance of flooding over 30 yrs
- 0.0%
- Est. flood insurance / yr
- $507 – $1,088
Fire risk 1/10 · Minimal
- Est. fire insurance / yr
- $906 – $1,684
Heat risk 6/10 · Moderate
- Hot days now (above 105°F)
- 7 days/yr
- Hot days in 30 yrs
- 16 days/yr
Wind risk 6/10 · Moderate
- Chance of severe wind over 30 yrs
- 27.0%
Air-quality risk 2/10 · Minimal
- Unhealthy air days now
- 1 days/yr
- Unhealthy air days in 30 yrs
- 1 days/yr
Risk factors via First Street. Map © Google.
Why this score? — see what drove the D+ grade
The composite is a weighted blend of 9 inputs, each scored 0–100. Each bar is that input's sub-score; the figure is the points it added to the 100-point composite (weight × sub-score).
- Cash flow +17.5/30.0
- ARV discount +7.5/15.0
- DSCR +5.5/10.0
- 1% rule +4.5/10.0
- Livability +4.0/5.0
- Rent growth +3.3/5.0
- Schools +3.0/10.0
- Condition / age +2.5/5.0
- Appreciation +0.0/10.0
$365,000
🖨 Deal sheet 📄 Offer letter ✓ Due diligence
Multi-family units
County records classify this as Multi-Family (2-4 Unit). Listing-text estimate: 2 units. confirmed
Listing remarks
Duplex at 213 Hargrove Street in Downtown Durham. The property has 1-bed and 1-bath units of approximately 560 SF and 675 SF respectively. Both units feature recently updated interiors including LVP flooring, new countertops, stainless steel appliances and updated fixtures. One unit is currently vacant, providing immediate upside through and lease-up to market rents. This vacancy also presents an attractive opportunity for an owner-occupant seeking to live in one unit while generating income from the other. The rented unit (left-side) is M-to-M at $990. Owner pays water. Located across from the Bay-Hargrove Park, the property offers walkable access to Downtown Durham's premier dining, retai
Key facts
- Updated interiors
- Lvp flooring
- New countertops
Tags
Property features AI
Finance
- Other: Building area approximately 1,235
- Financial info: 4 total units on the property; Owner pays water and sewer
- HOA & community: No association
Exterior
- Parking: Driveway with 2 open parking spaces
- Utilities: Public water; Public sewer
- Home design: Duplex; One story
- Construction: Wood siding construction; Built as a duplex
- Exterior features: Shingle roof; Lot approximately 0.12 acres; Zoned R-5; Publicly maintained road access
Interior
- Bedrooms: 2 bedrooms
- Flooring: Luxury vinyl; Tile; Vinyl
- Bathrooms: 2 full bathrooms
- Heating & cooling: Central heating; Central air conditioning
- Interior features: Luxury vinyl, tile, and vinyl flooring
Neighborhood map
What this means for you Summary
Snapshot
- This is a 2 × 1-bed/1-bath units multifamily listed at $365k.
Deal economics
- At list price, monthly cash flow is $280 ($3k/yr) — positive. Per door: $140/mo.
- The deal already cash-flows at list — no discount required.
- To meet the 1% rule (rent ≥ 1% of price), the offer needs to be $345k (5.5% below list).
- Recommended offer: $345k (5.5% below list) — sets the bar for 1% rule.
- Cap rate 7.2% vs local median 3.0% in Durham — top-decile yield for the area; either an underpriced asset or a hidden risk that comps aren't pricing in. Stress-test before assuming the spread holds.
Location & tenants
- Location reads 81/100 on livability (#15 in NC, #1,411 nationally) — a professional / high-income tenant draw. Strengths: amenities A+, commute A+, housing A+; Watch: schools D+, crime F.
- Durham Public Schools (urban): math 29% / reading 39% proficiency, ranked #132 of 178 in NC (top 74%) — families likely to look elsewhere, expect single-tenant / working-renter base with shorter leases.
- Market conditions: Rents rising (+3.2%/yr); 197 active listings in the ZIP; 40 comparable units currently listed for rent nearby; rentals leasing fast (median 14d on market — plan ~1-2 weeks tenant-placement turnaround); 2,905 units permitted in Durham County in 2024 (955 in 5+ unit buildings).
- At $3,451/mo this rent would consume 59% of the median local household income ($70k/yr) (locally 1402% of renters already pay >50% of income on rent) — very limited rent-growth headroom before tenants either downsize or default.
Forward outlook
- Local home prices are declining (-3.0%/yr); year-one equity from $3k of loan paydown is wiped out by about $11k of value loss. Plan a longer hold.
- Durham County population projected at +44% by 2050 — long-run rental-demand tailwind backs the buy-and-hold thesis.
Negotiation context
- It's been on market 34 days — a 3% lower offer ($354k) is reasonable based on typical stale-listing flexibility.
- Current owner paid $15k; list at $365k implies a 2333% gain — meaningful room to come down on a strong offer.
Risks & watch-outs
- Watch-outs: built in 1938 — expect roof / HVAC / electrical / plumbing capex.
- Climate carrying-cost: major wind risk, 27% chance of damaging wind over 30y; extreme-heat days projected 7→16/yr by 2055 (HVAC capex compounding) — expect insurance premiums to compound above CPI over the hold.
Questions for the listing agent
- It's been on market 34 days. Have you received any prior offers? Is the seller open to a 5% concession, seller financing, or rate buy-down credit?
- Can we see the unit-by-unit rent roll, current vacancy, and any below-market leases? What's the average tenancy length?
- What capital expenditures (roof, boiler, parking lot, exteriors) have been made in the last 5 years, and what's planned in the next 2?
- Built in 1938 — when were the roof, HVAC, electrical panel, plumbing, and water heater last replaced?
- Is there a deadline driving the sale (1031 exchange, divorce, estate, relocation)? That informs how much negotiation room exists.
- Schools are D-rated, which usually means shorter tenancies and higher turnover. Who's the typical renter profile here, and what's been the actual vacancy rate?
- Crime grade is F in this area — have there been break-ins, vandalism, or insurance claims at this property in the last 3 years? What carrier currently insures it and at what premium?
- The area grade is low — what's the realistic commute time and amenity access for the typical tenant pool here? Any planned neighborhood developments (good or bad) we should know about?
- What's the average days-on-market for RENTAL listings here right now (not sales)? A rising rental-DOM trend means longer vacancies and softer asking-rent achievability than the comps imply.
- What's the recent tenant-quality profile in this submarket — average credit score on applications, eviction rate, late-payment / NSF rate, and stable-employment percentage? A property-management company in the area should have these aggregated.
- How much new apartment / multifamily construction is in the pipeline within 1–3 miles? Heavy new supply (>2% of stock underway) typically softens rents 12–24 months out; light construction supports rent growth.
Investment metrics
- 1% rule
- 0.95% ✗
- Cap rate
- 7.21%
- Cash-on-cash
- 3.28%
- DSCR
- 1.15
- GRM
- 8.8
CMA / ARV
- ARV (on-the-fly)
- $224,724
- Comps found
- 1
Show comp detail 1 sale within ~0.75 mi
| Address | Dist | Beds/Ba | Sqft | Sold | Price | $/sf | Match |
|---|---|---|---|---|---|---|---|
| 1406 Manteo St | 0.74mi | 2/2.0 | 1,368 (+11%) | 23mo | $250,000 | $183 | 27 |
Match score weights: distance 35% · size 25% · config 20% · recency 20%. Top-matched comps best support the ARV.
Projected returns pro-forma
-3.0% appreciation · 3.25% rent growth · sell at horizon
- IRR
- -10.9%
- Equity multiple
- 0.60×
- Total profit
- $-40,466
- Equity at exit
- $54,423
- IRR
- -1.2%
- Equity multiple
- 0.91×
- Total profit
- $-8,700
- Equity at exit
- $31,559
Cash invested: $102,200 (down + closing). Projections, not guarantees.
Landlord ↔ Tenant lean methodology
- Overall (STATE)
- 85 Strongly Landlord-Friendly
- State North Carolina
- 85 Strongly Landlord-Friendly · R+3
- County
- — inherits STATE
- City
- — inherits STATE
ZIP-level market 27701
- Rents YoY
- 3.2%
- Active inventory
- 197
- Price-to-rent
- 17.6×
Monthly cashflow live
- Estimated rent
- $3,451 high interval (Pro) →
- Mortgage (P&I)
- −$1,914
- Tax from tax record
- −$381 /mo · $4,567/yr
- Insurance
- −$152
- HOA
- −$0
- Vacancy / Maint / Mgmt
- −$725
- Net cashflow
- $280
Break-even live
2-unit breakdown (identical units grouped — click to expand)
| Units | Beds | Baths | Est. rent |
|---|---|---|---|
| 2× units | 1 | 1 | $3,452 |
| #1 | 1 | 1 | $1,726 |
| #2 | 1 | 1 | $1,726 |
| Total (2 units) | $3,451 | ||
UW: 25.0% down · 7.5% · 30yr · 1.5% tax · 5.0% vac · 8.0% maint · 8.0% mgmt
Financing live
Cash to close
- Down payment
- $91,250
- Closing costs
- $10,950
- Reserves months
- —
- Total cash needed
- —
Loan-product check · same deal, 3 products live
Conventional
25% down · 7.5% · 30yr
- Down + closing
- —
- Monthly P&I
- —
- Monthly cashflow
- —
- DSCR
- —
- Eligible?
- —
Personal DTI + credit; lowest rate.
DSCR
20% down · 8.5% · 30yr
- Down + closing
- —
- Monthly P&I
- —
- Monthly cashflow
- —
- DSCR
- —
- Eligible?
- —
No personal income docs; deal must DSCR.
Hard money
10% down · 12.0% · 12mo
- Down + closing
- —
- Monthly P&I
- —
- Monthly cashflow
- —
- DSCR
- —
- Eligible?
- —
Short-term bridge; refi at stabilization.
Rent comps 40 comps
| Address | Beds | Baths | Sqft | Rent | $/sqft | DOM | Units | Dist |
|---|---|---|---|---|---|---|---|---|
| 200 W Geer St Unit 200-C Durham, NC | 2.0 | 1.0 | 850 | $1,400 | $1.65 | 13d | 1 | 0.04mi |
| 815 Madison St Durham, NC | 2.0 | 1.0–2.0 | 859 | $2,854 | $3.32 | 21d | 5 | 0.15mi |
| 318 W Corporation St Durham, NC | 3.0 | 1.0–2.0 | 900 | $2,934 | $3.26 | 13d | 55 | 0.19mi |
| 311 W Corporation St Durham, NC | 2.0 | 1.0–2.0 | 691 | $3,505 | $5.07 | 21d | 5 | 0.19mi |
| 311 W Corporation St Unit 3-201 Durham, NC | 2.0 | 2.0 | 985 | $3,355 | $3.41 | 23d | 1 | 0.19mi |
| 620 Foster St Durham, NC | 2.0 | 1.0–2.0 | 888 | $3,303 | $3.72 | 13d | 43 | 0.21mi |
| 321 W Corporation St Durham, NC | 2.0 | 2.0 | 977 | $2,530 | $2.59 | 13d | 1 | 0.21mi |
| 620 Foster St Unit 443 Durham, NC | 2.0 | 2.0 | 1243 | $2,918 | $2.35 | 23d | 1 | 0.21mi |
| 620 Foster St Unit 543 Durham, NC | 2.0 | 2.0 | 1243 | $2,853 | $2.30 | 13d | 1 | 0.21mi |
| 530 Foster St Durham, NC | 2.0 | 1.0–2.0 | 918 | $2,750 | $3.00 | 13d | 18 | 0.31mi |
| 545 Foster St Durham, NC | 2.0 | 1.0–2.0 | 910 | $2,722 | $2.99 | 13d | 2 | 0.32mi |
| 208 Gray Ave Apt 4H Durham, NC | 2.0 | 1.0 | 800 | $1,250 | $1.56 | 23d | 1 | 0.34mi |
| 701 Washington St Durham, NC | 1.0–3.0 | 1.0–2.0 | 996 | $3,338 | $3.35 | 13d | 214 | 0.37mi |
| 311 Liggett St Durham, NC | 2.0 | 1.0–2.0 | 1008 | $4,525 | $4.49 | 13d | 11 | 0.48mi |
| 406 Green St Durham, NC | 2.0 | 1.0 | 912 | $1,990 | $2.18 | 23d | 1 | 0.49mi |
| 607 Dowd St Durham, NC | 2.0 | 1.0 | 720 | $1,550 | $2.15 | 23d | 1 | 0.55mi |
| 1000 N Duke St Durham, NC | 2.0 | 1.5 | 1080 | $1,595 | $1.48 | 23d | 1 | 0.57mi |
| 506 Gurley St Unit A Durham, NC | 2.0 | 1.0 | 775 | $1,300 | $1.68 | 13d | 1 | 0.57mi |
| 334 Clark St Unit A Durham, NC | 2.0 | 1.0 | 796 | $1,150 | $1.44 | 23d | 1 | 0.57mi |
| 115 Morris St #1908 Durham, NC | 1.0 | 1.0 | 750 | $2,600 | $3.47 | 23d | 1 | 0.59mi |
| 115 Morris St Durham, NC | 1.0–2.0 | 1.0–2.0 | 1066 | $7,661 | $7.18 | 13d | 76 | 0.61mi |
| 110 N Corcoran St Durham, NC | 1.0–2.0 | 1.0–2.0 | 1219 | $4,594 | $3.77 | 13d | 8 | 0.62mi |
| 1600 N Alston Ave Unit C Durham, NC | 2.0 | 1.0 | 800 | $1,150 | $1.44 | 13d | 1 | 0.64mi |
| 109 W Main St #402 Durham, NC | 2.0 | 1.5 | 1296 | $2,695 | $2.08 | 23d | 1 | 0.65mi |
| 800 Demerius St Durham, NC | 2.0 | 1.0 | 715 | $1,445 | $2.02 | 23d | 1 | 0.67mi |
| 809 Lee St Durham, NC | 1.0 | 1.0 | 1370 | $580 | $0.42 | 13d | 1 | 0.68mi |
| 809A Lee St Durham, NC | 1.0 | 1.0 | 1370 | $714 | $0.52 | 23d | 1 | 0.68mi |
| 605 W Main St Durham, NC | 3.0 | 1.0–2.0 | 977 | $2,837 | $2.90 | 13d | 48 | 0.71mi |
| 1005 W Main St Durham, NC | 1.0 | 1.0 | 909 | $2,179 | $2.40 | 23d | 1 | 0.80mi |
| 501 Willard St Durham, NC | 2.0 | 1.0–2.0 | 817 | $2,204 | $2.70 | 13d | 26 | 0.83mi |
| 500 E Main St Durham, NC | 3.0 | 1.0–2.0 | 1002 | $2,920 | $2.91 | 13d | 40 | 0.87mi |
| 721 Liberty St Unit C Durham, NC | 2.0 | 1.0 | 800 | $1,495 | $1.87 | 23d | 1 | 0.90mi |
| 511 S Mangum St Durham, NC | 3.0 | 1.0–2.0 | 1159 | $3,278 | $2.83 | 13d | 29 | 0.91mi |
| 464 E Pettigrew St Durham, NC | 2.0 | 2.0 | 1091 | $2,786 | $2.55 | 13d | 1 | 0.91mi |
| 600 Willard St Durham, NC | 2.0 | 2.0 | 1480 | $2,625 | $1.77 | 23d | 1 | 0.94mi |
| 605 W Chapel Hill St Durham, NC | 2.0 | 1.0–2.0 | 760 | $2,011 | $2.64 | 13d | 19 | 0.94mi |
| 441 S Dillard St Durham, NC | 1.0–3.0 | 1.0–2.5 | 1153 | $2,454 | $2.13 | 13d | 21 | 0.95mi |
| 1104 Chester St Durham, NC | 1.0 | 1.0 | 1300 | $625 | $0.48 | 23d | 1 | 0.96mi |
| 603 N Elm St Unit A Durham, NC | 3.0 | 2.0 | 1200 | $1,495 | $1.25 | 23d | 1 | 0.97mi |
| 600 S Duke St #14 Durham, NC | 2.0 | 2.0 | 915 | $2,000 | $2.19 | 23d | 1 | 0.98mi |
Listing history 17 events
-
2026-06-18days on market $365,000 Active 34 DOM
-
2026-06-17days on market $365,000 Active 33 DOM
-
2026-06-16days on market $365,000 Active 32 DOM
-
2026-06-15days on market $365,000 Active 31 DOM
-
2026-06-14days on market $365,000 Active 29 DOM
-
2026-06-10days on market $365,000 Active 26 DOM
-
2026-06-09days on market $365,000 Active 25 DOM
-
2026-06-08days on market $365,000 Active 24 DOM
-
2026-06-07days on market $365,000 Active 23 DOM
-
2026-06-05days on market $365,000 Active 20 DOM
-
2026-06-03days on market $365,000 Active 19 DOM
-
2026-06-02days on market $365,000 Active 18 DOM
-
2026-06-01days on market $365,000 Active 17 DOM
-
2026-05-31days on market $365,000 Active 16 DOM
-
2026-05-30days on market $365,000 Active 15 DOM
-
2026-05-15$365,000 Active
-
1995-05-30soldstatus $15,000
ⓘ Source: listings_history table (triggers on properties + properties_extension) + one-shot
backfill from property_details.listing_events for pre-trigger history.
Tax reassessment forecast NC · Resets to sale price
- Current annual tax
- $4,567 · $381/mo
- Projected year-2 tax
- $4,567 · $381/mo
- Expected delta
- $0/yr ($0/mo · 0.0%)
ⓘ Screening estimate from a state-policy table — verify with the county assessor before closing.
Climate risk First Street
- Flood 1/10 Low FEMA zone X (unshaded) · 0% chance over 30 yrs
- Wildfire 1/10 Low
- Heat 6/10 Major 7 d/yr ≥105°F today · 16 d/yr by 30 yrs out
- Wind 6/10 Major 27% chance of damaging wind over 30 yrs
- Air quality 2/10 Low 1 unhealthy d/yr today · 1 by 30 yrs out
Nearby sold comps map
Loading sold comps map…
Walkable amenities ~0.75 mi
Loading nearby amenities…
Taxation est. · year 1
- Rental income
- $41,412
- − Mortgage interest
- −$20,446
- − Property taxes
- −$4,567
- − Insurance
- −$1,825
- − Repairs & maintenance
- −$3,313
- − Management
- −$3,313
- − Depreciation
- −$10,618
- Taxable loss
- −$2,670
- Est. tax savings @ 24.0%
- +$641
- After-tax cash flow
- $3,995/yr
For passive investors: Depreciation is non-cash, so a rental often shows a tax loss while cash-flowing — sheltering income. Rental losses are passive: they offset passive income freely, and up to $25,000/yr can offset ordinary (W-2) income if you actively participate and your MAGI is under $100k (phasing out to $0 by $150k); unused losses carry forward. On sale, claimed depreciation is recaptured at up to 25%, and gains may owe capital-gains tax (a 1031 exchange can defer both). Figures are a year-1 estimate at your 24.0% rate — not tax advice; consult a CPA.
Schools (NCES district)
- District
- Durham Public Schools
- NCES district ID
- 3701260
- Math proficiency
- 29% ▼ -3.00%
- Reading proficiency
- 39% ▲ 2.00%
- Median HH income
- $52,143
- Composite
- 29.69/100
- National rank
- #6457
- State rank
- #132 of 178 in NC
Livability — Durham
- Score
- 81/100
- State rank
- #15
- US rank
- #1411
Category grades
Schools grade is shown separately in the Schools card above.
Census & demographics
- Census place
- Durham, NC
- County
- Durham County · 288,747 people
- City population
- 288,747
- Metro
- Durham-Chapel Hill, NC
- Population (ZIP)
- 24,793
- Household income
- $69,740
- Rent vs Own
- Severe rent burden
- 1402.0
Population outlook (Durham County) Hauer SSP2
- Today (2025)
- 368,962 people
- By 2030
- 402,686 · +9.1%
- By 2040
- 468,677 · +27.0%
- By 2050
- 531,727 · +44.1%
- By 2075
- 660,446 · +79.0%
- By 2100
- 739,971 · +100.6%
Race, ethnicity, and origin ACS 2023
- Neighborhood character
- Diverse neighborhood (Simpson 0.69)
- Race & ethnicity
- White 40% Black 32% Hispanic / Latino 19% Two or more races 9% Asian 3%
- Hispanic origin (detail)
- Mexican 9%
- Common ancestry
- Romanian 2% Italian 2% Slovak 2%
- Foreign-born
- 18% · Canada, Vietnam
- Languages at home
- 76% English-only · Spanish 18% Other Indo-European 2% German/W. Germanic 1%
Political lean MEDSL · Durham
- 2024 margin
- Solid D (+61.9) · D 80.2% · R 18.2% · Other 1.6%
- 2008→2024 swing
- +10.0pp toward D · 2008: 51.9pp · 2024: 61.9pp
- All cycles
- 2024: D+61.9 2020: D+62.4 2016: D+60.4 2012: D+52.7 2008: D+51.9
Not yet ingested
- Civics
- —
Market trends
- HPI YoY
- ▼ -272.19%
- Current HPI
- 347.5371
- Rent YoY
- ▲ 3.25%
- Metro
- Durham-Chapel Hill, NC
- State GDP YoY
- ▲ 3.28%
- F500 in state
- 26
Industry mix (Fortune 500 HQ in NC)
| Industry | F500 HQs | Revenue |
|---|---|---|
| Financial Services | 2 | $213B |
|
||
| Retail | 2 | $95B |
|
||
| Industrial Conglomerate | 1 | $38B |
|
||
| Metals / Steel | 1 | $35B |
|
||
| Utilities | 1 | $30B |
|
||
| Industrial Machinery | 1 | $19B |
|
||
Price history
+2333.3% since first listed2 events — show timeline
- 2026-05-15 Listed $365,000 TMLS
- 1995-05-30 Sold (Public Records) $15,000 Public Records
Property tax history
+15.5%/yrLatest (2025): $4,567 · +156.2% YoY. Source: county tax records.
Cash-flow waterfall
monthlySold comps — $/sqft
last 12 mo · ≤1 miLoading sold comps…