42751 E Florida Ave #161 · Valle Vista, CA
Flood risk 1/10 · Minimal
- FEMA flood zone
- X (unshaded)
- Chance of flooding over 30 yrs
- 0.0%
- Est. flood insurance / yr
- $507 – $1,088
Fire risk 8/10 · Major
- Est. fire insurance / yr
- $659 – $1,223
Heat risk 7/10 · Major
- Hot days now (above 103°F)
- 5 days/yr
- Hot days in 30 yrs
- 15 days/yr
Wind risk 1/10 · Minimal
- Chance of severe wind over 30 yrs
- —
Air-quality risk 6/10 · Moderate
- Unhealthy air days now
- 10 days/yr
- Unhealthy air days in 30 yrs
- 12 days/yr
Risk factors via First Street. Map © Google.
Why this score? — see what drove the B- grade
The composite is a weighted blend of 9 inputs, each scored 0–100. Each bar is that input's sub-score; the figure is the points it added to the 100-point composite (weight × sub-score).
- Cash flow +30.0/30.0
- 1% rule +10.0/10.0
- DSCR +10.0/10.0
- ARV discount +7.9/15.0
- Rent growth +3.7/5.0
- Livability +2.9/5.0
- Schools +2.5/10.0
- Condition / age +2.5/5.0
- Appreciation +0.0/10.0
$63,500
🖨 Deal sheet 📄 Offer letter ✓ Due diligence
Listing remarks
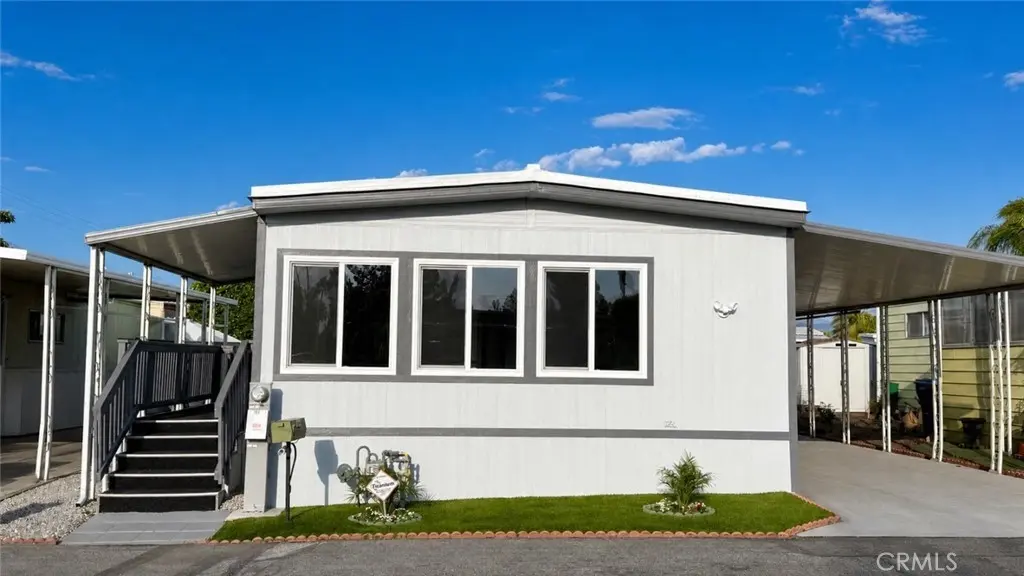
Enjoy affordable living in this well-maintained 2-bedroom, 2-bath manufactured home located in the desirable Arroyo Fairways 55+ senior community. This home is a comfortable layout with spacious living areas and plenty of natural light. Situated within a beautifully maintained park, residents enjoy access to resort-style amenities including an on-site golf course, swimming pool, spa, clubhouse, and a variety of recreational activities. Conveniently located near shopping, dining, and everyday essentials, this home provides both comfort and convenience in a peaceful community setting. A great opportunity to enjoy relaxed, low-maintenance living in a vibrant senior community!
Key facts
- Clubhouse
- Manufactured home
- Spa
Tags
Property features AI
Finance
- Other: Located in a 0-1 unit/acre lot setting
- Financial info: Land lease of $770 per month (park-provided)
- HOA & community: Senior community; Park requires manager approval
Exterior
- Parking: Located in Arroyo Fairways park
- Utilities: Public sewer; District/Public water
- Home design: Single-story mobile home; Mobile home dimensions approximately 20 ft by 48 ft; Mobile home remains on site; Has a view
- Construction: Construction and year built per public records
- Exterior features: Community pool; Sidewalks; Corner location (per directions)
Interior
- Bathrooms: 2 full bathrooms
- Interior features: One-level layout; Entry on the first level; Public records used for living area
- Laundry & utility: Community laundry
Neighborhood map
What this means for you Summary
Snapshot
- This is a 2-bed/2.0-bath manufactured listed at $64k.
Deal economics
- At list price, monthly cash flow is $908 ($11k/yr) — positive.
- The deal already cash-flows at list — no discount required.
- Meets the 1% rule at list price ($2k rent vs $64k).
- Recommended offer: $62k (3.0% below list) — sets the bar for market timing.
- Cap rate 23.5% vs local median 4.3% in Valle Vista — top-decile yield for the area; either an underpriced asset or a hidden risk that comps aren't pricing in. Stress-test before assuming the spread holds.
Location & tenants
- Location reads 57/100 on livability (#739 in CA) — a working-class tenant base; expect higher turnover. Strengths: housing A+; Watch: employment D+, schools F, crime F.
- Hemet Unified (suburban): math 19% / reading 41% proficiency, ranked #360 of 517 in CA (top 70%) — families likely to look elsewhere, expect single-tenant / working-renter base with shorter leases; 66% free/reduced lunch — lower-income household profile, screen leases tightly.
- Market conditions: Rents rising fast (+4.9%/yr); 323 active listings in the ZIP; 19 comparable units currently listed for rent nearby; rentals at typical pace (median 24d on market — plan ~3-4 weeks tenant-placement turnaround); 42% of comp listings sitting > 30 days — soft ceiling on asking rent; 9,195 units permitted in Riverside County in 2024 (1,512 in 5+ unit buildings).
Forward outlook
- Local home prices are declining (-3.0%/yr); year-one equity from $439 of loan paydown is wiped out by about $2k of value loss. Plan a longer hold.
- Riverside County population projected at +22% by 2050 — long-run rental-demand tailwind backs the buy-and-hold thesis.
- At projected returns (-3.0% appreciation + 4.9% rent growth), your $18k cash investment doubles in ~2 years — after that, you're playing with house money.
Negotiation context
- It's been on market 44 days — a 3% lower offer ($62k) is reasonable based on typical stale-listing flexibility.
Risks & watch-outs
- Climate carrying-cost: severe wildfire risk; extreme-heat days projected 5→15/yr by 2055 (HVAC capex compounding) — expect insurance premiums to compound above CPI over the hold.
Questions for the listing agent
- It's been on market 44 days. Have you received any prior offers? Is the seller open to a 3% concession, seller financing, or rate buy-down credit?
- Built in 1970 — when were the roof, HVAC, electrical panel, plumbing, and water heater last replaced?
- Is there a deadline driving the sale (1031 exchange, divorce, estate, relocation)? That informs how much negotiation room exists.
- Schools are F-rated, which usually means shorter tenancies and higher turnover. Who's the typical renter profile here, and what's been the actual vacancy rate?
- Crime grade is F in this area — have there been break-ins, vandalism, or insurance claims at this property in the last 3 years? What carrier currently insures it and at what premium?
- What's the average days-on-market for RENTAL listings here right now (not sales)? A rising rental-DOM trend means longer vacancies and softer asking-rent achievability than the comps imply.
- What's the recent tenant-quality profile in this submarket — average credit score on applications, eviction rate, late-payment / NSF rate, and stable-employment percentage? A property-management company in the area should have these aggregated.
- How much new for-sale + rental construction is in the pipeline within 1–3 miles? Heavy new supply typically softens prices + rents 12–24 months out; constrained supply supports both.
Investment metrics
- 1% rule
- 2.69% ✓
- Cap rate
- 23.46%
- Cash-on-cash
- 61.30%
- DSCR
- 3.73
- GRM
- 3.1
CMA / ARV
- ARV (median comp)
- $64,000
- List price
- $63,500
- Delta
- -0.78%
- Verdict
- FAIR
- Comps
- 13 within 1.0 mi
Show comp detail 8 sales within ~0.75 mi
| Address | Dist | Beds/Ba | Sqft | Sold | Price | $/sf | Match |
|---|---|---|---|---|---|---|---|
| 42751 E Florida Ave #112 | 0.12mi | 2/1.5 | 960 (0%) | 17mo | $85,900 | $89 | 78 |
| 42751 Florida Ave #148 | 0.01mi | 2/1.5 | 880 (-8%) | 9mo | $67,000 | $76 | 76 |
| 42751 E Florida Ave #41 | 0.12mi | 2/2.0 | 1,040 (+8%) | 8mo | $41,600 | $40 | 74 |
| 43531 E Acacia Ave #15 | 0.70mi | 2/2.0 | 960 (0%) | 2mo | $65,000 | $68 | 65 |
| 42751 Florida Ave #18 | 0.01mi | 2/1.0 | 824 (-14%) | 23mo | $61,900 | $75 | 53 |
| 43601 HWY. 74 #12 | 0.62mi | 2/2.0 | 840 (-12%) | 14mo | $98,000 | $117 | 39 |
| 43531 Acacia Ave #16 | 0.71mi | 2/2.0 | 1,060 (+10%) | 18mo | $52,500 | $50 | 34 |
| 43531 Acacia Ave #10 | 0.71mi | 2/2.0 | 1,040 (+8%) | 24mo | $95,000 | $91 | 33 |
Match score weights: distance 35% · size 25% · config 20% · recency 20%. Top-matched comps best support the ARV.
Projected returns pro-forma
-3.0% appreciation · 4.9% rent growth · sell at horizon
- IRR
- 62.3%
- Equity multiple
- 3.86×
- Total profit
- $50,907
- Equity at exit
- $9,468
- IRR
- 67.5%
- Equity multiple
- 8.49×
- Total profit
- $133,095
- Equity at exit
- $5,490
Cash invested: $17,780 (down + closing). Projections, not guarantees.
Landlord ↔ Tenant lean methodology
- Overall (STATE)
- 18 Strongly Tenant-Friendly
- State California
- 18 Strongly Tenant-Friendly · D+13
- County
- — inherits STATE
- City
- — inherits STATE
ZIP-level market 92544
- Rents YoY
- 4.9%
- Active inventory
- 323
- Price-to-rent
- 3.1×
Monthly cashflow live
- Estimated rent
- $1,705 high interval (Pro) →
- Mortgage (P&I)
- −$333
- Tax est. 1.5%
- −$79 /mo · $952/yr
- Insurance
- −$26
- HOA
- −$0
- Vacancy / Maint / Mgmt
- −$358
- Net cashflow
- $908
Break-even live
UW: 25.0% down · 7.5% · 30yr · 1.5% tax · 5.0% vac · 8.0% maint · 8.0% mgmt
Financing live
Cash to close
- Down payment
- $15,875
- Closing costs
- $1,905
- Reserves months
- —
- Total cash needed
- —
Loan-product check · same deal, 3 products live
Conventional
25% down · 7.5% · 30yr
- Down + closing
- —
- Monthly P&I
- —
- Monthly cashflow
- —
- DSCR
- —
- Eligible?
- —
Personal DTI + credit; lowest rate.
DSCR
20% down · 8.5% · 30yr
- Down + closing
- —
- Monthly P&I
- —
- Monthly cashflow
- —
- DSCR
- —
- Eligible?
- —
No personal income docs; deal must DSCR.
Hard money
10% down · 12.0% · 12mo
- Down + closing
- —
- Monthly P&I
- —
- Monthly cashflow
- —
- DSCR
- —
- Eligible?
- —
Short-term bridge; refi at stabilization.
Rent comps 19 comps
| Address | Beds | Baths | Sqft | Rent | $/sqft | DOM | Units | Dist |
|---|---|---|---|---|---|---|---|---|
| 5475 Tangerine Ave Hemet, CA | 1.0 | 1.5 | 600 | $1,500 | $2.50 | 5d | 1 | 0.15mi |
| 25564 Sharp Dr Unit F Hemet, CA | 1.0 | 1.0 | 832 | $1,475 | $1.77 | 43d | 1 | 0.49mi |
| 26123 Anawood Pl Hemet, CA | 2.0 | 1.0 | 991 | $1,680 | $1.70 | 43d | 1 | 0.52mi |
| 43601 E Florida Ave Unit 43 Hemet, CA | 2.0 | 2.0 | 960 | $1,450 | $1.51 | 23d | 1 | 0.60mi |
| 43601 E Florida Ave #98 Hemet, CA | 2.0 | 2.0 | 840 | $1,400 | $1.67 | 24d | 1 | 0.60mi |
| 43601 E Florida Ave Unit 43 Hemet, CA | 2.0 | 2.0 | 960 | $1,500 | $1.56 | 43d | 1 | 0.60mi |
| 43601 E Florida Ave Hemet, CA | 2.0 | 2.0 | 960 | $1,550 | $1.61 | 43d | 1 | 0.60mi |
| 43601 E Florida Ave #98 Hemet, CA | 2.0 | 2.0 | 800 | $1,400 | $1.75 | 43d | 1 | 0.60mi |
| 26097 Doverwood Pl Hemet, CA | 2.0 | 1.0 | 1019 | $1,849 | $1.81 | 43d | 1 | 0.61mi |
| 43601 California 74 Unit 17 Hemet, CA | 2.0 | 2.0 | 840 | $1,400 | $1.67 | 23d | 1 | 0.64mi |
| 43611 Florida Ave Unit 10 Hemet, CA | 2.0 | 2.0 | 850 | $1,550 | $1.82 | 43d | 1 | 0.67mi |
| 41900 Acacia Ave Hemet, CA | 2.0 | 1.0 | 850 | $1,800 | $2.12 | 43d | 1 | 0.95mi |
| 43816 C St Hemet, CA | 2.0 | 2.0 | 1040 | $2,250 | $2.16 | 24d | 1 | 0.96mi |
| 41818 Acacia East Ave Hemet, CA | 2.0 | 1.0 | 1000 | $1,850 | $1.85 | 14d | 1 | 1.08mi |
| 44085 Palm Ave Hemet, CA | 2.0 | 2.0 | 800 | $1,850 | $2.31 | 3d | 1 | 1.24mi |
| 44075 B St Hemet, CA | 3.0 | 1.0 | 680 | $1,595 | $2.35 | 20d | 1 | 1.25mi |
| 44099 D St Hemet, CA | 3.0 | 2.0 | 1040 | $2,195 | $2.11 | 17d | 1 | 1.25mi |
| 41611 Marine Dr Hemet, CA | 2.0 | 1.0 | 1050 | $1,700 | $1.62 | 12d | 1 | 1.27mi |
| 41541 Marine Dr Hemet, CA | 2.0 | 1.0 | 1000 | $1,700 | $1.70 | 12d | 1 | 1.33mi |
Listing history 15 events
-
2026-06-18days on market $63,500 Active 44 DOM
-
2026-06-17days on market $63,500 Active 43 DOM
-
2026-06-16days on market $63,500 Active 42 DOM
-
2026-06-15days on market $63,500 Active 41 DOM
-
2026-06-13days on market $63,500 Active 39 DOM
-
2026-06-09days on market $63,500 Active 35 DOM
-
2026-06-08days on market $63,500 Active 34 DOM
-
2026-06-07days on market $63,500 Active 33 DOM
-
2026-06-04days on market $63,500 Active 30 DOM
-
2026-06-03days on market $63,500 Active 29 DOM
-
2026-06-02days on market $63,500 Active 28 DOM
-
2026-06-02price $63,500 Active 27 DOM
-
2026-06-01days on market $69,500 Active 27 DOM
-
2026-05-31days on market $69,500 Active 26 DOM
-
2026-05-05$69,500 Active 681-char remark
ⓘ Source: listings_history table (triggers on properties + properties_extension) + one-shot
backfill from property_details.listing_events for pre-trigger history.
Climate risk First Street
- Flood 1/10 Low FEMA zone X (unshaded) · 0% chance over 30 yrs
- Wildfire 8/10 Severe
- Heat 7/10 Severe 5 d/yr ≥103°F today · 15 d/yr by 30 yrs out
- Wind 1/10 Low
- Air quality 6/10 Major 10 unhealthy d/yr today · 12 by 30 yrs out
Nearby sold comps map
Loading sold comps map…
Walkable amenities ~0.75 mi
Loading nearby amenities…
Taxation est. · year 1
- Rental income
- $20,463
- − Mortgage interest
- −$3,557
- − Property taxes
- −$952
- − Insurance
- −$318
- − Repairs & maintenance
- −$1,637
- − Management
- −$1,637
- − Depreciation
- −$1,847
- Taxable income
- $10,514
- Est. tax owed @ 24.0%
- −$2,523
- After-tax cash flow
- $8,376/yr
For passive investors: Depreciation is non-cash, so a rental often shows a tax loss while cash-flowing — sheltering income. Rental losses are passive: they offset passive income freely, and up to $25,000/yr can offset ordinary (W-2) income if you actively participate and your MAGI is under $100k (phasing out to $0 by $150k); unused losses carry forward. On sale, claimed depreciation is recaptured at up to 25%, and gains may owe capital-gains tax (a 1031 exchange can defer both). Figures are a year-1 estimate at your 24.0% rate — not tax advice; consult a CPA.
Schools (NCES district)
- District
- Hemet Unified
- NCES district ID
- 0616920
- Math proficiency
- 19% ▼ -3.00%
- Reading proficiency
- 41% ▲ 4.00%
- Median HH income
- $39,962
- Composite
- 25.16/100
- National rank
- #7517
- State rank
- #360 of 517 in CA
Livability — Valle Vista
- Score
- 57/100
- State rank
- #739
- US rank
- #21678
Category grades
Schools grade is shown separately in the Schools card above.
Census & demographics
- Census place
- Valle Vista, CA
- County
- Riverside County · 2,287,001 people
- Metro
- Riverside-San Bernardino-Ontario, CA
- Population (ZIP)
- 51,751
- Household income
- $73,596
- Rent vs Own
- Severe rent burden
- 1518.0
Population outlook (Riverside County) Hauer SSP2
- Today (2025)
- 2,664,475 people
- By 2030
- 2,802,692 · +5.2%
- By 2040
- 3,050,904 · +14.5%
- By 2050
- 3,256,783 · +22.2%
- By 2075
- 3,655,058 · +37.2%
- By 2100
- 3,766,594 · +41.4%
Race, ethnicity, and origin ACS 2023
- Neighborhood character
- Diverse neighborhood (Simpson 0.59)
- Race & ethnicity
- Hispanic / Latino 49% White 40% Two or more races 18% Black 5% Asian 3% Native American 2%
- Hispanic origin (detail)
- Mexican 43% Puerto Rican 1%
- Common ancestry
- Slovak 2% Italian 2% Portuguese 2%
- Foreign-born
- 15% · Canada, China
- Languages at home
- 70% English-only · Spanish 27% Other Asian/Pacific 1% Other Indo-European 1%
Political lean MEDSL · Riverside
- 2024 margin
- Toss-up / Even · D 48.0% · R 49.3% · Other 2.6%
- 2008→2024 swing
- -3.6pp toward R · 2008: 2.3pp · 2024: -1.3pp
- All cycles
- 2024: R+1.3 2020: D+8.0 2016: D+4.3 2012: R+0.4 2008: D+2.3
Not yet ingested
- Civics
- —
Market trends
- HPI YoY
- ▼ -219.06%
- Current HPI
- 391.972
- Rent YoY
- ▲ 4.90%
- Metro
- Riverside-San Bernardino-Ontario, CA
- State GDP YoY
- ▲ 3.21%
- F500 in state
- 116
Industry mix (Fortune 500 HQ in CA)
| Industry | F500 HQs | Revenue |
|---|---|---|
| Technology | 27 | $1,492B |
|
||
| Financial Services | 3 | $174B |
|
||
| Retail | 3 | $44B |
|
||
| Insurance | 3 | $26B |
|
||
| Media / Entertainment | 2 | $115B |
|
||
| Pharmaceuticals / Biotech | 2 | $62B |
|
||
Price history
-8.6% since first listed2 events — show timeline
- 2026-06-02 Price Changed $63,500 CRMLS
- 2026-05-05 Listed $69,500 CRMLS
Property tax history
+5.1%/yrLatest (2025): $56 · +4.9% YoY. Source: county tax records.
Cash-flow waterfall
monthlySold comps — $/sqft
last 12 mo · ≤1 miLoading sold comps…