260 Reids Place Dr · Suffolk, VA
Flood risk No data
- FEMA flood zone
- —
- Chance of flooding over 30 yrs
- —
- Est. flood insurance / yr
- —
Fire risk No data
- Est. fire insurance / yr
- —
Heat risk No data
- Hot days now (above threshold)
- —
- Hot days in 30 yrs
- —
Wind risk No data
- Chance of severe wind over 30 yrs
- —
Air-quality risk No data
- Unhealthy air days now
- —
- Unhealthy air days in 30 yrs
- —
Risk factors via First Street. Map © Google.
Why this score? — see what drove the D- grade
The composite is a weighted blend of 9 inputs, each scored 0–100. Each bar is that input's sub-score; the figure is the points it added to the 100-point composite (weight × sub-score).
- Cash flow +9.0/30.0
- ARV discount +7.5/15.0
- Schools +4.8/10.0
- Condition / age +4.8/5.0
- Rent growth +4.0/5.0
- Livability +3.9/5.0
- 1% rule +3.5/10.0
- DSCR +2.5/10.0
- Appreciation +0.0/10.0
$264,895
🖨 Deal sheet 📄 Offer letter ✓ Due diligence
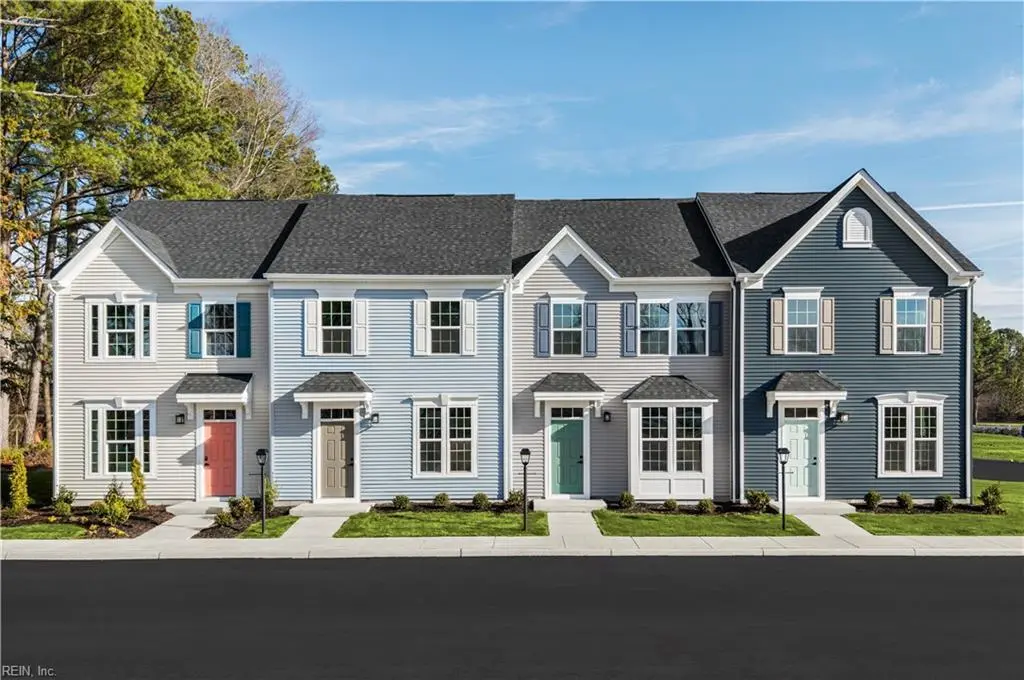
Listing remarks
Modern Open Concept and an abundance of natural light make the Beethoven a townhome that feels like a single-family home. Entering in through the living room, flowing into the kitchen, with included 7ft island, provides plenty of room for cooking and entertaining plus optional powder room. Upstairs are two additional bedrooms, a hall bath with shower/tub combination, and a generous Owner’s Bedroom that features a tray ceiling and a large closet. On ensuite Owner’s Bathroom features a dual vanity and seated tile shower. This home checks all the boxes here at Reids Place! Create the space with personal touches like metal finishes, cabinet colors and counter top upgrades! 15 min t
Key facts
- Included 7ft island
- Open concept
- Dual vanity
Tags
Property features AI
Finance
- HOA & community: HOA managed by GOODMAN PROPERTY MANAGEMENT; Condo association fee $150 monthly
Exterior
- Parking: 2 parking spaces
- Utilities: City/County water; City/County sewer; Electric water heater; Electric power
- Home design: Attached condo; 2-unit condo style; 2 stories; Condo ownership; Unit on level 2 entry
- Construction: Vinyl siding; Asphalt shingle roof; Slab foundation
- Exterior features: Patio
Interior
- Kitchen: Electric range; Microwave; Dishwasher; Disposal; Energy Star appliances
- Bedrooms: Master bedroom on level 2; Two additional bedrooms on level 2
- Flooring: Carpet; Laminate
- Bathrooms: 2 full bathrooms; 1 half bathroom
- Heating & cooling: Electric heating; Central air conditioning
- Interior features: Carpet and laminate flooring
- Laundry & utility: Washer; Dryer
Neighborhood map
What this means for you Summary
Snapshot
- This is a 3-bed/2.5-bath condo listed at $265k. Condition is rated excellent.
Deal economics
- At list price, monthly cash flow is $-207 ($-2k/yr) — negative.
- To cash-flow at today's rent, offer at most $235k (11.3% below list).
- To meet the 1% rule (rent ≥ 1% of price), the offer needs to be $225k (15.2% below list).
- Recommended offer: $225k (15.2% below list) — sets the bar for 1% rule.
- Cap rate 5.4% vs local median 3.5% in Suffolk — top-decile yield for the area; either an underpriced asset or a hidden risk that comps aren't pricing in. Stress-test before assuming the spread holds.
Location & tenants
- Location reads 77/100 on livability (#88 in VA, #2,896 nationally) — a middle-class / working-renter tenant base. Strengths: housing A+, health & safety A+, employment A-; Watch: crime C-, commute F.
- Suffolk City Public School District (suburban): math 41% / reading 69% proficiency, ranked #72 of 131 in VA (top 55%) — acceptable for families but not a draw, mixed tenant base, ~2y average lease.
- Zoned schools: Mack Benn Jr. Elementary (math 27% / reading 50%, grade F, #924 of 1,108 statewide, top 84%, 684 students, 66% FRL); Lakeland High (math 33% / reading 77%, grade C, #279 of 319 statewide, top 88%, 1,083 students, 64% FRL) — zoned schools average 64% FRL vs 39% district-wide (25 pts higher); higher-poverty schools than district average — tighter screening recommended.
- Market conditions: Rents rising fast (+5.8%/yr); 536 active listings in the ZIP; 13 comparable units currently listed for rent nearby; rentals at typical pace (median 17d on market — plan ~3-4 weeks tenant-placement turnaround); solid renter incomes; 680 units permitted in Suffolk city in 2024 (0 in 5+ unit buildings).
- This rent runs 34% of the median local income ($80k/yr) — at the standard rent-burdened threshold; future hikes will face affordability resistance.
Forward outlook
- Local home prices are declining (-3.0%/yr); year-one equity from $2k of loan paydown is wiped out by about $8k of value loss. Plan a longer hold.
- Suffolk County population projected at +11% by 2050 — modest demand growth; plan on rents tracking national, not racing it.
Negotiation context
- Only 8 days on market — expect competitive offers; lowballing is unlikely to land.
Questions for the listing agent
- What do current leases actually rent for vs. the listed asking? Can we see a recent rent roll and the last 12 months of T-12 income?
- What does the HOA fee cover, when was the last increase, and are there any pending special assessments or reserve-fund shortfalls?
- Any open or pending special assessments — roof, HVAC, plumbing, elevator, façade? What's the per-unit balance and payoff schedule, and is the seller paying it off at close or rolling it to the buyer?
- Is there a deadline driving the sale (1031 exchange, divorce, estate, relocation)? That informs how much negotiation room exists.
- Schools are A-rated — typically a magnet for longer-tenancy family renters. What's the average tenant stay here, and is there a school-zone premium baked into asking?
- The area grade is low — what's the realistic commute time and amenity access for the typical tenant pool here? Any planned neighborhood developments (good or bad) we should know about?
- What's the average days-on-market for RENTAL listings here right now (not sales)? A rising rental-DOM trend means longer vacancies and softer asking-rent achievability than the comps imply.
- What's the recent tenant-quality profile in this submarket — average credit score on applications, eviction rate, late-payment / NSF rate, and stable-employment percentage? A property-management company in the area should have these aggregated.
- How much new apartment / multifamily construction is in the pipeline within 1–3 miles? Heavy new supply (>2% of stock underway) typically softens rents 12–24 months out; light construction supports rent growth.
Investment metrics
- 1% rule
- 0.85% ✗
- Cap rate
- 5.36%
- Cash-on-cash
- -3.34%
- DSCR
- 0.85
- GRM
- 9.8
CMA / ARV
No comps found within radius.
Projected returns pro-forma
-3.0% appreciation · 5.84% rent growth · sell at horizon
- IRR
- -18.4%
- Equity multiple
- 0.33×
- Total profit
- $-49,364
- Equity at exit
- $39,497
- IRR
- -5.6%
- Equity multiple
- 0.59×
- Total profit
- $-30,720
- Equity at exit
- $22,903
Cash invested: $74,171 (down + closing). Projections, not guarantees.
Landlord ↔ Tenant lean methodology
- Overall (STATE)
- 55 Moderately Landlord-Leaning
- State Virginia
- 55 Moderately Landlord-Leaning · D+2
- County
- — inherits STATE
- City
- — inherits STATE
ZIP-level market 23434
- Rents YoY
- 5.8%
- Active inventory
- 536
- Price-to-rent
- 9.8×
Monthly cashflow live
- Estimated rent
- $2,246 high interval (Pro) →
- Mortgage (P&I)
- −$1,389
- Tax est. 1.5%
- −$331 /mo · $3,973/yr
- Insurance
- −$110
- HOA
- −$150
- Vacancy / Maint / Mgmt
- −$472
- Net cashflow
- $-207
Break-even live
UW: 25.0% down · 7.5% · 30yr · 1.5% tax · 5.0% vac · 8.0% maint · 8.0% mgmt
Financing live
Cash to close
- Down payment
- $66,224
- Closing costs
- $7,947
- Reserves months
- —
- Total cash needed
- —
Loan-product check · same deal, 3 products live
Conventional
25% down · 7.5% · 30yr
- Down + closing
- —
- Monthly P&I
- —
- Monthly cashflow
- —
- DSCR
- —
- Eligible?
- —
Personal DTI + credit; lowest rate.
DSCR
20% down · 8.5% · 30yr
- Down + closing
- —
- Monthly P&I
- —
- Monthly cashflow
- —
- DSCR
- —
- Eligible?
- —
No personal income docs; deal must DSCR.
Hard money
10% down · 12.0% · 12mo
- Down + closing
- —
- Monthly P&I
- —
- Monthly cashflow
- —
- DSCR
- —
- Eligible?
- —
Short-term bridge; refi at stabilization.
Rent comps 13 comps
| Address | Beds | Baths | Sqft | Rent | $/sqft | DOM | Units | Dist |
|---|---|---|---|---|---|---|---|---|
| 206 Reid's Place Dr Suffolk, VA | 3.0 | 2.5 | 1280 | $2,200 | $1.72 | 4d | 1 | 0.10mi |
| 206 Reid's Place Dr Unit 206 Suffolk, VA | 3.0 | 2.5 | 1280 | $2,300 | $1.80 | 17d | 1 | 0.11mi |
| 803 Haskins Dr Suffolk, VA | 3.0 | 2.0 | 1653 | $2,400 | $1.45 | 23d | 1 | 0.23mi |
| 827 Haskins Dr Suffolk, VA | 3.0 | 3.0 | 1794 | $2,600 | $1.45 | 43d | 1 | 0.36mi |
| 113 Crocker St Suffolk, VA | 4.0 | 2.5 | 1708 | $2,695 | $1.58 | 17d | 1 | 0.41mi |
| 1144 Portsmouth Blvd Suffolk, VA | 2.0–3.0 | 2.0 | 1039 | $1,822 | $1.75 | 1d | 88 | 0.61mi |
| 1410 Blythewood Ln Suffolk, VA | 4.0 | 1.5 | 1056 | $1,800 | $1.70 | 43d | 1 | 0.79mi |
| 115 C St Suffolk, VA | 3.0 | 2.5 | 1576 | $1,995 | $1.27 | 12d | 1 | 1.05mi |
| 223 N 7th St Suffolk, VA | 3.0 | 2.5 | 1495 | $2,300 | $1.54 | 43d | 1 | 1.10mi |
| 307 N 4th St Suffolk, VA | 4.0 | 2.0 | 1600 | $1,800 | $1.12 | 7d | 1 | 1.17mi |
| 315 Highland Ave Suffolk, VA | 3.0 | 2.0 | 1580 | $2,050 | $1.30 | 23d | 1 | 1.23mi |
| 1549 River Creek Cres Suffolk, VA | 3.0 | 2.5 | 1768 | $2,450 | $1.39 | 4d | 1 | 1.48mi |
| 124 Halifax St Suffolk, VA | 4.0 | 2.0 | 1728 | $2,100 | $1.22 | 43d | 1 | 1.48mi |
HOA detail condo
- Monthly dues
- $150 · $1,800/yr
- Assessments
- None detected in remarks — confirm with the listing agent.
Listing history 5 events
-
2026-06-16statusdays on market $264,895 Under Contract 8 DOM
-
2026-06-15days on market $264,895 Active 7 DOM
-
2026-06-13days on market $264,895 Active 5 DOM
-
2026-06-08remarks 687-char remark
-
2026-06-08$264,895 Active 1 DOM
ⓘ Source: listings_history table (triggers on properties + properties_extension) + one-shot
backfill from property_details.listing_events for pre-trigger history.
Nearby sold comps map
Loading sold comps map…
Walkable amenities ~0.75 mi
Loading nearby amenities…
Taxation est. · year 1
- Rental income
- $26,946
- − Mortgage interest
- −$14,838
- − Property taxes
- −$3,973
- − Insurance
- −$1,324
- − Repairs & maintenance
- −$2,156
- − Management
- −$2,156
- − HOA
- −$1,800
- − Depreciation
- −$7,706
- Taxable loss
- −$7,008
- Est. tax savings @ 24.0%
- +$1,682
- After-tax cash flow
- $-798/yr
For passive investors: Depreciation is non-cash, so a rental often shows a tax loss while cash-flowing — sheltering income. Rental losses are passive: they offset passive income freely, and up to $25,000/yr can offset ordinary (W-2) income if you actively participate and your MAGI is under $100k (phasing out to $0 by $150k); unused losses carry forward. On sale, claimed depreciation is recaptured at up to 25%, and gains may owe capital-gains tax (a 1031 exchange can defer both). Figures are a year-1 estimate at your 24.0% rate — not tax advice; consult a CPA.
Condition & rehab AI · 13 photos
This modern townhome is in excellent condition with no visible repairs or maintenance needed. It has a great layout and is move-in ready, making it an attractive option for both resale and rental.
Value-add opportunities
- Resale Painting the exterior and interior walls — Fresh paint can enhance the curb appeal and make the home look more inviting to potential buyers.
- Resale Updating the flooring — New flooring can improve the overall look and feel of the home, making it more appealing to potential buyers.
- Resale Upgrading the kitchen appliances — Modern appliances can make the kitchen more functional and attractive to potential buyers.
- Resale Updating the bathrooms — Fresh paint and updated fixtures can make the bathrooms more appealing to potential buyers.
Renovation cost estimate screening
Value-add ROI direction
- Resale Painting the exterior and interior walls — Fresh paint can enhance the curb appeal and make the home look more inviting to potential buyers. ↑
- Resale Updating the flooring — New flooring can improve the overall look and feel of the home, making it more appealing to potential buyers. ↑
- Resale Upgrading the kitchen appliances — Modern appliances can make the kitchen more functional and attractive to potential buyers. ↑
- Resale Updating the bathrooms — Fresh paint and updated fixtures can make the bathrooms more appealing to potential buyers. ↑
ⓘ Cost ranges are severity-bucket heuristics (US national rule-of-thumb). Get contractor quotes + a written scope before underwriting a rehab budget.
Schools (NCES district)
- District
- Suffolk City Public School District
- NCES district ID
- 5103710
- Math proficiency
- 41% ▼ -43.00%
- Reading proficiency
- 69% ▼ -8.00%
- Median HH income
- $65,573
- Composite
- 48.31/100
- National rank
- #2151
- State rank
- #72 of 131 in VA
Livability — Suffolk
- Score
- 77/100
- State rank
- #88
- US rank
- #2896
Category grades
Schools grade is shown separately in the Schools card above.
Census & demographics
- Census place
- Suffolk, VA
- County
- Suffolk City · 88,108 people
- City population
- 88,108
- Metro
- Virginia Beach-Norfolk-Newport News, VA-NC
- Population (ZIP)
- 54,387
- Household income
- $79,877
- Rent vs Own
- Severe rent burden
- 1934.0
Population outlook (Suffolk County) Hauer SSP2
- Today (2025)
- 95,269 people
- By 2030
- 98,269 · +3.1%
- By 2040
- 103,177 · +8.3%
- By 2050
- 105,777 · +11.0%
- By 2075
- 110,963 · +16.5%
- By 2100
- 103,711 · +8.9%
Race, ethnicity, and origin ACS 2023
- Neighborhood character
- Diverse neighborhood (Simpson 0.58)
- Race & ethnicity
- Black 49% White 41% Two or more races 5% Hispanic / Latino 4% Asian 1%
- Common ancestry
- Lithuanian 1% Slovak 1% Italian 1%
- Foreign-born
- 3% · Canada
- Languages at home
- 96% English-only · Spanish 2%
Political lean MEDSL · Suffolk
- 2024 margin
- D (+15.9) · D 57.4% · R 41.5% · Other 1.2%
- 2008→2024 swing
- +2.7pp toward D · 2008: 13.2pp · 2024: 15.9pp
- All cycles
- 2024: D+15.9 2020: D+17.3 2016: D+13.8 2012: D+15.1 2008: D+13.2
Not yet ingested
- Civics
- —
Market trends
- HPI YoY
- ▼ -383.80%
- Current HPI
- 158.5866
- Rent YoY
- ▲ 5.84%
- Metro
- Virginia Beach-Norfolk-Newport News, VA-NC
- State GDP YoY
- ▲ 2.40%
- F500 in state
- 50
Industry mix (Fortune 500 HQ in VA)
| Industry | F500 HQs | Revenue |
|---|---|---|
| Aerospace / Defense | 4 | $236B |
|
||
| Technology / Defense | 3 | $32B |
|
||
| Financial Services | 2 | $176B |
|
||
| Utilities | 2 | $27B |
|
||
| Insurance | 2 | $25B |
|
||
| Technology | 2 | $15B |
|
||
Price history
1 event — show timeline
- 2026-06-03 Listed $264,895 REINMLS
Cash-flow waterfall
monthlySold comps — $/sqft
last 12 mo · ≤1 miLoading sold comps…