3866 Sherwood Dr · Montgomery, AL
Flood risk 3/10 · Minor
- FEMA flood zone
- X (unshaded)
- Chance of flooding over 30 yrs
- 0.2%
- Est. flood insurance / yr
- $507 – $1,088
Fire risk 3/10 · Minor
- Est. fire insurance / yr
- $916 – $1,700
Heat risk 7/10 · Major
- Hot days now (above 107°F)
- 7 days/yr
- Hot days in 30 yrs
- 18 days/yr
Wind risk 8/10 · Major
- Chance of severe wind over 30 yrs
- 80.0%
Air-quality risk 4/10 · Minor
- Unhealthy air days now
- 4 days/yr
- Unhealthy air days in 30 yrs
- 5 days/yr
Risk factors via First Street. Map © Google.
Why this score? — see what drove the B grade
The composite is a weighted blend of 9 inputs, each scored 0–100. Each bar is that input's sub-score; the figure is the points it added to the 100-point composite (weight × sub-score).
- Cash flow +28.9/30.0
- ARV discount +15.0/15.0
- DSCR +10.0/10.0
- 1% rule +7.4/10.0
- Rent growth +3.2/5.0
- Livability +3.2/5.0
- Condition / age +2.5/5.0
- Schools +1.7/10.0
- Appreciation +0.0/10.0
$114,900
🖨 Deal sheet 📄 Offer letter ✓ Due diligence
Listing remarks MLS
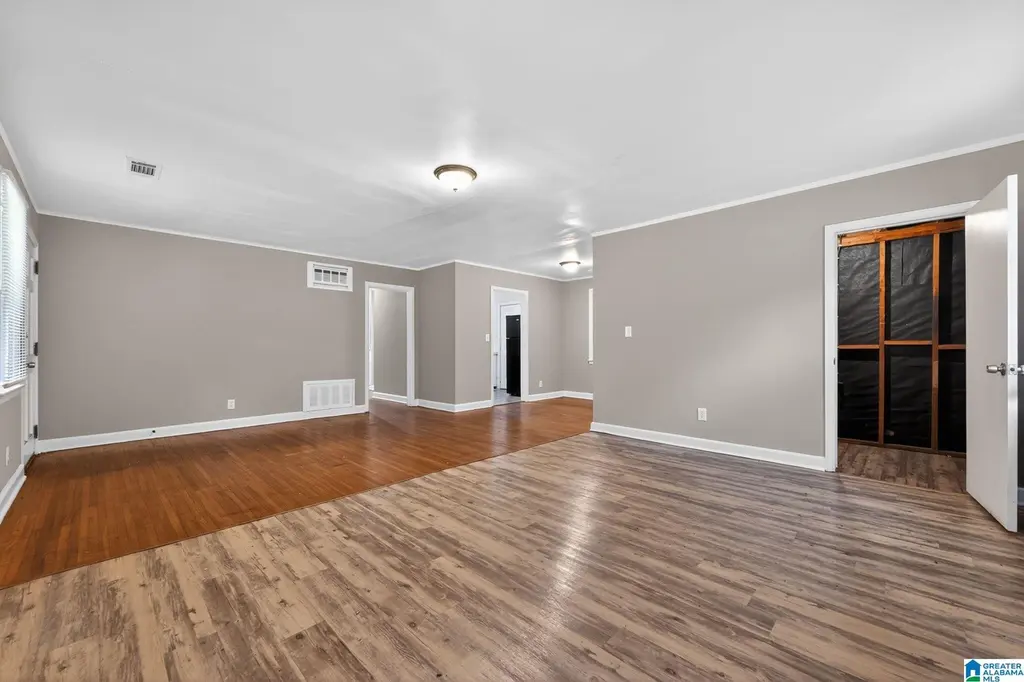
A CURRENT EIFS REPORT DATE 7/2/13 IS AVAILABLE FROM THE LISTING AGENT. ALL REPAIRS ARE IN THE PROCESS OF BEING FINISHED. EXTRA LARGE GREAT ROOM. HARDWOOD FLOORS ALMOST THROUGHOUT THE HOUSE. HUGE SCREENED IN COVERED PATIO LOOKING OUT TO MATURE SHADE TREES AND MATURE LANDSCAPING. $3,000 UPGRADE ALLOWANCE FOR BUYERS DISCRETION. SHOWS WELL.
Key facts
- Generous lot
- Large level backyard
- Built 1954
Tags
Property features AI
Finance
- HOA & community: No association fee
Exterior
- Parking: Driveway parking
- Utilities: Public water; Gas water heater; Internet service availability unknown
- Home design: Existing construction; Slab foundation
- Construction: Brick over foundation construction
- Exterior features: Fenced yard; Covered patio
Interior
- Kitchen: Laminate countertops; Refrigerator included
- Bedrooms: Master bedroom on main level (approx. 13 x 11); Bedroom on main level (approx. 11 x 10); Bedroom on main level (approx. 10 x 10)
- Flooring: Hardwood flooring; Vinyl flooring
- Bathrooms: One full bathroom with tub/shower combo
- Heating & cooling: Central heating; Central electric cooling
- Interior features: Ceilings: Other (see remarks); No additional interior features reported
- Laundry & utility: Laundry room on the main level; Washer hookup; Electric dryer hookup; Attic with pull-down access
Neighborhood map
What this means for you Summary
Snapshot
- This is a 3-bed/1.0-bath single-family listed at $115k.
Deal economics
- At list price, monthly cash flow is $389 ($5k/yr) — positive.
- The deal already cash-flows at list — no discount required.
- Meets the 1% rule at list price ($1k rent vs $115k).
- Cap rate 10.4% vs local median 6.0% in Montgomery — top-decile yield for the area; either an underpriced asset or a hidden risk that comps aren't pricing in. Stress-test before assuming the spread holds.
Location & tenants
- Location reads 65/100 on livability (#138 in AL) — a middle-class / working-renter tenant base. Strengths: cost of living A+, housing A+; Watch: employment D, crime F, amenities D-.
- Montgomery County (urban): math 9% / reading 31% proficiency, ranked #106 of 129 in AL (top 82%) — low school quality limits family demand, transient renter base, plan for 1-2y turnover; 70% free/reduced lunch — lower-income household profile, screen leases tightly.
- Zoned schools: Flowers Elementary School (math 2% / reading 27%, grade F, #508 of 627 statewide, top 84%, 394 students, 74% FRL); Lee High School (math 2% / reading 8%, grade F, #276 of 305 statewide, top 95%, 1,374 students, 86% FRL).
- Market conditions: Rents rising (+2.6%/yr); 207 active listings in the ZIP; 40 comparable units currently listed for rent nearby; rentals at typical pace (median 21d on market — plan ~3-4 weeks tenant-placement turnaround); 40% of comp listings sitting > 30 days — soft ceiling on asking rent; 460 units permitted in Montgomery County in 2024 (37 in 5+ unit buildings).
Forward outlook
- Local home prices are declining (-3.0%/yr); year-one equity from $794 of loan paydown is wiped out by about $3k of value loss. Plan a longer hold.
- Montgomery County population projected to shrink 8% by 2050 — rents likely to lag national; underwrite the cash flow, not the appreciation.
- At projected returns (-3.0% appreciation + 2.6% rent growth), your $32k cash investment doubles in ~9 years — after that, you're playing with house money.
Negotiation context
- Only 6 days on market — expect competitive offers; lowballing is unlikely to land.
- 4 sale attempts since 14y ago with the ask held roughly flat each time — persistent listings suggest the price (not the market) is what's stuck; bring a comps-based counter.
- Current owner paid $72k; list at $115k implies a 58% gain — meaningful room to come down on a strong offer.
Risks & watch-outs
- Watch-outs: built in 1954 — expect roof / HVAC / electrical / plumbing capex.
- Climate carrying-cost: severe wind risk, 80% chance of damaging wind over 30y; extreme-heat days projected 7→18/yr by 2055 (HVAC capex compounding) — expect insurance premiums to compound above CPI over the hold.
Questions for the listing agent
- Built in 1954 — when were the roof, HVAC, electrical panel, plumbing, and water heater last replaced?
- Is there a deadline driving the sale (1031 exchange, divorce, estate, relocation)? That informs how much negotiation room exists.
- Crime grade is F in this area — have there been break-ins, vandalism, or insurance claims at this property in the last 3 years? What carrier currently insures it and at what premium?
- What's the average days-on-market for RENTAL listings here right now (not sales)? A rising rental-DOM trend means longer vacancies and softer asking-rent achievability than the comps imply.
- What's the recent tenant-quality profile in this submarket — average credit score on applications, eviction rate, late-payment / NSF rate, and stable-employment percentage? A property-management company in the area should have these aggregated.
- How much new for-sale + rental construction is in the pipeline within 1–3 miles? Heavy new supply typically softens prices + rents 12–24 months out; constrained supply supports both.
Investment metrics
- 1% rule
- 1.24% ✓
- Cap rate
- 10.36%
- Cash-on-cash
- 14.53%
- DSCR
- 1.65
- GRM
- 6.7
CMA / ARV
- ARV (on-the-fly)
- $143,521
- Comps found
- 12
Show comp detail 12 sales within ~0.75 mi
| Address | Dist | Beds/Ba | Sqft | Sold | Price | $/sf | Match |
|---|---|---|---|---|---|---|---|
| 403 Nottingham Rd | 0.26mi | 3/1.0 | 1,450 (+2%) | 0mo | $39,901 | $28 | 84 |
| 664 Joryne Dr | 0.33mi | 3/2.0 | 1,363 (-4%) | 1mo | $129,000 | $95 | 73 |
| 887 Greg Dr | 0.61mi | 3/2.0 | 1,492 (+5%) | 2mo | $150,000 | $101 | 58 |
| 3700 Ramos Ct | 0.32mi | 3/2.0 | 1,232 (-13%) | 3mo | $134,400 | $109 | 56 |
| 4023 Ware Hill Dr | 0.74mi | 2/2.0 (-1) | 1,425 (+0%) | 4mo | $163,000 | $114 | 53 |
| 815 Perry Hill Rd | 0.73mi | 3/1.0 | 1,303 (-8%) | 0mo | $100,000 | $77 | 52 |
| 3326 Vermont Dr | 0.68mi | 3/2.0 | 1,568 (+10%) | 2mo | $80,000 | $51 | 46 |
| 302 Ware Hill Ct | 0.68mi | 3/2.0 | 1,589 (+12%) | 1mo | $179,000 | $113 | 44 |
| 349 Sterling Dr | 0.70mi | 3/2.0 | 1,593 (+12%) | 1mo | $208,000 | $131 | 42 |
| 753 Green Ridge Rd | 0.57mi | 3/2.0 | 1,634 (+15%) | 3mo | $163,600 | $100 | 42 |
| 3556 N Wareingwood Dr | 0.71mi | 3/1.0 | 1,215 (-14%) | 3mo | $71,500 | $59 | 40 |
| 4025 Ware Hill Dr | 0.75mi | 3/2.0 | 1,598 (+12%) | 1mo | $185,000 | $116 | 39 |
Match score weights: distance 35% · size 25% · config 20% · recency 20%. Top-matched comps best support the ARV.
Projected returns pro-forma
-3.0% appreciation · 2.65% rent growth · sell at horizon
- IRR
- 4.6%
- Equity multiple
- 1.18×
- Total profit
- $5,669
- Equity at exit
- $17,132
- IRR
- 13.7%
- Equity multiple
- 2.08×
- Total profit
- $34,777
- Equity at exit
- $9,934
Cash invested: $32,172 (down + closing). Projections, not guarantees.
Landlord ↔ Tenant lean methodology
- Overall (STATE)
- 90 Strongly Landlord-Friendly
- State Alabama
- 90 Strongly Landlord-Friendly · R+15
- County
- — inherits STATE
- City
- — inherits STATE
ZIP-level market 36109
- Home prices YoY
- -20.1%
- Rents YoY
- 2.6%
- Active inventory
- 207
- Price-to-rent
- 6.7×
Monthly cashflow live
- Estimated rent
- $1,422 high interval (Pro) →
- Mortgage (P&I)
- −$603
- Tax from tax record
- −$84 /mo · $1,007/yr
- Insurance
- −$48
- HOA
- −$0
- Vacancy / Maint / Mgmt
- −$299
- Net cashflow
- $389
Break-even live
UW: 25.0% down · 7.5% · 30yr · 1.5% tax · 5.0% vac · 8.0% maint · 8.0% mgmt
Financing live
Cash to close
- Down payment
- $28,725
- Closing costs
- $3,447
- Reserves months
- —
- Total cash needed
- —
Loan-product check · same deal, 3 products live
Conventional
25% down · 7.5% · 30yr
- Down + closing
- —
- Monthly P&I
- —
- Monthly cashflow
- —
- DSCR
- —
- Eligible?
- —
Personal DTI + credit; lowest rate.
DSCR
20% down · 8.5% · 30yr
- Down + closing
- —
- Monthly P&I
- —
- Monthly cashflow
- —
- DSCR
- —
- Eligible?
- —
No personal income docs; deal must DSCR.
Hard money
10% down · 12.0% · 12mo
- Down + closing
- —
- Monthly P&I
- —
- Monthly cashflow
- —
- DSCR
- —
- Eligible?
- —
Short-term bridge; refi at stabilization.
Rent comps 40 comps
| Address | Beds | Baths | Sqft | Rent | $/sqft | DOM | Units | Dist |
|---|---|---|---|---|---|---|---|---|
| 3692 Fairfield Dr Montgomery, AL | 3.0 | 2.0 | 1524 | $1,400 | $0.92 | 20d | 1 | 0.19mi |
| 118 Nottingham Ct Montgomery, AL | 3.0 | 2.0 | 1344 | $1,275 | $0.95 | 43d | 1 | 0.26mi |
| 3602 Little John Dr Montgomery, AL | 4.0 | 1.0 | 1286 | $1,400 | $1.09 | 20d | 1 | 0.30mi |
| 107 Dalraida Rd Unit A Montgomery, AL | 3.0 | 2.0 | 1237 | $1,200 | $0.97 | 43d | 1 | 0.42mi |
| 688 Joryne Dr Montgomery, AL | 3.0 | 2.0 | 1500 | $1,200 | $0.80 | 43d | 1 | 0.42mi |
| 3515 Cottonwood Dr Montgomery, AL | 3.0 | 1.5 | 1246 | $1,350 | $1.08 | 43d | 1 | 0.47mi |
| 4046 Camellia Dr Unit 1 Montgomery, AL | 3.0 | 2.0 | 1500 | $1,200 | $0.80 | 43d | 1 | 0.52mi |
| 860 Greg Dr Montgomery, AL | 3.0 | 2.0 | 1400 | $1,295 | $0.93 | 13d | 1 | 0.55mi |
| 239 Forest Hills Dr Montgomery, AL | 4.0 | 1.5 | 1500 | $1,450 | $0.97 | 20d | 1 | 0.58mi |
| 3309 Hillcrest Ln Unit 1043908P Montgomery, AL | 4.0 | 2.0 | 1625 | $2,885 | $1.78 | 20d | 1 | 0.62mi |
| 3334 Cottonwood Dr Montgomery, AL | 3.0 | 2.0 | 1025 | $1,295 | $1.26 | 13d | 1 | 0.63mi |
| 817 Dumont Dr Montgomery, AL | 3.0 | 2.0 | 1635 | $1,800 | $1.10 | 13d | 1 | 0.65mi |
| 895 Greg Dr Montgomery, AL | 3.0 | 2.0 | 1489 | $1,600 | $1.07 | 13d | 1 | 0.66mi |
| 4056 Wares Ferry Rd Montgomery, AL | 3.0 | 2.0 | 1800 | $1,500 | $0.83 | 13d | 1 | 0.66mi |
| 3329 Vermont Dr Montgomery, AL | 3.0 | 1.5 | 1465 | $1,395 | $0.95 | 13d | 1 | 0.67mi |
| 3233 Hillcrest Ln Montgomery, AL | 3.0 | 2.0 | 1278 | $1,395 | $1.09 | 20d | 1 | 0.68mi |
| 908 Greg Dr Montgomery, AL | 3.0 | 1.0 | 1520 | $1,100 | $0.72 | 20d | 1 | 0.69mi |
| 844 Sir Michael Dr Montgomery, AL | 4.0 | 2.0 | 1502 | $1,650 | $1.10 | 43d | 1 | 0.69mi |
| 4023 Ware Hill Dr Unit 1507324P Montgomery, AL | 2.0 | 2.0 | 1420 | $4,076 | $2.87 | 13d | 1 | 0.71mi |
| 3319 Willow Lane Dr Montgomery, AL | 3.0 | 2.0 | 1032 | $1,200 | $1.16 | 43d | 1 | 0.73mi |
| 401 Ridgewood Ln Montgomery, AL | 3.0 | 2.0 | 1513 | $1,195 | $0.79 | 20d | 1 | 0.78mi |
| 926 Green Ridge Ct Montgomery, AL | 3.0 | 2.0 | 1665 | $1,381 | $0.83 | 13d | 1 | 0.81mi |
| 750 S Marquette Dr Montgomery, AL | 3.0 | 1.0 | 1325 | $1,195 | $0.90 | 43d | 1 | 0.87mi |
| 67 Holliday Dr Montgomery, AL | 3.0 | 1.0 | 1156 | $1,200 | $1.04 | 43d | 1 | 0.87mi |
| 3456 Harrison Rd Montgomery, AL | 3.0 | 1.0 | 1008 | $1,300 | $1.29 | 43d | 1 | 0.91mi |
| 610 S Georgetown Dr Unit 1386555P Montgomery, AL | 3.0 | 1.0 | 1474 | $3,635 | $2.47 | 13d | 1 | 0.92mi |
| 167 E Salem Dr Montgomery, AL | 3.0 | 2.0 | 1700 | $1,050 | $0.62 | 43d | 1 | 0.96mi |
| 3105 Pelzer Ave Montgomery, AL | 4.0 | 2.0 | 1605 | $1,425 | $0.89 | 43d | 1 | 0.96mi |
| 186 E Salem Dr Montgomery, AL | 3.0 | 1.0 | 1040 | $1,195 | $1.15 | 20d | 1 | 0.98mi |
| 4365 Hillside Oaks Montgomery, AL | 2.0 | 2.0 | 1204 | $1,500 | $1.25 | 43d | 1 | 1.00mi |
| 3737 Dalraida Pkwy Montgomery, AL | 3.0 | 1.0 | 1618 | $1,150 | $0.71 | 43d | 1 | 1.00mi |
| 3462 Biltmore Ave Montgomery, AL | 3.0 | 2.0 | 1685 | $1,225 | $0.73 | 20d | 1 | 1.00mi |
| 200 Eton Rd Montgomery, AL | 3.0 | 1.5 | 1500 | $895 | $0.60 | 13d | 1 | 1.00mi |
| 1117 Karen Rd Montgomery, AL | 3.0 | 1.0 | 1308 | $1,195 | $0.91 | 43d | 1 | 1.02mi |
| 4041A Beth Manor Dr Montgomery, AL | 1.0–3.0 | 1.0–2.0 | 925 | $1,000 | $1.08 | 20d | 20 | 1.05mi |
| 3359 Bedford Ln Montgomery, AL | 4.0 | 2.0 | 1786 | $1,600 | $0.90 | 13d | 1 | 1.06mi |
| 3346 Bedford Ln Montgomery, AL | 3.0 | 1.0 | 1134 | $1,295 | $1.14 | 13d | 1 | 1.08mi |
| 3323 Bedford Ln Montgomery, AL | 3.0 | 2.0 | 1134 | $1,200 | $1.06 | 20d | 1 | 1.09mi |
| 1154 Lakewood Dr Montgomery, AL | 3.0 | 2.0 | 1066 | $1,350 | $1.27 | 43d | 1 | 1.09mi |
| 122 Oak Forest Dr Montgomery, AL | 3.0 | 1.0 | 1092 | $975 | $0.89 | 20d | 1 | 1.11mi |
Listing history 6 events
-
2026-06-18days on market $114,900 Active 6 DOM
-
2026-06-17days on market $114,900 Active 5 DOM
-
2026-06-16days on market $114,900 Active 4 DOM
-
2026-06-15days on market $114,900 Active 3 DOM
-
2026-06-13remarks 605-char remark
-
2026-06-13$114,900 Active 1 DOM
ⓘ Source: listings_history table (triggers on properties + properties_extension) + one-shot
backfill from property_details.listing_events for pre-trigger history.
Tax reassessment forecast AL · Resets to sale price
- Current annual tax
- $1,007 · $84/mo
- Projected year-2 tax
- $1,007 · $84/mo
- Expected delta
- $0/yr ($0/mo · -0.0%)
ⓘ Screening estimate from a state-policy table — verify with the county assessor before closing.
Climate risk First Street
- Flood 3/10 Moderate FEMA zone X (unshaded) · 20% chance over 30 yrs
- Wildfire 3/10 Moderate
- Heat 7/10 Severe 7 d/yr ≥107°F today · 18 d/yr by 30 yrs out
- Wind 8/10 Severe 80% chance of damaging wind over 30 yrs
- Air quality 4/10 Moderate 4 unhealthy d/yr today · 5 by 30 yrs out
Nearby sold comps map
Loading sold comps map…
Walkable amenities ~0.75 mi
Loading nearby amenities…
Taxation est. · year 1
- Rental income
- $17,070
- − Mortgage interest
- −$6,436
- − Property taxes
- −$1,007
- − Insurance
- −$574
- − Repairs & maintenance
- −$1,366
- − Management
- −$1,366
- − Depreciation
- −$3,343
- Taxable income
- $2,978
- Est. tax owed @ 24.0%
- −$715
- After-tax cash flow
- $3,958/yr
For passive investors: Depreciation is non-cash, so a rental often shows a tax loss while cash-flowing — sheltering income. Rental losses are passive: they offset passive income freely, and up to $25,000/yr can offset ordinary (W-2) income if you actively participate and your MAGI is under $100k (phasing out to $0 by $150k); unused losses carry forward. On sale, claimed depreciation is recaptured at up to 25%, and gains may owe capital-gains tax (a 1031 exchange can defer both). Figures are a year-1 estimate at your 24.0% rate — not tax advice; consult a CPA.
Schools (NCES district)
- District
- Montgomery County
- NCES district ID
- 0102430
- Math proficiency
- 9% ▼ -21.00%
- Reading proficiency
- 31% ▼ -1.00%
- Median HH income
- $43,902
- Composite
- 17.24/100
- National rank
- #9093
- State rank
- #106 of 129 in AL
Livability — Montgomery
- Score
- 65/100
- State rank
- #138
- US rank
- #13416
Category grades
Schools grade is shown separately in the Schools card above.
Census & demographics
- Census place
- Montgomery, AL
- County
- Montgomery County · 190,016 people
- City population
- 175,913
- Metro
- Montgomery, AL
- Population (ZIP)
- 23,581
- Household income
- $59,193
- Rent vs Own
- Severe rent burden
- 1039.0
Population outlook (Montgomery County) Hauer SSP2
- Today (2025)
- 224,008 people
- By 2030
- 221,460 · -1.1%
- By 2040
- 214,179 · -4.4%
- By 2050
- 204,912 · -8.5%
- By 2075
- 177,821 · -20.6%
- By 2100
- 145,134 · -35.2%
Race, ethnicity, and origin ACS 2023
- Neighborhood character
- Diverse neighborhood (Simpson 0.60)
- Race & ethnicity
- White 49% Black 39% Hispanic / Latino 8% Two or more races 4%
- Hispanic origin (detail)
- Mexican 4%
- Common ancestry
- Slovak 2% Lithuanian 1% Serbian 1%
- Foreign-born
- 4% · Canada, South Korea
- Languages at home
- 94% English-only · Spanish 5%
Political lean MEDSL · Montgomery
- 2024 margin
- Solid D (+30.7) · D 64.8% · R 34.1% · Other 1.1%
- 2008→2024 swing
- +11.5pp toward D · 2008: 19.2pp · 2024: 30.7pp
- All cycles
- 2024: D+30.7 2020: D+31.5 2016: D+26.2 2012: D+24.3 2008: D+19.2
Not yet ingested
- Civics
- —
Market trends
- HPI YoY
- ▼ -37.64%
- Current HPI
- 149.3867
- Rent YoY
- ▲ 2.65%
- Metro
- Montgomery, AL
- State GDP YoY
- ▲ 2.94%
- F500 in state
- 4
Industry mix (Fortune 500 HQ in AL)
| Industry | F500 HQs | Revenue |
|---|---|---|
| Financial Services | 1 | $8B |
|
||
| Healthcare | 1 | $5B |
|
||
Price history
+123.1% since first listed7 events — show timeline
- 2026-06-12 Listed $114,900 Greater Alabama MLS
- 2021-09-17 Sold (Public Records) $72,500 Public Records
- 2021-09-13 Sold (MLS) $72,500 MAAR
- 2021-08-16 Listed $79,000 MAAR
- 2013-12-19 Sold (MLS) $42,000 MAAR
- 2013-07-01 Listed $49,000 MAAR
- 2012-09-17 Listed $51,499 MAAR
Property tax history
+5.7%/yrLatest (2025): $1,007 · +2.5% YoY. Source: county tax records.
Cash-flow waterfall
monthlySold comps — $/sqft
last 12 mo · ≤1 miLoading sold comps…