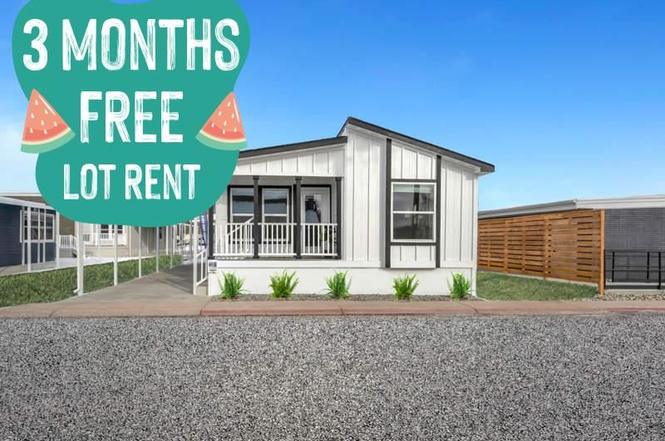
3650 S Federal Blvd Unit 15-RV15 · Sheridan, CO
Flood risk 7/10 · Major
- FEMA flood zone
- X (shaded)
- Chance of flooding over 30 yrs
- 0.99%
- Est. flood insurance / yr
- $507 – $1,088
Fire risk 2/10 · Minimal
- Est. fire insurance / yr
- $939 – $1,743
Heat risk 3/10 · Minor
- Hot days now (above 91°F)
- 7 days/yr
- Hot days in 30 yrs
- 19 days/yr
Wind risk 2/10 · Minimal
- Chance of severe wind over 30 yrs
- —
Air-quality risk 3/10 · Minor
- Unhealthy air days now
- 2 days/yr
- Unhealthy air days in 30 yrs
- 3 days/yr
Risk factors via First Street. Map © Google.
Why this score? — see what drove the D grade
The composite is a weighted blend of 9 inputs, each scored 0–100. Each bar is that input's sub-score; the figure is the points it added to the 100-point composite (weight × sub-score).
- Cash flow +17.3/30.0
- ARV discount +7.5/15.0
- DSCR +5.4/10.0
- 1% rule +4.7/10.0
- Livability +3.2/5.0
- Condition / age +2.5/5.0
- Rent growth +2.3/5.0
- Schools +1.0/10.0
- Appreciation +0.0/10.0
$159,000
🖨 Deal sheet (PDF) 📄 Offer letter ✓ Due diligence
Key facts
- Quartz countertops
- Vinyl flooring
- Tiled backsplash
Tags
Property features AI
Finance
- Financial info: List price $168,000
Exterior
- Home design: Spec inventory unit; Plan name: 3650 S. Federal Blvd. #15 RV15; Active listing
- Exterior features: Located at 3650 S Federal Blvd Unit 15-RV15, Englewood, CO 80110
Interior
- Bedrooms: 2 bedrooms
- Bathrooms: 2 full bathrooms
- Interior features: Living area of 960
Neighborhood map
What this means for you Summary
Snapshot
- This is a 2-bed/2.0-bath manufactured listed at $159k.
Deal economics
- At list price, monthly cash flow is $50 ($599/yr) — positive.
- The deal already cash-flows at list — no discount required.
- To meet the 1% rule (rent ≥ 1% of price), the offer needs to be $154k (3.3% below list).
- Recommended offer: $140k (12.0% below list) — sets the bar for market timing.
- Cap rate 7.2% vs local median 3.7% in Sheridan — top-decile yield for the area; either an underpriced asset or a hidden risk that comps aren't pricing in. Stress-test before assuming the spread holds.
Location & tenants
- Location reads 63/100 on livability (#197 in CO) — a middle-class / working-renter tenant base. Strengths: commute A+, housing A-; Watch: employment C-, amenities D+, crime F.
- Sheridan School District No. 2 (suburban): math 4% / reading 20% proficiency, ranked #85 of 86 in CO (top 99%) — low school quality limits family demand, transient renter base, plan for 1-2y turnover; 84% free/reduced lunch — lower-income household profile, screen leases tightly.
- Zoned schools: Alice Terry Elementary School (193 students, 91% FRL); Fort Logan Northgate (math 4% / reading 18%, grade F, #242 of 270 statewide, top 90%, 398 students, 95% FRL); Sheridan High School (math 8% / reading 27%, grade F, #340 of 381 statewide, top 90%, 326 students, 90% FRL).
- Market conditions: Rents soft (-0.8%/yr); 106 active listings in the ZIP; 24 comparable units currently listed for rent nearby; rentals leasing fast (median 6d on market — plan ~1-2 weeks tenant-placement turnaround); solid renter incomes; 3,927 units permitted in Arapahoe County in 2024 (1,525 in 5+ unit buildings).
Forward outlook
- Local home prices are declining (-3.0%/yr); year-one equity from $1k of loan paydown is wiped out by about $5k of value loss. Plan a longer hold.
- Arapahoe County population projected at +39% by 2050 — long-run rental-demand tailwind backs the buy-and-hold thesis.
Negotiation context
- It's been on market 414 days — a 12% lower offer ($140k) is reasonable based on typical stale-listing flexibility.
Risks & watch-outs
- Watch-outs: flood insurance adds $66/mo.
- Climate carrying-cost: major flood risk — expect insurance premiums to compound above CPI over the hold.
Questions for the listing agent
- It's been on market 414 days. Have you received any prior offers? Is the seller open to a 12% concession, seller financing, or rate buy-down credit?
- What's the actual annual flood-insurance premium (NFIP or private), and is the property in a SFHA with mandatory coverage?
- Why hasn't it sold? Are there any deal-killer items the seller is aware of (foundation, flood, title, zoning, code violations)?
- Is there a deadline driving the sale (1031 exchange, divorce, estate, relocation)? That informs how much negotiation room exists.
- Schools are D-rated, which usually means shorter tenancies and higher turnover. Who's the typical renter profile here, and what's been the actual vacancy rate?
- Crime grade is F in this area — have there been break-ins, vandalism, or insurance claims at this property in the last 3 years? What carrier currently insures it and at what premium?
- The area grade is low — what's the realistic commute time and amenity access for the typical tenant pool here? Any planned neighborhood developments (good or bad) we should know about?
- What's the average days-on-market for RENTAL listings here right now (not sales)? A rising rental-DOM trend means longer vacancies and softer asking-rent achievability than the comps imply.
- What's the recent tenant-quality profile in this submarket — average credit score on applications, eviction rate, late-payment / NSF rate, and stable-employment percentage? A property-management company in the area should have these aggregated.
- How much new for-sale + rental construction is in the pipeline within 1–3 miles? Heavy new supply typically softens prices + rents 12–24 months out; constrained supply supports both.
Investment metrics
- 1% rule
- 0.97% ✗
- Cap rate
- 7.17%
- Cash-on-cash
- 3.14%
- DSCR
- 1.14
- GRM
- 8.6
CMA / ARV
- ARV (on-the-fly)
- $95,040
- Comps found
- 2
Show comp detail 2 sales within ~0.75 mi
| Address | Dist | Beds/Ba | Sqft | Sold | Price | $/sf | Match |
|---|---|---|---|---|---|---|---|
| 3654 S Federal Blvd | 0.18mi | 3/1.0 (+1) | 924 (-4%) | 4mo | $37,000 | $40 | 73 |
| 3650 S Federal Blvd #109 | 0.18mi | 2/2.0 | 840 (-12%) | 8mo | $83,000 | $99 | 64 |
Match score weights: distance 35% · size 25% · config 20% · recency 20%. Top-matched comps best support the ARV.
Projected returns pro-forma
-3.0% appreciation · 0.0% rent growth · sell at horizon
- IRR
- -17.7%
- Equity multiple
- 0.39×
- Total profit
- $-27,030
- Equity at exit
- $23,707
- IRR
- -17.5%
- Equity multiple
- 0.18×
- Total profit
- $-36,605
- Equity at exit
- $13,747
Cash invested: $44,520 (down + closing). Projections, not guarantees.
Landlord ↔ Tenant lean methodology
- Overall (STATE)
- 38 Tenant-Leaning
- State Colorado
- 38 Tenant-Leaning · D+4
- County
- — inherits STATE
- City
- — inherits STATE
ZIP-level market 80110
- Rents YoY
- -0.8%
- Active inventory
- 106
- Price-to-rent
- 8.6×
Monthly cashflow live
- Estimated rent
- $1,538 high interval (Pro) →
- Mortgage (P&I)
- −$834
- Tax est. 1.5%
- −$199 /mo · $2,385/yr
- Insurance
- −$66
- Flood insurance flood zone
- −$66 /mo · $798/yr
- HOA
- −$0
- Vacancy / Maint / Mgmt
- −$323
- Net cashflow
- $50
Break-even live
Sensitivity live
| Price | -10% $160 | -5% $105 | +0% $50 | +5% $-5 | +10% $-60 |
|---|---|---|---|---|---|
| Rent | -10% $-72 | -5% $-11 | +0% $50 | +5% $111 | +10% $171 |
| Rate | -1.0pp $130 | -0.5pp $90 | base $50 | +0.5pp $9 | +1.0pp $-33 |
UW: 25.0% down · 7.5% · 30yr · 1.5% tax · 5.0% vac · 8.0% maint · 8.0% mgmt
Financing live
Cash to close
- Down payment
- $39,750
- Closing costs
- $4,770
- Reserves months
- —
- Total cash needed
- —
Loan-product check · same deal, 3 products live
Conventional
25% down · 7.5% · 30yr
- Down + closing
- —
- Monthly P&I
- —
- Monthly cashflow
- —
- DSCR
- —
- Eligible?
- —
Personal DTI + credit; lowest rate.
DSCR
20% down · 8.5% · 30yr
- Down + closing
- —
- Monthly P&I
- —
- Monthly cashflow
- —
- DSCR
- —
- Eligible?
- —
No personal income docs; deal must DSCR.
Hard money
10% down · 12.0% · 12mo
- Down + closing
- —
- Monthly P&I
- —
- Monthly cashflow
- —
- DSCR
- —
- Eligible?
- —
Short-term bridge; refi at stabilization.
Rent comps 24 comps
| Address | Beds | Baths | Sqft | Rent | $/sqft | DOM | Units | Dist |
|---|---|---|---|---|---|---|---|---|
| 3740 S Federal Blvd Englewood, CO | 1.0 | 1.0 | 600 | $1,362 | $2.27 | 5d | 5 | 0.25mi |
| 3477 S Bryant St Englewood, CO | 3.0 | 1.0 | 1110 | $2,595 | $2.34 | 26d | 1 | 0.28mi |
| 3390 S Clay St Unit 1 Englewood, CO | 2.0 | 1.0 | 800 | $1,450 | $1.81 | 0d | 1 | 0.31mi |
| 3041 W Hamilton Pl Unit 3 Englewood, CO | 1.0 | 1.0 | 650 | $925 | $1.42 | 0d | 1 | 0.33mi |
| 3041 W Hamilton Pl Unit 3 Englewood, CO | 1.0 | 1.0 | 650 | $950 | $1.46 | 6d | 1 | 0.33mi |
| 3773 S Grove St Englewood, CO | 1.0 | 1.0 | 1000 | $1,300 | $1.30 | 26d | 1 | 0.38mi |
| 3171 W Girard Ave Englewood, CO | 2.0 | 1.0–2.0 | 863 | $1,576 | $1.83 | 26d | 1 | 0.44mi |
| 2024 W Hamilton Pl Englewood, CO | 2.0 | 1.0 | 960 | $1,700 | $1.77 | 26d | 1 | 0.55mi |
| 3605 S Knox Ct Denver, CO | 1.0 | 1.0 | 650 | $999 | $1.54 | 4d | 1 | 0.56mi |
| 3615 S Knox Ct Unit 204 Denver, CO | 1.0 | 1.0 | 650 | $999 | $1.54 | 5d | 1 | 0.57mi |
| 3839 S Knox Ct Denver, CO | 1.0 | 1.0 | 700 | $1,100 | $1.57 | 26d | 1 | 0.62mi |
| 3839 S Knox Ct Unit EAST-1 Denver, CO | 1.0 | 1.0 | 700 | $1,100 | $1.57 | 26d | 1 | 0.62mi |
| 3824 S King St Unit 3828 Denver, CO | 2.0 | 1.0 | 722 | $1,395 | $1.93 | 26d | 1 | 0.64mi |
| 3600 S Lowell Blvd Denver, CO | 1.0–2.0 | 1.0 | 762 | $1,409 | $1.85 | 0d | 3 | 0.66mi |
| 3660 S Lowell Blvd Denver, CO | 1.0 | 1.0 | 600 | $1,340 | $2.23 | 26d | 1 | 0.66mi |
| 3680 S Lowell Blvd Denver, CO | 1.0 | 1.0 | 650 | $1,100 | $1.69 | 4d | 1 | 0.67mi |
| 4100 S Hooker St Denver, CO | 2.0–3.0 | 1.0 | 1050 | $1,549 | $1.48 | 14d | 1 | 0.79mi |
| 3488 W Quincy Ave Englewood, CO | 1.0–3.0 | 1.0–2.0 | 853 | $1,650 | $1.93 | 26d | 1 | 1.05mi |
| 3400 S Platte River Dr Englewood, CO | 1.0–2.0 | 1.0–2.0 | 911 | $1,987 | $2.18 | 0d | 20 | 1.09mi |
| 3595 S Jason St Englewood, CO | 2.0 | 1.0–2.0 | 883 | $3,018 | $3.42 | 3d | 34 | 1.21mi |
| 4671 S Decatur St #129 Englewood, CO | 1.0 | 1.0 | 684 | $1,500 | $2.19 | 18d | 1 | 1.29mi |
| 4681 S Decatur St Englewood, CO | 1.0 | 1.0 | 648 | $1,295 | $2.00 | 0d | 1 | 1.30mi |
| 801 Englewood Pkwy Englewood, CO | 1.0–3.0 | 1.0–2.0 | 1015 | $2,158 | $2.13 | 0d | 41 | 1.38mi |
| 3237 S Huron St Englewood, CO | 2.0 | 1.0 | 828 | $1,740 | $2.10 | 0d | 1 | 1.39mi |
Listing history 14 events
-
2026-06-21days on market $159,000 Active 414 DOM
-
2026-06-18days on market $159,000 Active 411 DOM
-
2026-06-17days on market $159,000 Active 410 DOM
-
2026-06-16days on market $159,000 Active 409 DOM
-
2026-06-15days on market $159,000 Active 408 DOM
-
2026-06-13days on market $159,000 Active 406 DOM
-
2026-06-09days on market $159,000 Active 402 DOM
-
2026-06-08days on market $159,000 Active 401 DOM
-
2026-06-07days on market $159,000 Active 400 DOM
-
2026-06-04days on market $159,000 Active 397 DOM
-
2026-06-03days on market $159,000 Active 396 DOM
-
2026-06-02days on market $159,000 Active 395 DOM
-
2026-06-01days on market $159,000 Active 394 DOM
-
2026-05-31days on market $159,000 Active 393 DOM
ⓘ Source: listings_history table (triggers on properties + properties_extension) + one-shot
backfill from property_details.listing_events for pre-trigger history.
Climate risk First Street
- Flood 7/10 Severe FEMA zone X (shaded) · 99% chance over 30 yrs
- Wildfire 2/10 Low
- Heat 3/10 Moderate 7 d/yr ≥91°F today · 19 d/yr by 30 yrs out
- Wind 2/10 Low
- Air quality 3/10 Moderate 2 unhealthy d/yr today · 3 by 30 yrs out
Nearby sold comps map
Loading sold comps map…
Walkable amenities ~0.75 mi
Loading nearby amenities…
Taxation est. · year 1
- Rental income
- $18,458
- − Mortgage interest
- −$8,906
- − Property taxes
- −$2,385
- − Insurance
- −$1,592
- − Repairs & maintenance
- −$1,477
- − Management
- −$1,477
- − Depreciation
- −$4,625
- Taxable loss
- −$2,004
- Est. tax savings @ 24.0%
- +$481
- After-tax cash flow
- $1,080/yr
For passive investors: Depreciation is non-cash, so a rental often shows a tax loss while cash-flowing — sheltering income. Rental losses are passive: they offset passive income freely, and up to $25,000/yr can offset ordinary (W-2) income if you actively participate and your MAGI is under $100k (phasing out to $0 by $150k); unused losses carry forward. On sale, claimed depreciation is recaptured at up to 25%, and gains may owe capital-gains tax (a 1031 exchange can defer both). Figures are a year-1 estimate at your 24.0% rate — not tax advice; consult a CPA.
Schools (NCES district)
- District
- Sheridan School District No. 2
- NCES district ID
- 0806540
- Math proficiency
- 4% ▼ -6.00%
- Reading proficiency
- 20% ▲ 1.00%
- Median HH income
- $37,378
- Composite
- 10.01/100
- National rank
- #9810
- State rank
- #85 of 86 in CO
Livability — Sheridan
- Score
- 63/100
- State rank
- #197
- US rank
- #16046
Category grades
Schools grade is shown separately in the Schools card above.
Census & demographics
- Census place
- Sheridan, CO
- County
- Arapahoe County · 715,018 people
- City population
- 23,825
- Metro
- Denver-Aurora-Lakewood, CO
- Population (ZIP)
- 23,825
- Household income
- $85,900
- Rent vs Own
- Severe rent burden
- 773.0
Population outlook (Arapahoe County) Hauer SSP2
- Today (2025)
- 757,407 people
- By 2030
- 819,724 · +8.2%
- By 2040
- 940,367 · +24.2%
- By 2050
- 1,053,720 · +39.1%
- By 2075
- 1,297,693 · +71.3%
- By 2100
- 1,412,796 · +86.5%
Race, ethnicity, and origin ACS 2023
- Neighborhood character
- Majority White (62%)
- Race & ethnicity
- White 62% Hispanic / Latino 26% Two or more races 12% Black 4% Asian 3% Native American 1%
- Hispanic origin (detail)
- Mexican 18%
- Common ancestry
- Italian 3% Lithuanian 2% Portuguese 2%
- Foreign-born
- 8% · Canada, Vietnam, China
- Languages at home
- 81% English-only · Spanish 13% Other Indo-European 2% Other Asian/Pacific 1%
Political lean MEDSL · Arapahoe
- 2024 margin
- Strong D (+20.1) · D 58.6% · R 38.5% · Other 2.9%
- 2008→2024 swing
- +7.2pp toward D · 2008: 12.9pp · 2024: 20.1pp
- All cycles
- 2024: D+20.1 2020: D+24.6 2016: D+13.8 2012: D+8.3 2008: D+12.9
Not yet ingested
- Civics
- —
Market trends
- HPI YoY
- ▼ -548.46%
- Current HPI
- 296.0714
- Rent YoY
- ▼ -0.85%
- Metro
- Denver-Aurora-Lakewood, CO
- State GDP YoY
- ▲ 1.95%
- F500 in state
- 14
Industry mix (Fortune 500 HQ in CO)
| Industry | F500 HQs | Revenue |
|---|---|---|
| Technology Distribution | 1 | $31B |
|
||
| Food / Agriculture | 1 | $18B |
|
||
| Packaging | 1 | $14B |
|
||
| Healthcare | 1 | $13B |
|
||
| Energy | 1 | $10B |
|
||
| Technology | 1 | $4B |
|
||
Cash-flow waterfall
monthlySold comps — $/sqft
last 12 mo · ≤1 miLoading sold comps…