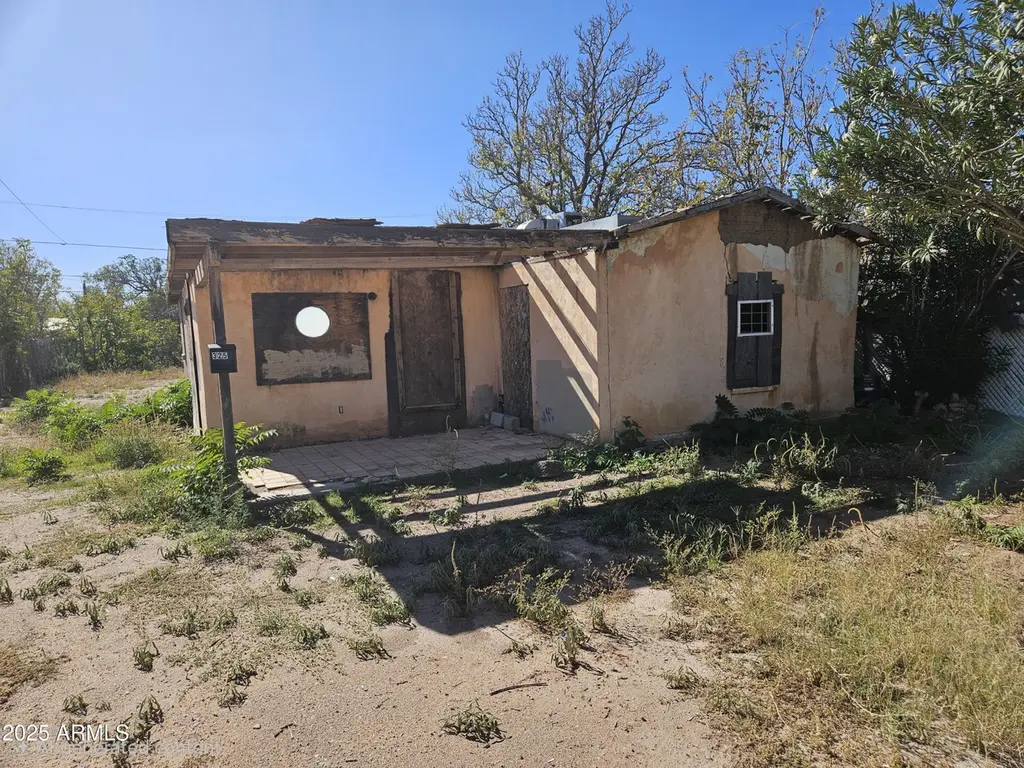
325 E 8th St · Douglas, AZ
Flood risk 1/10 · Minimal
- FEMA flood zone
- X (shaded)
- Chance of flooding over 30 yrs
- 0.0%
- Est. flood insurance / yr
- $507 – $1,088
Fire risk 7/10 · Major
- Est. fire insurance / yr
- $610 – $1,132
Heat risk 6/10 · Moderate
- Hot days now (above 99°F)
- 5 days/yr
- Hot days in 30 yrs
- 14 days/yr
Wind risk 1/10 · Minimal
- Chance of severe wind over 30 yrs
- —
Air-quality risk 1/10 · Minimal
- Unhealthy air days now
- 0 days/yr
- Unhealthy air days in 30 yrs
- 0 days/yr
Risk factors via First Street. Map © Google.
Why this score? — see what drove the B grade
The composite is a weighted blend of 9 inputs, each scored 0–100. Each bar is that input's sub-score; the figure is the points it added to the 100-point composite (weight × sub-score).
- Cash flow +27.8/30.0
- ARV discount +15.0/15.0
- DSCR +9.8/10.0
- 1% rule +7.6/10.0
- Livability +3.5/5.0
- Rent growth +2.5/5.0
- Condition / age +2.5/5.0
- Schools +1.3/10.0
- Appreciation +0.0/10.0
$70,000
🖨 Deal sheet 📄 Offer letter ✓ Due diligence
Listing remarks MLS
Currently the 7,095 sq ft lot is General Commercial, potential buyers to confirm all details.
Key facts
- 7,095 sq ft lot
- Built 1933
- Listed 216 days
Neighborhood map
What this means for you Summary
Snapshot
- This is a 3-bed/1.0-bath single-family listed at $70k.
Deal economics
- At list price, monthly cash flow is $214 ($3k/yr) — positive.
- The deal already cash-flows at list — no discount required.
- Meets the 1% rule at list price ($884 rent vs $70k).
- Recommended offer: $62k (12.0% below list) — sets the bar for market timing.
- Cap rate 10.0% vs local median 4.3% in Douglas — top-decile yield for the area; either an underpriced asset or a hidden risk that comps aren't pricing in. Stress-test before assuming the spread holds.
Location & tenants
- Location reads 70/100 on livability (#39 in AZ) — a middle-class / working-renter tenant base. Strengths: cost of living A+, housing A+, crime A; Watch: schools D, amenities D-, commute F.
- Douglas Unified District (4174) (town): math 9% / reading 24% proficiency, ranked #209 of 249 in AZ (top 84%) — low school quality limits family demand, transient renter base, plan for 1-2y turnover; 72% free/reduced lunch — lower-income household profile, screen leases tightly.
- Market conditions: 163 active listings in the ZIP; 6 comparable units currently listed for rent nearby; rentals lingering (median 44d on market — plan ~5-8 weeks vacancy on turnover, expect pricing pressure); 100% of comp listings sitting > 30 days — soft ceiling on asking rent; 437 units permitted in Cochise County in 2024 (6 in 5+ unit buildings).
Forward outlook
- Local home prices are declining (-3.0%/yr); year-one equity from $484 of loan paydown is wiped out by about $2k of value loss. Plan a longer hold.
- Cochise County population projected at -30% by 2050 — secular population decline; favor cash flow + early exit over multi-decade hold.
- At projected returns (-3.0% appreciation + 3.0% rent growth), your $20k cash investment doubles in ~9 years — after that, you're playing with house money.
Negotiation context
- It's been on market 217 days — a 12% lower offer ($62k) is reasonable based on typical stale-listing flexibility.
- 4 sale attempts since 3y ago; this cycle's ask is 21% above the opening price — seller raised mid-cycle; expect resistance to lowballs.
Risks & watch-outs
- Watch-outs: built in 1933 — expect roof / HVAC / electrical / plumbing capex.
- Climate carrying-cost: major wildfire risk; extreme-heat days projected 5→14/yr by 2055 (HVAC capex compounding) — expect insurance premiums to compound above CPI over the hold.
Questions for the listing agent
- It's been on market 217 days. Have you received any prior offers? Is the seller open to a 12% concession, seller financing, or rate buy-down credit?
- Built in 1933 — when were the roof, HVAC, electrical panel, plumbing, and water heater last replaced?
- Why hasn't it sold? Are there any deal-killer items the seller is aware of (foundation, flood, title, zoning, code violations)?
- Is there a deadline driving the sale (1031 exchange, divorce, estate, relocation)? That informs how much negotiation room exists.
- Schools are D-rated, which usually means shorter tenancies and higher turnover. Who's the typical renter profile here, and what's been the actual vacancy rate?
- What's the average days-on-market for RENTAL listings here right now (not sales)? A rising rental-DOM trend means longer vacancies and softer asking-rent achievability than the comps imply.
- What's the recent tenant-quality profile in this submarket — average credit score on applications, eviction rate, late-payment / NSF rate, and stable-employment percentage? A property-management company in the area should have these aggregated.
- How much new for-sale + rental construction is in the pipeline within 1–3 miles? Heavy new supply typically softens prices + rents 12–24 months out; constrained supply supports both.
Investment metrics
- 1% rule
- 1.26% ✓
- Cap rate
- 9.97%
- Cash-on-cash
- 13.13%
- DSCR
- 1.58
- GRM
- 6.6
CMA / ARV
- ARV (median comp)
- $110,211
- List price
- $70,000
- Delta
- -36.49%
- Verdict
- UNDERPRICED
- Comps
- 20 within 1.0 mi
Show comp detail 2 sales within ~0.75 mi
| Address | Dist | Beds/Ba | Sqft | Sold | Price | $/sf | Match |
|---|---|---|---|---|---|---|---|
| 750 A Ave | 0.66mi | 2/2.0 (-1) | 866 (+9%) | 12mo | $159,000 | $184 | 35 |
| 323 E 17th St | 0.64mi | 2/1.0 (-1) | 702 (-12%) | 16mo | $107,000 | $152 | 32 |
Match score weights: distance 35% · size 25% · config 20% · recency 20%. Top-matched comps best support the ARV.
Projected returns pro-forma
-3.0% appreciation · 3.0% rent growth · sell at horizon
- IRR
- 3.1%
- Equity multiple
- 1.12×
- Total profit
- $2,328
- Equity at exit
- $10,437
- IRR
- 12.6%
- Equity multiple
- 2.00×
- Total profit
- $19,668
- Equity at exit
- $6,052
Cash invested: $19,600 (down + closing). Projections, not guarantees.
Landlord ↔ Tenant lean methodology
- Overall (STATE)
- 87 Strongly Landlord-Friendly
- State Arizona
- 87 Strongly Landlord-Friendly · R+3
- County
- — inherits STATE
- City
- — inherits STATE
ZIP-level market 85607
- Active inventory
- 163
- Price-to-rent
- 6.6×
Monthly cashflow live
- Estimated rent
- $884 high interval (Pro) →
- Mortgage (P&I)
- −$367
- Tax est. 1.5%
- −$88 /mo · $1,050/yr
- Insurance
- −$29
- HOA
- −$0
- Vacancy / Maint / Mgmt
- −$186
- Net cashflow
- $214
Break-even live
UW: 25.0% down · 7.5% · 30yr · 1.5% tax · 5.0% vac · 8.0% maint · 8.0% mgmt
Financing live
Cash to close
- Down payment
- $17,500
- Closing costs
- $2,100
- Reserves months
- —
- Total cash needed
- —
Loan-product check · same deal, 3 products live
Conventional
25% down · 7.5% · 30yr
- Down + closing
- —
- Monthly P&I
- —
- Monthly cashflow
- —
- DSCR
- —
- Eligible?
- —
Personal DTI + credit; lowest rate.
DSCR
20% down · 8.5% · 30yr
- Down + closing
- —
- Monthly P&I
- —
- Monthly cashflow
- —
- DSCR
- —
- Eligible?
- —
No personal income docs; deal must DSCR.
Hard money
10% down · 12.0% · 12mo
- Down + closing
- —
- Monthly P&I
- —
- Monthly cashflow
- —
- DSCR
- —
- Eligible?
- —
Short-term bridge; refi at stabilization.
Rent comps 6 comps
| Address | Beds | Baths | Sqft | Rent | $/sqft | DOM | Units | Dist |
|---|---|---|---|---|---|---|---|---|
| 834 E 5th St Douglas, AZ | 2.0 | 2.0 | 862 | $875 | $1.02 | 43d | 1 | 0.50mi |
| 703 E 13th St Douglas, AZ | 2.0 | 1.0 | 1125 | $1,000 | $0.89 | 43d | 1 | 0.50mi |
| 938 E 12th St Douglas, AZ | 2.0 | 1.0 | 731 | $795 | $1.09 | 43d | 1 | 0.66mi |
| 902 E 13th St Douglas, AZ | 2.0 | 1.0 | 900 | $800 | $0.89 | 43d | 1 | 0.66mi |
| 1165 E 10th St Unit 3 Douglas, AZ | 3.0 | 1.0 | 1000 | $900 | $0.90 | 43d | 1 | 0.77mi |
| 1134 E 23rd St Douglas, AZ | 2.0 | 1.0 | 960 | $1,000 | $1.04 | 43d | 1 | 1.33mi |
Listing history 25 events
-
2026-06-19days on market $70,000 Active 217 DOM
-
2026-06-18days on market $70,000 Active 216 DOM
-
2026-06-17days on market $70,000 Active 215 DOM
-
2026-06-16days on market $70,000 Active 214 DOM
-
2026-06-15days on market $70,000 Active 213 DOM
-
2026-06-14days on market $70,000 Active 211 DOM
-
2026-06-12days on market $70,000 Active 210 DOM
-
2026-06-09days on market $70,000 Active 207 DOM
-
2026-06-08days on market $70,000 Active 206 DOM
-
2026-06-07days on market $70,000 Active 205 DOM
-
2026-06-04days on market $70,000 Active 201 DOM
-
2026-06-02days on market $70,000 Active 200 DOM
-
2026-06-01days on market $70,000 Active 199 DOM
-
2026-05-31days on market $70,000 Active 198 DOM
-
2026-05-31days on market $70,000 Active 197 DOM
-
2026-05-13status Active 93-char remark
Show marketing remark (93 chars)
Currently the 7,095 sq ft lot is General Commercial, potential buyers to confirm all details.
-
2026-05-11status Pending 93-char remark
Show marketing remark (93 chars)
Currently the 7,095 sq ft lot is General Commercial, potential buyers to confirm all details.
-
2026-03-09price $56,000 93-char remark
Show marketing remark (93 chars)
Currently the 7,095 sq ft lot is General Commercial, potential buyers to confirm all details.
-
2025-11-11$58,000 Active 93-char remark
Show marketing remark (93 chars)
Currently the 7,095 sq ft lot is General Commercial, potential buyers to confirm all details.
-
2024-06-12status Pending
-
2024-06-12$50,000 Active
-
2024-06-12historical
-
2024-05-18status Pending
-
2023-12-18price $50,000
-
2023-07-11$55,000 Active
ⓘ Source: listings_history table (triggers on properties + properties_extension) + one-shot
backfill from property_details.listing_events for pre-trigger history.
Climate risk First Street
- Flood 1/10 Low FEMA zone X (shaded) · 0% chance over 30 yrs
- Wildfire 7/10 Severe
- Heat 6/10 Major 5 d/yr ≥99°F today · 14 d/yr by 30 yrs out
- Wind 1/10 Low
- Air quality 1/10 Low 0 unhealthy d/yr today · 0 by 30 yrs out
Nearby sold comps map
Loading sold comps map…
Walkable amenities ~0.75 mi
Loading nearby amenities…
Taxation est. · year 1
- Rental income
- $10,605
- − Mortgage interest
- −$3,921
- − Property taxes
- −$1,050
- − Insurance
- −$350
- − Repairs & maintenance
- −$848
- − Management
- −$848
- − Depreciation
- −$2,036
- Taxable income
- $1,551
- Est. tax owed @ 24.0%
- −$372
- After-tax cash flow
- $2,201/yr
For passive investors: Depreciation is non-cash, so a rental often shows a tax loss while cash-flowing — sheltering income. Rental losses are passive: they offset passive income freely, and up to $25,000/yr can offset ordinary (W-2) income if you actively participate and your MAGI is under $100k (phasing out to $0 by $150k); unused losses carry forward. On sale, claimed depreciation is recaptured at up to 25%, and gains may owe capital-gains tax (a 1031 exchange can defer both). Figures are a year-1 estimate at your 24.0% rate — not tax advice; consult a CPA.
Schools (NCES district)
- District
- Douglas Unified District (4174)
- NCES district ID
- 0402530
- Math proficiency
- 9% ▼ -19.00%
- Reading proficiency
- 24% ▼ -7.00%
- Median HH income
- $29,006
- Composite
- 12.94/100
- National rank
- #9577
- State rank
- #209 of 249 in AZ
Livability — Douglas
- Score
- 70/100
- State rank
- #39
- US rank
- #7635
Category grades
Schools grade is shown separately in the Schools card above.
Census & demographics
- Census place
- Douglas, AZ
- Population (ZIP)
- 17,009
Population outlook (Cochise County) Hauer SSP2
- Today (2025)
- 113,402 people
- By 2030
- 106,197 · -6.4%
- By 2040
- 92,166 · -18.7%
- By 2050
- 79,805 · -29.6%
- By 2075
- 56,831 · -49.9%
- By 2100
- 35,103 · -69.0%
Race, ethnicity, and origin ACS 2023
- Neighborhood character
- Predominantly Hispanic (88%)
- Race & ethnicity
- Hispanic / Latino 88% Two or more races 45% White 8% Native American 2%
- Hispanic origin (detail)
- Mexican 85%
- Foreign-born
- 26% · Canada, Vietnam
- Languages at home
- 24% English-only · Spanish 74% Vietnamese 1%
Political lean MEDSL · Cochise
- 2024 margin
- Strong R (+23.1) · D 37.8% · R 61.0% · Other 1.2%
- 2008→2024 swing
- -2.5pp toward R · 2008: -20.7pp · 2024: -23.1pp
- All cycles
- 2024: R+23.1 2020: R+19.6 2016: R+22.6 2012: R+24.0 2008: R+20.7
Not yet ingested
- Civics
- —
Market trends
- HPI YoY
- ▼ -89.92%
- Current HPI
- 147.0847
- Rent YoY
- —
- Metro
- —
- State GDP YoY
- ▲ 4.54%
- F500 in state
- 20
Industry mix (Fortune 500 HQ in AZ)
| Industry | F500 HQs | Revenue |
|---|---|---|
| Technology | 2 | $13B |
|
||
| Mining / Metals | 1 | $23B |
|
||
| Environmental Services | 1 | $16B |
|
||
| Metals / Steel | 1 | $14B |
|
||
| Technology Distribution | 1 | $9B |
|
||
| Homebuilding | 1 | $8B |
|
||
Price history
+1.8% since first listed10 events — show timeline
- 2026-05-13 Relisted — ARMLS
- 2026-05-11 Pending — ARMLS
- 2026-03-09 Price Changed $56,000 ARMLS
- 2025-11-11 Listed $58,000 ARMLS
- 2024-06-12 Pending — ARMLS
- 2024-06-12 Listed $50,000 ARMLS
- 2024-06-12 Listing Removed — ARMLS
- 2024-05-18 Pending — ARMLS
- 2023-12-18 Price Changed $50,000 ARMLS
- 2023-07-11 Listed $55,000 ARMLS
Property tax history
-7.4%/yrLatest (2025): $109 · -2.5% YoY. Source: county tax records.
Cash-flow waterfall
monthlySold comps — $/sqft
last 12 mo · ≤1 miLoading sold comps…