610 Taylor Ave · Evansville, IN
Flood risk 6/10 · Moderate
- FEMA flood zone
- X
- Chance of flooding over 30 yrs
- 0.68%
- Est. flood insurance / yr
- $473 – $860
Fire risk 1/10 · Minimal
- Est. fire insurance / yr
- $717 – $1,331
Heat risk 5/10 · Moderate
- Hot days now (above 107°F)
- 7 days/yr
- Hot days in 30 yrs
- 18 days/yr
Wind risk 2/10 · Minimal
- Chance of severe wind over 30 yrs
- 3.0%
Air-quality risk 4/10 · Minor
- Unhealthy air days now
- 3 days/yr
- Unhealthy air days in 30 yrs
- 5 days/yr
Risk factors via First Street. Map © Google.
Why this score? — see what drove the C+ grade
The composite is a weighted blend of 9 inputs, each scored 0–100. Each bar is that input's sub-score; the figure is the points it added to the 100-point composite (weight × sub-score).
- Cash flow +24.8/30.0
- ARV discount +12.2/15.0
- DSCR +8.0/10.0
- 1% rule +5.4/10.0
- Rent growth +5.0/5.0
- Schools +3.3/10.0
- Livability +3.2/5.0
- Condition / age +2.5/5.0
- Appreciation +0.0/10.0
$129,900
🖨 Deal sheet 📄 Offer letter ✓ Due diligence
Listing remarks
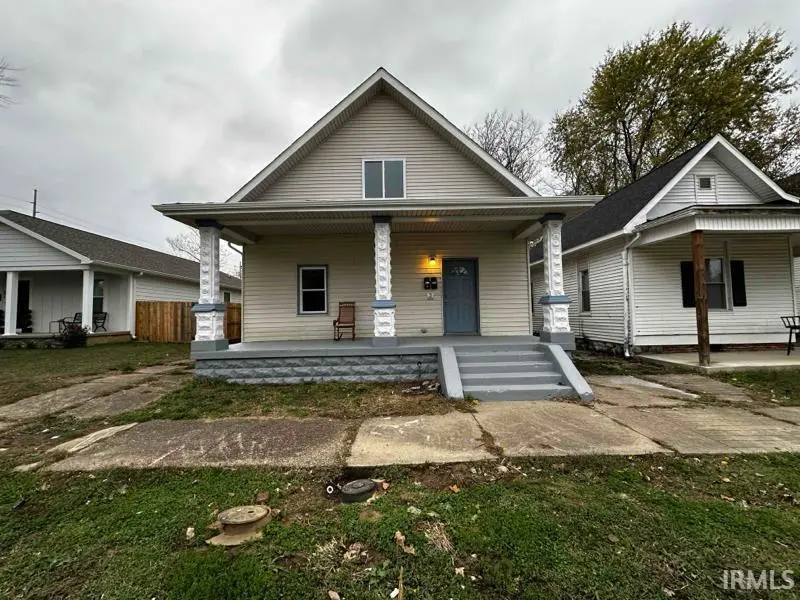
Great investment opportunity at 610 Taylor in Evansville! This well-maintained duplex features two income-producing units: Unit A offers 2 bedrooms and 1 bath, which was previously rented for $1,000/month, while Unit B is a 1 bedroom, 1 bath unit rented for $695/month. Unit B has been recently updated throughout and is occupied by a new tenant, providing added appeal and reduced near-term maintenance. Property includes a detached garage in the rear—an attractive bonus for tenants and potential for additional value. Owner currently covers water, sewer, and trash, averaging approximately $107/month. Each unit is equipped with a refrigerator and range provided by the owner. A solid addit
Key facts
- Recently updated
- Recent improvements
- Detached garage
Tags
Property features AI
Finance
- Other: Pets allowed
Exterior
- Parking: Garage; On-street parking; 2 open parking spaces
- Utilities: Public water; Public sewer
- Home design: Duplex (residential income); 2 stories; Entry level information not provided; Facing direction not provided
- Construction: Vinyl siding; Brick/mortar foundation; Shingle roof; Built year not provided
- Exterior features: Covered patio/porch; Level lot
Interior
- Kitchen: Range; Refrigerator
- Flooring: Vinyl
- Bathrooms: 2 full bathrooms; 4 main-level bathrooms
- Heating & cooling: Natural gas heating; Central air conditioning
- Interior features: Range; Refrigerator; Vinyl flooring; Partial basement
- Laundry & utility: Washer hookup
Neighborhood map
What this means for you Summary
Snapshot
- This is a 3-bed/2.0-bath single-family listed at $130k.
Deal economics
- At list price, monthly cash flow is $275 ($3k/yr) — positive.
- The deal already cash-flows at list — no discount required.
- Meets the 1% rule at list price ($1k rent vs $130k).
- Recommended offer: $126k (3.0% below list) — sets the bar for market timing.
- Cap rate 8.8% vs local median 4.6% in Evansville — top-decile yield for the area; either an underpriced asset or a hidden risk that comps aren't pricing in. Stress-test before assuming the spread holds.
Location & tenants
- Location reads 63/100 on livability (#416 in IN) — a middle-class / working-renter tenant base. Strengths: cost of living A+, housing A+, health & safety A+; Watch: crime F, commute F, employment D-.
- Evansville Vanderburgh School Corporation (urban): math 36% / reading 43% proficiency, ranked #153 of 301 in IN (top 51%) — families likely to look elsewhere, expect single-tenant / working-renter base with shorter leases.
- Zoned schools: Glenwood Leadership Academy (math 10% / reading 12%, grade F, #909 of 994 statewide, top 92%, 416 students, 88% FRL) — zoned schools average 88% FRL vs 50% district-wide (38 pts higher); higher-poverty schools than district average — tighter screening recommended.
- Zoned-school proficiency averages 11% at this address vs 40% district-wide (-28 pts) — the specific schools serving this property underperform the Evansville Vanderburgh School Corporation average; the district grade overstates school quality for this exact location.
- Market conditions: Rents rising fast (+9.9%/yr); 118 active listings in the ZIP; 1 comparable units currently listed for rent nearby; lower-income renter base — watch delinquency; 508 units permitted in Vanderburgh County in 2024 (32 in 5+ unit buildings).
- This rent runs 40% of the median local income ($41k/yr) — at the standard rent-burdened threshold; future hikes will face affordability resistance.
Forward outlook
- Local home prices are declining (-3.0%/yr); year-one equity from $898 of loan paydown is wiped out by about $4k of value loss. Plan a longer hold.
- At projected returns (-3.0% appreciation + 8.0% rent growth), your $36k cash investment doubles in ~8 years — after that, you're playing with house money.
Negotiation context
- It's been on market 51 days — a 3% lower offer ($126k) is reasonable based on typical stale-listing flexibility.
Risks & watch-outs
- Watch-outs: built in 1919 — expect roof / HVAC / electrical / plumbing capex.
- Climate carrying-cost: major flood risk; extreme-heat days projected 7→18/yr by 2055 (HVAC capex compounding) — expect insurance premiums to compound above CPI over the hold.
Questions for the listing agent
- It's been on market 51 days. Have you received any prior offers? Is the seller open to a 3% concession, seller financing, or rate buy-down credit?
- Built in 1919 — when were the roof, HVAC, electrical panel, plumbing, and water heater last replaced?
- Is there a deadline driving the sale (1031 exchange, divorce, estate, relocation)? That informs how much negotiation room exists.
- Schools are D-rated, which usually means shorter tenancies and higher turnover. Who's the typical renter profile here, and what's been the actual vacancy rate?
- Crime grade is F in this area — have there been break-ins, vandalism, or insurance claims at this property in the last 3 years? What carrier currently insures it and at what premium?
- What's the average days-on-market for RENTAL listings here right now (not sales)? A rising rental-DOM trend means longer vacancies and softer asking-rent achievability than the comps imply.
- What's the recent tenant-quality profile in this submarket — average credit score on applications, eviction rate, late-payment / NSF rate, and stable-employment percentage? A property-management company in the area should have these aggregated.
- How much new for-sale + rental construction is in the pipeline within 1–3 miles? Heavy new supply typically softens prices + rents 12–24 months out; constrained supply supports both.
Investment metrics
- 1% rule
- 1.04% ✓
- Cap rate
- 8.83%
- Cash-on-cash
- 9.07%
- DSCR
- 1.40
- GRM
- 8.0
CMA / ARV
- ARV (on-the-fly)
- $145,124
- Comps found
- 12
Show comp detail 12 sales within ~0.75 mi
| Address | Dist | Beds/Ba | Sqft | Sold | Price | $/sf | Match |
|---|---|---|---|---|---|---|---|
| 308 Madison Ave | 0.31mi | 4/1.0 (+1) | 2,045 (0%) | 7mo | $77,000 | $38 | 70 |
| 929 S Garvin St | 0.41mi | 4/2.0 (+1) | 2,007 (-2%) | 7mo | $110,000 | $55 | 67 |
| 637 Adams Ave | 0.29mi | 3/2.0 | 1,769 (-14%) | 0mo | $260,000 | $147 | 63 |
| 820 Taylor Ave | 0.28mi | 3/1.5 | 1,820 (-11%) | 6mo | $128,750 | $71 | 61 |
| 758-760 S Evans Ave | 0.69mi | 3/2.0 | 1,992 (-2%) | 6mo | $115,000 | $58 | 59 |
| 1012 S Linwood Ave | 0.36mi | 4/2.0 (+1) | 1,818 (-11%) | 5mo | $51,000 | $28 | 56 |
| 606 E Gum St | 0.69mi | 3/2.0 | 1,920 (-6%) | 3mo | $165,000 | $86 | 55 |
| 1024 Ravenswood Dr | 0.53mi | 3/1.5 | 1,780 (-13%) | 1mo | $191,900 | $108 | 51 |
| 805 E Chandler Ave | 0.59mi | 3/2.0 | 2,273 (+11%) | 7mo | $289,900 | $128 | 48 |
| 802 - 804 E Powell Ave | 0.55mi | 4/2.0 (+1) | 2,304 (+13%) | 6mo | $27,000 | $12 | 43 |
| 615 E Gum St | 0.67mi | 2/1.0 (-1) | 1,819 (-11%) | 1mo | $92,000 | $51 | 40 |
| 810 E Gum St | 0.74mi | 3/1.0 | 1,820 (-11%) | 4mo | $155,000 | $85 | 40 |
Match score weights: distance 35% · size 25% · config 20% · recency 20%. Top-matched comps best support the ARV.
Projected returns pro-forma
-3.0% appreciation · 8.0% rent growth · sell at horizon
- IRR
- 2.4%
- Equity multiple
- 1.10×
- Total profit
- $3,566
- Equity at exit
- $19,369
- IRR
- 16.1%
- Equity multiple
- 2.59×
- Total profit
- $58,003
- Equity at exit
- $11,231
Cash invested: $36,372 (down + closing). Projections, not guarantees.
Landlord ↔ Tenant lean methodology
- Overall (STATE)
- 90 Strongly Landlord-Friendly
- State Indiana
- 90 Strongly Landlord-Friendly · R+11
- County
- — inherits STATE
- City
- — inherits STATE
ZIP-level market 47713
- Home prices YoY
- -34.1%
- Rents YoY
- 9.9%
- Active inventory
- 118
- Price-to-rent
- 8.0×
Monthly cashflow live
- Estimated rent
- $1,352 medium interval (Pro) →
- Mortgage (P&I)
- −$681
- Tax from tax record
- −$58 /mo · $695/yr
- Insurance
- −$54
- HOA
- −$0
- Vacancy / Maint / Mgmt
- −$284
- Net cashflow
- $275
Break-even live
UW: 25.0% down · 7.5% · 30yr · 1.5% tax · 5.0% vac · 8.0% maint · 8.0% mgmt
Financing live
Cash to close
- Down payment
- $32,475
- Closing costs
- $3,897
- Reserves months
- —
- Total cash needed
- —
Loan-product check · same deal, 3 products live
Conventional
25% down · 7.5% · 30yr
- Down + closing
- —
- Monthly P&I
- —
- Monthly cashflow
- —
- DSCR
- —
- Eligible?
- —
Personal DTI + credit; lowest rate.
DSCR
20% down · 8.5% · 30yr
- Down + closing
- —
- Monthly P&I
- —
- Monthly cashflow
- —
- DSCR
- —
- Eligible?
- —
No personal income docs; deal must DSCR.
Hard money
10% down · 12.0% · 12mo
- Down + closing
- —
- Monthly P&I
- —
- Monthly cashflow
- —
- DSCR
- —
- Eligible?
- —
Short-term bridge; refi at stabilization.
Rent comps 1 comps
| Address | Beds | Baths | Sqft | Rent | $/sqft | DOM | Units | Dist |
|---|---|---|---|---|---|---|---|---|
| 1213 Washington Ave Evansville, IN | 4.0 | 1.0 | 1984 | $1,595 | $0.80 | 21d | 1 | 0.81mi |
Listing history 16 events
-
2026-06-18days on market $129,900 Active 51 DOM
-
2026-06-17days on market $129,900 Active 50 DOM
-
2026-06-16pricedays on market $129,900 Active 49 DOM
-
2026-06-15days on market $134,900 Active 48 DOM
-
2026-06-14days on market $134,900 Active 46 DOM
-
2026-06-13days on market $134,900 Active 45 DOM
-
2026-06-10days on market $134,900 Active 43 DOM
-
2026-06-09days on market $134,900 Active 42 DOM
-
2026-06-08days on market $134,900 Active 41 DOM
-
2026-06-07days on market $134,900 Active 40 DOM
-
2026-06-02days on market $134,900 Active 35 DOM
-
2026-06-01days on market $134,900 Active 34 DOM
-
2026-05-31days on market $134,900 Active 33 DOM
-
2026-05-30pricedays on market $134,900 Active 32 DOM
-
2026-05-12price $139,900
-
2026-04-28$144,999 Active
ⓘ Source: listings_history table (triggers on properties + properties_extension) + one-shot
backfill from property_details.listing_events for pre-trigger history.
Tax reassessment forecast IN · Partial reset (capped growth)
- Current annual tax
- $695 · $58/mo
- Projected year-2 tax
- $899 · $75/mo
- Expected delta
- +$205/yr (+$17/mo · 29.5%)
ⓘ Screening estimate from a state-policy table — verify with the county assessor before closing.
Climate risk First Street
- Flood 6/10 Major FEMA zone X · 68% chance over 30 yrs
- Wildfire 1/10 Low
- Heat 5/10 Major 7 d/yr ≥107°F today · 18 d/yr by 30 yrs out
- Wind 2/10 Low 3% chance of damaging wind over 30 yrs
- Air quality 4/10 Moderate 3 unhealthy d/yr today · 5 by 30 yrs out
Nearby sold comps map
Loading sold comps map…
Walkable amenities ~0.75 mi
Loading nearby amenities…
Taxation est. · year 1
- Rental income
- $16,226
- − Mortgage interest
- −$7,276
- − Property taxes
- −$695
- − Insurance
- −$650
- − Repairs & maintenance
- −$1,298
- − Management
- −$1,298
- − Depreciation
- −$3,779
- Taxable income
- $1,230
- Est. tax owed @ 24.0%
- −$295
- After-tax cash flow
- $3,004/yr
For passive investors: Depreciation is non-cash, so a rental often shows a tax loss while cash-flowing — sheltering income. Rental losses are passive: they offset passive income freely, and up to $25,000/yr can offset ordinary (W-2) income if you actively participate and your MAGI is under $100k (phasing out to $0 by $150k); unused losses carry forward. On sale, claimed depreciation is recaptured at up to 25%, and gains may owe capital-gains tax (a 1031 exchange can defer both). Figures are a year-1 estimate at your 24.0% rate — not tax advice; consult a CPA.
Schools (NCES district)
- District
- Evansville Vanderburgh School Corporation
- NCES district ID
- 1803450
- Math proficiency
- 36% ▼ -7.00%
- Reading proficiency
- 43% ▼ -3.00%
- Median HH income
- $43,270
- Composite
- 33.41/100
- National rank
- #5471
- State rank
- #153 of 301 in IN
Livability — Evansville
- Score
- 63/100
- State rank
- #416
- US rank
- #15047
Category grades
Schools grade is shown separately in the Schools card above.
Census & demographics
- Census place
- Evansville, IN
- County
- Vanderburgh County · 146,793 people
- City population
- 146,793
- Metro
- Evansville, IN-KY
- Population (ZIP)
- 9,988
- Household income
- $40,873
- Rent vs Own
- Severe rent burden
- 735.0
Population outlook (Vanderburgh County) Hauer SSP2
- Today (2025)
- 187,038 people
- By 2030
- 188,907 · +1.0%
- By 2040
- 190,272 · +1.7%
- By 2050
- 188,871 · +1.0%
- By 2075
- 180,751 · -3.4%
- By 2100
- 163,015 · -12.8%
Race, ethnicity, and origin ACS 2023
- Neighborhood character
- Diverse neighborhood (Simpson 0.60)
- Race & ethnicity
- White 50% Black 39% Two or more races 7% Hispanic / Latino 3% Pacific Islander 1% Asian 1%
- Common ancestry
- Romanian 2% Lithuanian 1% Italian 1%
- Foreign-born
- 5% · Canada
- Languages at home
- 96% English-only · Spanish 2% Tagalog/Filipino 1% French/Haitian/Cajun 1%
Political lean MEDSL · Vanderburgh
- 2024 margin
- R (+12.7) · D 43.0% · R 55.6% · Other 1.4%
- 2008→2024 swing
- -15.1pp toward R · 2008: 2.5pp · 2024: -12.7pp
- All cycles
- 2024: R+12.7 2020: R+9.6 2016: R+16.9 2012: R+10.8 2008: D+2.5
Not yet ingested
- Civics
- —
Market trends
- HPI YoY
- ▼ -119.22%
- Current HPI
- 229.9312
- Rent YoY
- ▲ 9.87%
- Metro
- Evansville, IN-KY
- State GDP YoY
- ▲ 2.90%
- F500 in state
- 18
Industry mix (Fortune 500 HQ in IN)
| Industry | F500 HQs | Revenue |
|---|---|---|
| Industrial Machinery | 2 | $37B |
|
||
| Healthcare | 1 | $177B |
|
||
| Pharmaceuticals | 1 | $45B |
|
||
| Metals / Steel | 1 | $18B |
|
||
| Agriculture | 1 | $17B |
|
||
| Packaging | 1 | $12B |
|
||
Price history
-3.5% since first listed2 events — show timeline
- 2026-05-12 Price Changed $139,900 IRMLS
- 2026-04-28 Listed $144,999 IRMLS
Property tax history
+12.0%/yrLatest (2024): $695 · +2.2% YoY. Source: county tax records.
Cash-flow waterfall
monthlySold comps — $/sqft
last 12 mo · ≤1 miLoading sold comps…