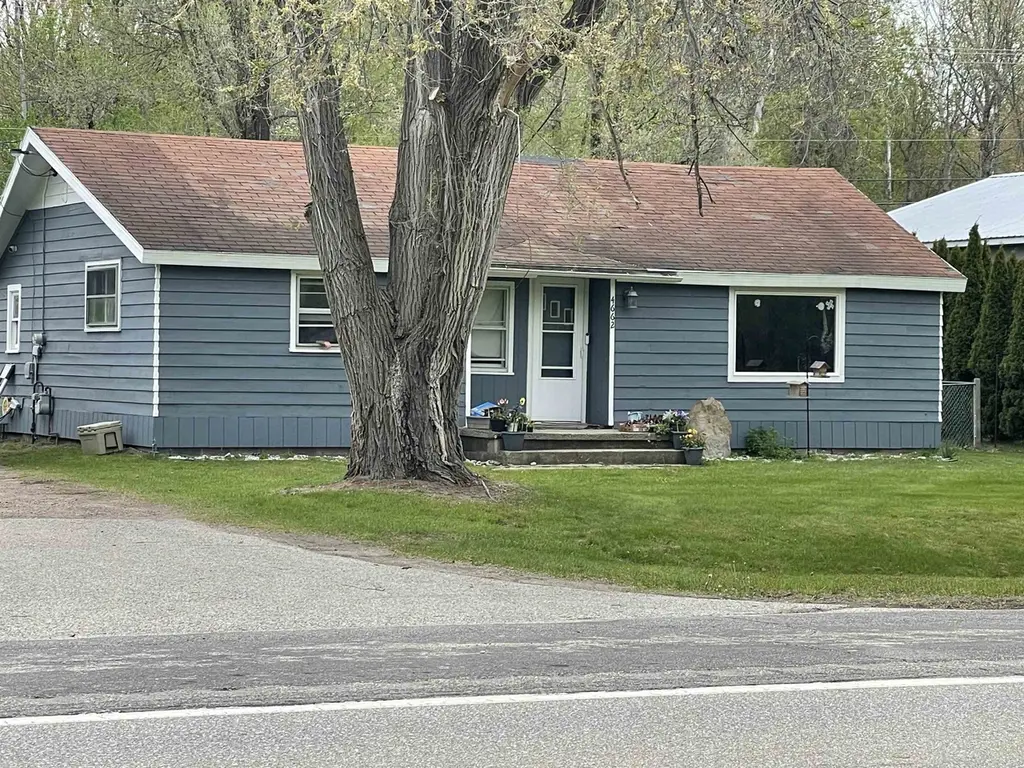
4662 W isabella Rd · Coleman, MI
Flood risk 1/10 · Minimal
- FEMA flood zone
- X (unshaded)
- Chance of flooding over 30 yrs
- 0.0%
- Est. flood insurance / yr
- $507 – $1,088
Fire risk 1/10 · Minimal
- Est. fire insurance / yr
- $784 – $1,456
Heat risk 2/10 · Minimal
- Hot days now (above 99°F)
- 7 days/yr
- Hot days in 30 yrs
- 14 days/yr
Wind risk 1/10 · Minimal
- Chance of severe wind over 30 yrs
- —
Air-quality risk 2/10 · Minimal
- Unhealthy air days now
- 1 days/yr
- Unhealthy air days in 30 yrs
- 2 days/yr
Risk factors via First Street. Map © Google.
Why this score? — see what drove the B+ grade
The composite is a weighted blend of 9 inputs, each scored 0–100. Each bar is that input's sub-score; the figure is the points it added to the 100-point composite (weight × sub-score).
- Cash flow +30.0/30.0
- ARV discount +15.0/15.0
- 1% rule +10.0/10.0
- DSCR +10.0/10.0
- Schools +4.0/10.0
- Livability +3.2/5.0
- Rent growth +2.5/5.0
- Condition / age +2.5/5.0
- Appreciation +0.0/10.0
$64,000
🖨 Deal sheet 📄 Offer letter ✓ Due diligence
Listing remarks MLS
Home is livable but will need septic work and will need a new roof in the near future The starts of a pole barn frame. Property is as is where is cash or conventional financing NO RENTAL NO LAND CONTRACT Appliances are NOT included
Key facts
- 1 acre lot
- Built 1968
- Listed 94 days
Neighborhood map
What this means for you Summary
Snapshot
- This is a 2-bed/1.0-bath single-family listed at $64k.
Deal economics
- At list price, monthly cash flow is $331 ($4k/yr) — positive.
- The deal already cash-flows at list — no discount required.
- Meets the 1% rule at list price ($968 rent vs $64k).
- Recommended offer: $58k (9.0% below list) — sets the bar for market timing.
Location & tenants
- Location reads 63/100 on livability (#525 in MI) — a middle-class / working-renter tenant base. Strengths: cost of living A+, housing A, crime B; Watch: health & safety C-, schools F, amenities F.
- Bullock Creek School District (rural): math 37% / reading 55% proficiency, ranked #132 of 540 in MI (top 24%) — families likely to look elsewhere, expect single-tenant / working-renter base with shorter leases.
- Market conditions: 22 active listings in the ZIP; 320 units permitted in Midland County in 2024 (204 in 5+ unit buildings).
Forward outlook
- Local home prices are declining (-3.0%/yr); year-one equity from $442 of loan paydown is wiped out by about $2k of value loss. Plan a longer hold.
- Midland County population projected to shrink 9% by 2050 — rents likely to lag national; underwrite the cash flow, not the appreciation.
- At projected returns (-3.0% appreciation + 3.0% rent growth), your $18k cash investment doubles in ~6 years — after that, you're playing with house money.
Negotiation context
- It's been on market 95 days — a 9% lower offer ($58k) is reasonable based on typical stale-listing flexibility.
Questions for the listing agent
- It's been on market 95 days. Have you received any prior offers? Is the seller open to a 9% concession, seller financing, or rate buy-down credit?
- Built in 1968 — when were the roof, HVAC, electrical panel, plumbing, and water heater last replaced?
- Why hasn't it sold? Are there any deal-killer items the seller is aware of (foundation, flood, title, zoning, code violations)?
- Is there a deadline driving the sale (1031 exchange, divorce, estate, relocation)? That informs how much negotiation room exists.
- Schools are F-rated, which usually means shorter tenancies and higher turnover. Who's the typical renter profile here, and what's been the actual vacancy rate?
- What's the average days-on-market for RENTAL listings here right now (not sales)? A rising rental-DOM trend means longer vacancies and softer asking-rent achievability than the comps imply.
- What's the recent tenant-quality profile in this submarket — average credit score on applications, eviction rate, late-payment / NSF rate, and stable-employment percentage? A property-management company in the area should have these aggregated.
- How much new for-sale + rental construction is in the pipeline within 1–3 miles? Heavy new supply typically softens prices + rents 12–24 months out; constrained supply supports both.
Investment metrics
- 1% rule
- 1.51% ✓
- Cap rate
- 12.50%
- Cash-on-cash
- 22.15%
- DSCR
- 1.99
- GRM
- 5.5
CMA / ARV
- ARV (median comp)
- $109,066
- List price
- $64,000
- Delta
- -41.32%
- Verdict
- UNDERPRICED
- Comps
- 2 within 1.0 mi
Projected returns pro-forma
-3.0% appreciation · 3.0% rent growth · sell at horizon
- IRR
- 14.9%
- Equity multiple
- 1.60×
- Total profit
- $10,709
- Equity at exit
- $9,543
- IRR
- 23.6%
- Equity multiple
- 3.04×
- Total profit
- $36,495
- Equity at exit
- $5,534
Cash invested: $17,920 (down + closing). Projections, not guarantees.
Landlord ↔ Tenant lean methodology
- Overall (STATE)
- 62 Landlord-Friendly
- State Michigan
- 62 Landlord-Friendly · EVEN
- County
- — inherits STATE
- City
- — inherits STATE
ZIP-level market 48883
- Active inventory
- 22
- Price-to-rent
- 5.5×
Monthly cashflow live
- Estimated rent
- $968 medium interval (Pro) →
- Mortgage (P&I)
- −$336
- Tax from tax record
- −$71 /mo · $856/yr
- Insurance
- −$27
- HOA
- −$0
- Vacancy / Maint / Mgmt
- −$203
- Net cashflow
- $331
Break-even live
UW: 25.0% down · 7.5% · 30yr · 1.5% tax · 5.0% vac · 8.0% maint · 8.0% mgmt
Financing live
Cash to close
- Down payment
- $16,000
- Closing costs
- $1,920
- Reserves months
- —
- Total cash needed
- —
Loan-product check · same deal, 3 products live
Conventional
25% down · 7.5% · 30yr
- Down + closing
- —
- Monthly P&I
- —
- Monthly cashflow
- —
- DSCR
- —
- Eligible?
- —
Personal DTI + credit; lowest rate.
DSCR
20% down · 8.5% · 30yr
- Down + closing
- —
- Monthly P&I
- —
- Monthly cashflow
- —
- DSCR
- —
- Eligible?
- —
No personal income docs; deal must DSCR.
Hard money
10% down · 12.0% · 12mo
- Down + closing
- —
- Monthly P&I
- —
- Monthly cashflow
- —
- DSCR
- —
- Eligible?
- —
Short-term bridge; refi at stabilization.
Listing history 17 events
-
2026-06-19days on market $64,000 Active 95 DOM
-
2026-06-18days on market $64,000 Active 94 DOM
-
2026-06-17days on market $64,000 Active 93 DOM
-
2026-06-16days on market $64,000 Active 92 DOM
-
2026-06-15days on market $64,000 Active 91 DOM
-
2026-06-14days on market $64,000 Active 89 DOM
-
2026-06-12days on market $64,000 Active 88 DOM
-
2026-06-09days on market $64,000 Active 85 DOM
-
2026-06-08days on market $64,000 Active 84 DOM
-
2026-06-07days on market $64,000 Active 83 DOM
-
2026-06-05days on market $64,000 Active 80 DOM
-
2026-06-03days on market $64,000 Active 79 DOM
-
2026-06-02days on market $64,000 Active 78 DOM
-
2026-06-01days on market $64,000 Active 77 DOM
-
2026-05-31days on market $64,000 Active 76 DOM
-
2026-05-30days on market $64,000 Active 75 DOM
-
2026-03-16$64,000 Active 233-char remark
Show marketing remark (233 chars)
Home is livable but will need septic work and will need a new roof in the near future The starts of a pole barn frame. Property is as is where is cash or conventional financing NO RENTAL NO LAND CONTRACT Appliances are NOT included
ⓘ Source: listings_history table (triggers on properties + properties_extension) + one-shot
backfill from property_details.listing_events for pre-trigger history.
Tax reassessment forecast MI · Partial reset (capped growth)
- Current annual tax
- $856 · $71/mo
- Projected year-2 tax
- $921 · $77/mo
- Expected delta
- +$65/yr (+$5/mo · 7.5%)
ⓘ Screening estimate from a state-policy table — verify with the county assessor before closing.
Climate risk First Street
- Flood 1/10 Low FEMA zone X (unshaded) · 0% chance over 30 yrs
- Wildfire 1/10 Low
- Heat 2/10 Low 7 d/yr ≥99°F today · 14 d/yr by 30 yrs out
- Wind 1/10 Low
- Air quality 2/10 Low 1 unhealthy d/yr today · 2 by 30 yrs out
Nearby sold comps map
Loading sold comps map…
Walkable amenities ~0.75 mi
Loading nearby amenities…
Taxation est. · year 1
- Rental income
- $11,612
- − Mortgage interest
- −$3,585
- − Property taxes
- −$856
- − Insurance
- −$320
- − Repairs & maintenance
- −$929
- − Management
- −$929
- − Depreciation
- −$1,862
- Taxable income
- $3,131
- Est. tax owed @ 24.0%
- −$751
- After-tax cash flow
- $3,218/yr
For passive investors: Depreciation is non-cash, so a rental often shows a tax loss while cash-flowing — sheltering income. Rental losses are passive: they offset passive income freely, and up to $25,000/yr can offset ordinary (W-2) income if you actively participate and your MAGI is under $100k (phasing out to $0 by $150k); unused losses carry forward. On sale, claimed depreciation is recaptured at up to 25%, and gains may owe capital-gains tax (a 1031 exchange can defer both). Figures are a year-1 estimate at your 24.0% rate — not tax advice; consult a CPA.
Schools (NCES district)
- District
- Bullock Creek School District
- NCES district ID
- 2607320
- Math proficiency
- 37% ▼ -12.00%
- Reading proficiency
- 55% ▼ -5.00%
- Median HH income
- $52,984
- Composite
- 39.68/100
- National rank
- #3907
- State rank
- #132 of 540 in MI
Livability — Coleman
- Score
- 63/100
- State rank
- #525
- US rank
- #15768
Category grades
Schools grade is shown separately in the Schools card above.
Census & demographics
- Population (ZIP)
- 6,755
Population outlook (Midland County) Hauer SSP2
- Today (2025)
- 83,968 people
- By 2030
- 83,368 · -0.7%
- By 2040
- 80,713 · -3.9%
- By 2050
- 76,698 · -8.7%
- By 2075
- 67,617 · -19.5%
- By 2100
- 57,529 · -31.5%
Race, ethnicity, and origin ACS 2023
- Neighborhood character
- Predominantly White (92%)
- Race & ethnicity
- White 92% Two or more races 5% Hispanic / Latino 3%
- Common ancestry
- Romanian 6% Iranian 3% Lithuanian 3%
- Foreign-born
- 1% · Canada
- Languages at home
- 99% English-only · Spanish 1%
Political lean MEDSL · Midland
- 2024 margin
- R (+15.2) · D 41.6% · R 56.8% · Other 1.6%
- 2008→2024 swing
- -11.6pp toward R · 2008: -3.6pp · 2024: -15.2pp
- All cycles
- 2024: R+15.2 2020: R+14.6 2016: R+19.4 2012: R+15.5 2008: R+3.6
Not yet ingested
- Civics
- —
Market trends
- HPI YoY
- ▼ -124.65%
- Current HPI
- 178.4528
- Rent YoY
- —
- Metro
- —
- State GDP YoY
- ▲ 1.37%
- F500 in state
- 28
Industry mix (Fortune 500 HQ in MI)
| Industry | F500 HQs | Revenue |
|---|---|---|
| Automotive Parts | 3 | $48B |
|
||
| Automotive | 2 | $372B |
|
||
| Chemicals | 1 | $45B |
|
||
| Automotive Retail | 1 | $29B |
|
||
| Healthcare / Medical Devices | 1 | $23B |
|
||
| Automotive Technology | 1 | $20B |
|
||
Price history
1 event — show timeline
- 2026-03-16 Listed $64,000 MiRealSource-MiMLS
Property tax history
-1.3%/yrLatest (2024): $856 · +5.1% YoY. Source: county tax records.
Cash-flow waterfall
monthlySold comps — $/sqft
last 12 mo · ≤1 miLoading sold comps…