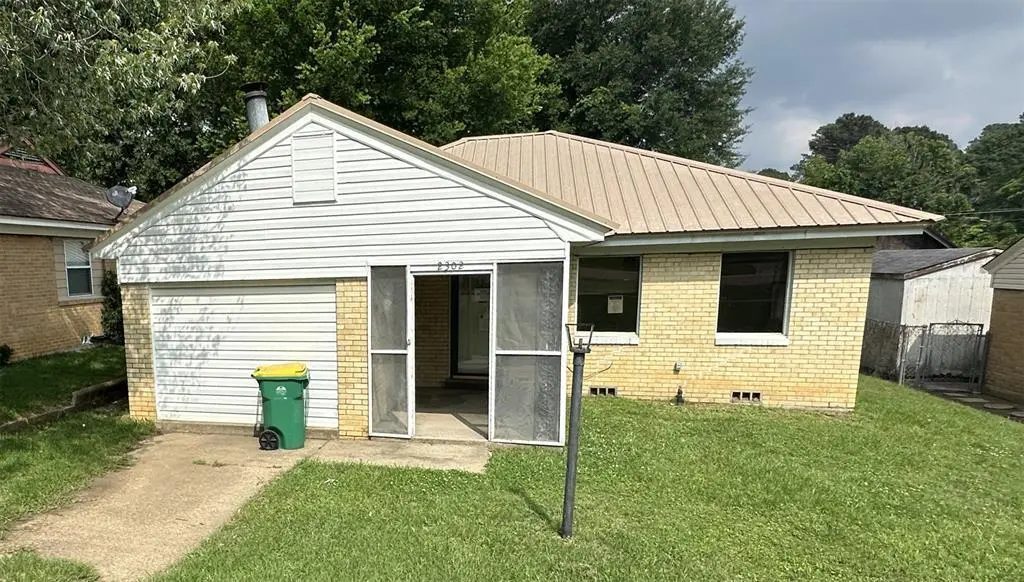
2302 N Akin St · Texarkana, TX
Flood risk 1/10 · Minimal
- FEMA flood zone
- X (unshaded)
- Chance of flooding over 30 yrs
- 0.0%
- Est. flood insurance / yr
- $507 – $1,088
Fire risk 1/10 · Minimal
- Est. fire insurance / yr
- $1,222 – $2,270
Heat risk 7/10 · Major
- Hot days now (above 112°F)
- 7 days/yr
- Hot days in 30 yrs
- 22 days/yr
Wind risk 4/10 · Minor
- Chance of severe wind over 30 yrs
- 24.0%
Air-quality risk 2/10 · Minimal
- Unhealthy air days now
- 0 days/yr
- Unhealthy air days in 30 yrs
- 1 days/yr
Risk factors via First Street. Map © Google.
Why this score? — see what drove the B- grade
The composite is a weighted blend of 9 inputs, each scored 0–100. Each bar is that input's sub-score; the figure is the points it added to the 100-point composite (weight × sub-score).
- Cash flow +30.0/30.0
- 1% rule +10.0/10.0
- DSCR +10.0/10.0
- ARV discount +7.5/15.0
- Livability +3.9/5.0
- Schools +3.2/10.0
- Rent growth +2.9/5.0
- Condition / age +2.5/5.0
- Appreciation +0.0/10.0
$68,000
🖨 Deal sheet 📄 Offer letter ✓ Due diligence
Listing remarks MLS
Located just a block away from Texarkana College this property would be great for college students, a starter home or an investment property! Just minutes away from Central Mall, Richmond Road and N Robison Road. This cutie features original hard wood floors, an enclosed front porch, an added on spacious laundry room and more!
Key facts
- Separate dining
- Galley style kitchen
- Fenced backyard
Tags
Property features AI
Finance
- Other: Located in Bowie County, United States; Subdivision: Oaiclawn Sub; Directions: From downtown Texarkana, take US-82 W-Texas Blvd, take a right on N Robison Rd, right on Oaklawn Dr and the left on N Akin. The home will be on the right.; Lot approx. 0.16 acre
- Financial info: Listing accepts Cash and Conventional financing; Special listing condition: Real Estate Owned
- HOA & community: No homeowners association
Exterior
- Parking: Driveway
- Utilities: City water; City sewer; Individual gas meter; Not in a municipal utility district
- Home design: Single family residence; Residential property; One story; Built in 1960; Not attached to another property
- Construction: Brick construction; Composition roof; Pillar/Post/Pier foundation
- Exterior features: Covered patio/porch; Back yard fencing; Chain link fence; Interior lot in a subdivision
Interior
- Kitchen: Dishwasher
- Bedrooms: 3 bedrooms (primary bedroom on level 1)
- Flooring: Combination
- Bathrooms: 1 full bathroom; 1 half bathroom
- Heating & cooling: Central heating (natural gas); Central air conditioning (electric)
- Interior features: One-level home; Combination flooring; One living area; One dining area; Other interior features
- Laundry & utility: Washer hookup; Electric dryer hookup; Gas water heater
Neighborhood map
What this means for you Summary
Snapshot
- This is a 3-bed/1.5-bath single-family listed at $68k.
Deal economics
- At list price, monthly cash flow is $491 ($6k/yr) — positive.
- The deal already cash-flows at list — no discount required.
- Meets the 1% rule at list price ($1k rent vs $68k).
- Cap rate 15.0% vs local median 4.3% in Texarkana — top-decile yield for the area; either an underpriced asset or a hidden risk that comps aren't pricing in. Stress-test before assuming the spread holds.
Location & tenants
- Location reads 77/100 on livability (#93 in TX, #3,241 nationally) — a middle-class / working-renter tenant base. Strengths: cost of living A+, housing A+, health & safety A+; Watch: amenities D+, crime D, employment D.
- Texarkana ISD (urban): math 36% / reading 41% proficiency, ranked #472 of 826 in TX (top 57%) — families likely to look elsewhere, expect single-tenant / working-renter base with shorter leases; 64% free/reduced lunch — lower-income household profile, screen leases tightly.
- Zoned schools: Wake Village El (math 41% / reading 41%, grade F, #1,462 of 4,322 statewide, top 34%, 579 students, 85% FRL) — zoned schools average 85% FRL vs 64% district-wide (21 pts higher); higher-poverty schools than district average — tighter screening recommended.
- Market conditions: Rents rising (+1.6%/yr); 320 active listings in the ZIP; 4 comparable units currently listed for rent nearby; rentals lingering (median 44d on market — plan ~5-8 weeks vacancy on turnover, expect pricing pressure); 100% of comp listings sitting > 30 days — soft ceiling on asking rent; 137 units permitted in Bowie County in 2024 (5 in 5+ unit buildings).
- This rent runs 34% of the median local income ($46k/yr) — at the standard rent-burdened threshold; future hikes will face affordability resistance.
Forward outlook
- Local home prices are declining (-3.0%/yr); year-one equity from $470 of loan paydown is wiped out by about $2k of value loss. Plan a longer hold.
- At projected returns (-3.0% appreciation + 1.6% rent growth), your $19k cash investment doubles in ~5 years — after that, you're playing with house money.
Negotiation context
- Only 6 days on market — expect competitive offers; lowballing is unlikely to land.
- 3 sale attempts since 4y ago with the ask held roughly flat each time — persistent listings suggest the price (not the market) is what's stuck; bring a comps-based counter.
Risks & watch-outs
- Watch-outs: property tax is 2.6% of price.
- Climate carrying-cost: extreme-heat days projected 7→22/yr by 2055 (HVAC capex compounding) — expect insurance premiums to compound above CPI over the hold.
Questions for the listing agent
- Built in 1960 — when were the roof, HVAC, electrical panel, plumbing, and water heater last replaced?
- Property tax is high relative to price — has the assessment been appealed recently, and will the sale trigger a re-assessment?
- Is there a deadline driving the sale (1031 exchange, divorce, estate, relocation)? That informs how much negotiation room exists.
- Schools are D-rated, which usually means shorter tenancies and higher turnover. Who's the typical renter profile here, and what's been the actual vacancy rate?
- Crime grade is D in this area — have there been break-ins, vandalism, or insurance claims at this property in the last 3 years? What carrier currently insures it and at what premium?
- What's the average days-on-market for RENTAL listings here right now (not sales)? A rising rental-DOM trend means longer vacancies and softer asking-rent achievability than the comps imply.
- What's the recent tenant-quality profile in this submarket — average credit score on applications, eviction rate, late-payment / NSF rate, and stable-employment percentage? A property-management company in the area should have these aggregated.
- How much new for-sale + rental construction is in the pipeline within 1–3 miles? Heavy new supply typically softens prices + rents 12–24 months out; constrained supply supports both.
Investment metrics
- 1% rule
- 1.91% ✓
- Cap rate
- 14.96%
- Cash-on-cash
- 30.94%
- DSCR
- 2.38
- GRM
- 4.4
CMA / ARV
- ARV (on-the-fly)
- $182,900
- Comps found
- 2
Show comp detail 2 sales within ~0.75 mi
| Address | Dist | Beds/Ba | Sqft | Sold | Price | $/sf | Match |
|---|---|---|---|---|---|---|---|
| 2708 Weaver Pl | 0.71mi | 3/1.5 | 1,331 (-10%) | 9mo | $165,000 | $124 | 43 |
| 2914 Sunset Rd | 0.66mi | 3/2.0 | 1,283 (-13%) | 11mo | $119,900 | $93 | 36 |
Match score weights: distance 35% · size 25% · config 20% · recency 20%. Top-matched comps best support the ARV.
Projected returns pro-forma
-3.0% appreciation · 1.63% rent growth · sell at horizon
- IRR
- 24.1%
- Equity multiple
- 1.97×
- Total profit
- $18,542
- Equity at exit
- $10,139
- IRR
- 31.0%
- Equity multiple
- 3.60×
- Total profit
- $49,599
- Equity at exit
- $5,879
Cash invested: $19,040 (down + closing). Projections, not guarantees.
Landlord ↔ Tenant lean methodology
- Overall (STATE)
- 87 Strongly Landlord-Friendly
- State Texas
- 87 Strongly Landlord-Friendly · R+5
- County
- — inherits STATE
- City
- — inherits STATE
ZIP-level market 75501
- Home prices YoY
- -34.9%
- Rents YoY
- 1.6%
- Active inventory
- 320
- Price-to-rent
- 4.4×
Monthly cashflow live
- Estimated rent
- $1,299 medium interval (Pro) →
- Mortgage (P&I)
- −$357
- Tax from tax record
- −$150 /mo · $1,801/yr
- Insurance
- −$28
- HOA
- −$0
- Vacancy / Maint / Mgmt
- −$273
- Net cashflow
- $491
Break-even live
UW: 25.0% down · 7.5% · 30yr · 1.5% tax · 5.0% vac · 8.0% maint · 8.0% mgmt
Financing live
Cash to close
- Down payment
- $17,000
- Closing costs
- $2,040
- Reserves months
- —
- Total cash needed
- —
Loan-product check · same deal, 3 products live
Conventional
25% down · 7.5% · 30yr
- Down + closing
- —
- Monthly P&I
- —
- Monthly cashflow
- —
- DSCR
- —
- Eligible?
- —
Personal DTI + credit; lowest rate.
DSCR
20% down · 8.5% · 30yr
- Down + closing
- —
- Monthly P&I
- —
- Monthly cashflow
- —
- DSCR
- —
- Eligible?
- —
No personal income docs; deal must DSCR.
Hard money
10% down · 12.0% · 12mo
- Down + closing
- —
- Monthly P&I
- —
- Monthly cashflow
- —
- DSCR
- —
- Eligible?
- —
Short-term bridge; refi at stabilization.
Rent comps 4 comps
| Address | Beds | Baths | Sqft | Rent | $/sqft | DOM | Units | Dist |
|---|---|---|---|---|---|---|---|---|
| 313-315 Brookwood Dr Unit 315 Texarkana, TX | 2.0 | 1.5 | 1173 | $1,095 | $0.93 | 43d | 1 | 0.84mi |
| 315 Brookwood Dr Texarkana, TX | 2.0 | 1.5 | 1173 | $1,095 | $0.93 | 43d | 1 | 0.84mi |
| 1504 Colorado St Texarkana, TX | 3.0 | 2.0 | 1298 | $1,595 | $1.23 | 43d | 1 | 1.39mi |
| 3514 Sabine Ave Texarkana, TX | 4.0 | 2.0 | 1600 | $1,845 | $1.15 | 43d | 1 | 1.48mi |
Listing history 7 events
-
2026-06-19days on market $68,000 Active 6 DOM
-
2026-06-18days on market $68,000 Active 5 DOM
-
2026-06-17days on market $68,000 Active 4 DOM
-
2026-06-16days on market $68,000 Active 3 DOM
-
2026-06-15days on market $68,000 Active 2 DOM
-
2026-06-14remarks 208-char remark
-
2026-06-14$68,000 Active 1 DOM
ⓘ Source: listings_history table (triggers on properties + properties_extension) + one-shot
backfill from property_details.listing_events for pre-trigger history.
Tax reassessment forecast TX · Resets to sale price
- Current annual tax
- $1,801 · $150/mo
- Projected year-2 tax
- $1,801 · $150/mo
- Expected delta
- $0/yr ($0/mo · 0.0%)
ⓘ Screening estimate from a state-policy table — verify with the county assessor before closing.
Climate risk First Street
- Flood 1/10 Low FEMA zone X (unshaded) · 0% chance over 30 yrs
- Wildfire 1/10 Low
- Heat 7/10 Severe 7 d/yr ≥112°F today · 22 d/yr by 30 yrs out
- Wind 4/10 Moderate 24% chance of damaging wind over 30 yrs
- Air quality 2/10 Low 0 unhealthy d/yr today · 1 by 30 yrs out
Nearby sold comps map
Loading sold comps map…
Walkable amenities ~0.75 mi
Loading nearby amenities…
Taxation est. · year 1
- Rental income
- $15,584
- − Mortgage interest
- −$3,809
- − Property taxes
- −$1,801
- − Insurance
- −$340
- − Repairs & maintenance
- −$1,247
- − Management
- −$1,247
- − Depreciation
- −$1,978
- Taxable income
- $5,162
- Est. tax owed @ 24.0%
- −$1,239
- After-tax cash flow
- $4,652/yr
For passive investors: Depreciation is non-cash, so a rental often shows a tax loss while cash-flowing — sheltering income. Rental losses are passive: they offset passive income freely, and up to $25,000/yr can offset ordinary (W-2) income if you actively participate and your MAGI is under $100k (phasing out to $0 by $150k); unused losses carry forward. On sale, claimed depreciation is recaptured at up to 25%, and gains may owe capital-gains tax (a 1031 exchange can defer both). Figures are a year-1 estimate at your 24.0% rate — not tax advice; consult a CPA.
Schools (NCES district)
- District
- Texarkana ISD
- NCES district ID
- 4842480
- Math proficiency
- 36% ▼ -7.00%
- Reading proficiency
- 41% ▼ -1.00%
- Median HH income
- $35,692
- Composite
- 31.87/100
- National rank
- #5867
- State rank
- #472 of 826 in TX
Livability — Texarkana
- Score
- 77/100
- State rank
- #93
- US rank
- #3241
Category grades
Schools grade is shown separately in the Schools card above.
Census & demographics
- Census place
- Texarkana, TX
- County
- Bowie County · 61,238 people
- City population
- 61,238
- Metro
- Texarkana, TX-AR
- Population (ZIP)
- 34,866
- Household income
- $45,995
- Rent vs Own
- Severe rent burden
- 1289.0
Population outlook (Bowie County) Hauer SSP2
- Today (2025)
- 94,699 people
- By 2030
- 94,824 · +0.1%
- By 2040
- 94,870 · +0.2%
- By 2050
- 93,686 · -1.1%
- By 2075
- 90,082 · -4.9%
- By 2100
- 76,579 · -19.1%
Race, ethnicity, and origin ACS 2023
- Neighborhood character
- Diverse neighborhood (Simpson 0.59)
- Race & ethnicity
- White 54% Black 33% Hispanic / Latino 9% Two or more races 5%
- Hispanic origin (detail)
- Mexican 7%
- Common ancestry
- Italian 1% Lithuanian 1% Portuguese 1%
- Foreign-born
- 5% · Canada
- Languages at home
- 92% English-only · Spanish 6% Other Indo-European 1%
Political lean MEDSL · Bowie
- 2024 margin
- Solid R (+48.7) · D 25.3% · R 74.0%
- 2008→2024 swing
- -10.8pp toward R · 2008: -37.9pp · 2024: -48.7pp
- All cycles
- 2024: R+48.7 2020: R+42.8 2016: R+46.6 2012: R+41.5 2008: R+37.9
Not yet ingested
- Civics
- —
Market trends
- HPI YoY
- ▼ -79.14%
- Current HPI
- 147.9402
- Rent YoY
- ▲ 1.63%
- Metro
- Texarkana, TX-AR
- State GDP YoY
- ▲ 3.95%
- F500 in state
- 110
Industry mix (Fortune 500 HQ in TX)
| Industry | F500 HQs | Revenue |
|---|---|---|
| Energy | 16 | $1,198B |
|
||
| Technology | 5 | $198B |
|
||
| Engineering / Construction | 4 | $72B |
|
||
| Energy Services | 3 | $60B |
|
||
| Utilities | 3 | $41B |
|
||
| Healthcare | 2 | $330B |
|
||
Price history
-6.2% since first listed8 events — show timeline
- 2026-06-13 Listed $68,000 NTREIS
- 2025-07-03 Rental Removed $1,355 TURBOTENANT
- 2025-06-29 Listed for Rent $1,355 TURBOTENANT
- 2023-05-22 Sold (Public Records) — Public Records
- 2023-05-16 Sold (MLS) — TBOR
- 2023-04-28 Pending — TBOR
- 2022-11-01 Listed $72,500 TBOR
- 2022-09-16 Sold (Public Records) — Public Records
Property tax history
+4.5%/yrLatest (2025): $1,801 · -1.0% YoY. Source: county tax records.
Cash-flow waterfall
monthlySold comps — $/sqft
last 12 mo · ≤1 miLoading sold comps…