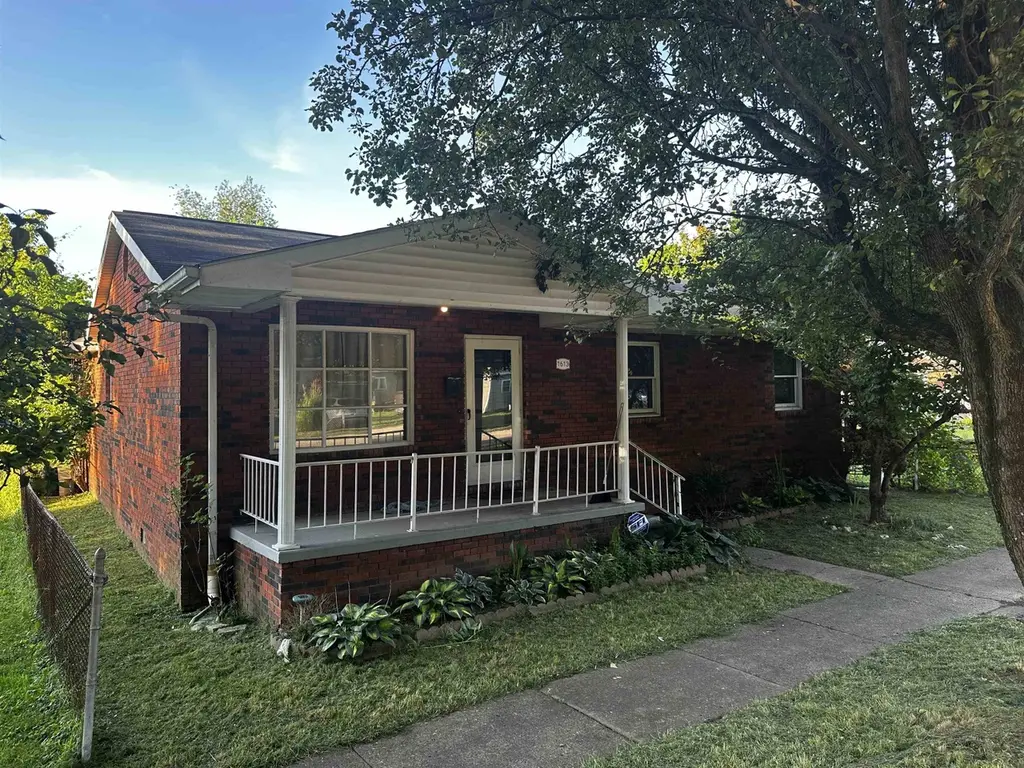
1613 Maple St · Kenova, WV
Flood risk 7/10 · Major
- FEMA flood zone
- X
- Chance of flooding over 30 yrs
- 0.99%
- Est. flood insurance / yr
- $507 – $1,088
Fire risk 4/10 · Minor
- Est. fire insurance / yr
- $787 – $1,461
Heat risk 5/10 · Moderate
- Hot days now (above 101°F)
- 7 days/yr
- Hot days in 30 yrs
- 20 days/yr
Wind risk 2/10 · Minimal
- Chance of severe wind over 30 yrs
- 1.0%
Air-quality risk 2/10 · Minimal
- Unhealthy air days now
- 0 days/yr
- Unhealthy air days in 30 yrs
- 1 days/yr
Risk factors via First Street. Map © Google.
Why this score? — see what drove the B+ grade
The composite is a weighted blend of 9 inputs, each scored 0–100. Each bar is that input's sub-score; the figure is the points it added to the 100-point composite (weight × sub-score).
- Cash flow +29.9/30.0
- DSCR +10.0/10.0
- Appreciation +10.0/10.0
- 1% rule +7.6/10.0
- ARV discount +7.5/15.0
- Livability +4.2/5.0
- Schools +2.6/10.0
- Rent growth +2.5/5.0
- Condition / age +2.5/5.0
$79,900
🖨 Deal sheet 📄 Offer letter ✓ Due diligence
Listing remarks
Welcome home to this solid brick ranch offering 3 bedrooms and 2 full baths with plenty of space and potential to make it your own. The spacious floor plan features a large living room with a fireplace, creating a warm and inviting gathering space. The nicely sized kitchen offers ample cabinet and counter space and includes a dining area for everyday meals and family gatherings. A comfortable family room provides additional living space, perfect for entertaining, a recreation room, or a home office. Outside, you'll appreciate the level yard with room for outdoor enjoyment, along with a detached 2-car garage featuring convenient alley access. This home presents an excellent opportunity for b
Key facts
- 6,970 sq ft lot
- 2 garage spots
- Built 1988
Property features AI
Exterior
- Parking: Detached 2-car garage; Off-street parking; On-street parking
- Utilities: Public water; Public sewer
- Home design: Single-family residence; One story
- Construction: Brick construction; Shingle roof
- Exterior features: Deck; Porch; Storm door(s); Chain link fencing; Level lot
Interior
- Kitchen: Refrigerator
- Bathrooms: 2 full bathrooms
- Heating & cooling: Central heating; Natural gas heating
- Interior features: Refrigerator included; Crawl space basement
Neighborhood map
What this means for you Summary
Snapshot
- This is a 3-bed/1.5-bath single-family listed at $80k.
Deal economics
- At list price, monthly cash flow is $229 ($3k/yr) — positive.
- The deal already cash-flows at list — no discount required.
- Meets the 1% rule at list price ($1k rent vs $80k).
Location & tenants
- Location reads 84/100 on livability (#6 in WV, #796 nationally) — a professional / high-income tenant draw. Strengths: crime A+, commute A+, cost of living A+; Watch: employment D-.
- Wayne County Schools (rural): math 25% / reading 38% proficiency, ranked #25 of 55 in WV (top 46%) — families likely to look elsewhere, expect single-tenant / working-renter base with shorter leases.
- Zoned schools: Ceredo-Kenova Elementary (math 37% / reading 45%, grade F, #107 of 377 statewide, top 28%, 635 students, 0% FRL); Ceredo-Kenova Middle School (math 17% / reading 34%, grade F, #75 of 109 statewide, top 73%, 262 students, 0% FRL); Spring Valley High School (math 17% / reading 47%, grade F, #55 of 110 statewide, top 59%, 910 students, 0% FRL) — zoned schools average 0% FRL vs 46% district-wide (46 pts lower); this property's tenant base skews higher-income than the district average.
- Market conditions: 25 active listings in the ZIP; 67 units permitted in Wayne County in 2024 (0 in 5+ unit buildings).
Forward outlook
- In year one you build about $9k of equity ($552 loan paydown + $8k appreciation (10.0% local appreciation)).
- Wayne County population projected at -22% by 2050 — secular population decline; favor cash flow + early exit over multi-decade hold.
- At projected returns (10.0% appreciation + 3.0% rent growth), your $22k cash investment doubles in ~2 years — after that, you're playing with house money.
- By year 4, paydown + projected appreciation supports a ~$30k cash-out refi (75% LTV) — recoverable capital for the next deal without selling this one.
Negotiation context
- Only 9 days on market — expect competitive offers; lowballing is unlikely to land.
Risks & watch-outs
- Watch-outs: flood insurance adds $66/mo.
- Climate carrying-cost: major flood risk; extreme-heat days projected 7→20/yr by 2055 (HVAC capex compounding) — expect insurance premiums to compound above CPI over the hold.
Questions for the listing agent
- What's the actual annual flood-insurance premium (NFIP or private), and is the property in a SFHA with mandatory coverage?
- Is there a deadline driving the sale (1031 exchange, divorce, estate, relocation)? That informs how much negotiation room exists.
- Schools are F-rated, which usually means shorter tenancies and higher turnover. Who's the typical renter profile here, and what's been the actual vacancy rate?
- What's the average days-on-market for RENTAL listings here right now (not sales)? A rising rental-DOM trend means longer vacancies and softer asking-rent achievability than the comps imply.
- What's the recent tenant-quality profile in this submarket — average credit score on applications, eviction rate, late-payment / NSF rate, and stable-employment percentage? A property-management company in the area should have these aggregated.
- How much new for-sale + rental construction is in the pipeline within 1–3 miles? Heavy new supply typically softens prices + rents 12–24 months out; constrained supply supports both.
Investment metrics
- 1% rule
- 1.26% ✓
- Cap rate
- 10.73%
- Cash-on-cash
- 15.85%
- DSCR
- 1.71
- GRM
- 6.6
CMA / ARV
- ARV (on-the-fly)
- $164,256
- Comps found
- 11
Show comp detail 11 sales within ~0.75 mi
| Address | Dist | Beds/Ba | Sqft | Sold | Price | $/sf | Match |
|---|---|---|---|---|---|---|---|
| 1613 Maple St | 0.00mi | 3/2.0 | 1,711 (0%) | 0mo | $72,500 | $42 | 98 |
| 844 Barger Hill Rd | 0.13mi | 3/2.0 | 1,706 (-0%) | 0mo | $275,000 | $161 | 91 |
| 1625 Poplar St | 0.26mi | 3/2.0 | 1,614 (-6%) | 3mo | $30,000 | $19 | 74 |
| 10 N Oakview Dr | 0.25mi | 4/1.5 (+1) | 1,711 (0%) | 11mo | $165,000 | $96 | 74 |
| 1710 Poplar St | 0.24mi | 3/1.5 | 1,656 (-3%) | 14mo | $125,500 | $76 | 72 |
| 1821 Pine St | 0.26mi | 3/2.5 | 1,679 (-2%) | 12mo | $225,000 | $134 | 71 |
| 217 17th St | 0.40mi | 3/2.0 | 1,542 (-10%) | 3mo | $140,000 | $91 | 60 |
| 214 15th St | 0.42mi | 3/2.0 | 1,540 (-10%) | 2mo | $170,000 | $110 | 60 |
| 411 15th St | 0.29mi | 3/1.5 | 1,465 (-14%) | 12mo | $183,000 | $125 | 52 |
| 212 13th St | 0.50mi | 3/2.0 | 1,481 (-13%) | 1mo | $120,000 | $81 | 51 |
| 1114 Chestnut St | 0.45mi | 4/2.0 (+1) | 1,936 (+13%) | 6mo | $232,000 | $120 | 45 |
Match score weights: distance 35% · size 25% · config 20% · recency 20%. Top-matched comps best support the ARV.
Projected returns pro-forma
10.0% appreciation · 3.0% rent growth · sell at horizon
- IRR
- 33.3%
- Equity multiple
- 3.60×
- Total profit
- $58,129
- Equity at exit
- $71,980
- IRR
- 28.7%
- Equity multiple
- 8.14×
- Total profit
- $159,752
- Equity at exit
- $155,228
Cash invested: $22,372 (down + closing). Projections, not guarantees.
Landlord ↔ Tenant lean methodology
- Overall (STATE)
- 83 Strongly Landlord-Friendly
- State West Virginia
- 83 Strongly Landlord-Friendly · R+22
- County
- — inherits STATE
- City
- — inherits STATE
ZIP-level market 25530
- Home prices YoY
- 7.7%
- Active inventory
- 25
- Price-to-rent
- 6.6×
Monthly cashflow live
- Estimated rent
- $1,004 medium interval (Pro) →
- Mortgage (P&I)
- −$419
- Tax from tax record
- −$46 /mo · $548/yr
- Insurance
- −$33
- Flood insurance flood zone
- −$66 /mo · $798/yr
- HOA
- −$0
- Vacancy / Maint / Mgmt
- −$211
- Net cashflow
- $229
Break-even live
UW: 25.0% down · 7.5% · 30yr · 1.5% tax · 5.0% vac · 8.0% maint · 8.0% mgmt
Financing live
Cash to close
- Down payment
- $19,975
- Closing costs
- $2,397
- Reserves months
- —
- Total cash needed
- —
Loan-product check · same deal, 3 products live
Conventional
25% down · 7.5% · 30yr
- Down + closing
- —
- Monthly P&I
- —
- Monthly cashflow
- —
- DSCR
- —
- Eligible?
- —
Personal DTI + credit; lowest rate.
DSCR
20% down · 8.5% · 30yr
- Down + closing
- —
- Monthly P&I
- —
- Monthly cashflow
- —
- DSCR
- —
- Eligible?
- —
No personal income docs; deal must DSCR.
Hard money
10% down · 12.0% · 12mo
- Down + closing
- —
- Monthly P&I
- —
- Monthly cashflow
- —
- DSCR
- —
- Eligible?
- —
Short-term bridge; refi at stabilization.
Listing history 7 events
-
2026-06-12statusdays on market $79,900 Pending 9 DOM
-
2026-06-09days on market $79,900 Active 7 DOM
-
2026-06-08days on market $79,900 Active 6 DOM
-
2026-06-07days on market $79,900 Active 5 DOM
-
2026-06-05days on market $79,900 Active 2 DOM
-
2026-06-03remarks 699-char remark
-
2026-06-03$79,900 Active 1 DOM
ⓘ Source: listings_history table (triggers on properties + properties_extension) + one-shot
backfill from property_details.listing_events for pre-trigger history.
Tax reassessment forecast WV · Resets to sale price
- Current annual tax
- $548 · $46/mo
- Projected year-2 tax
- $548 · $46/mo
- Expected delta
- $0/yr ($0/mo · 0.0%)
ⓘ Screening estimate from a state-policy table — verify with the county assessor before closing.
Climate risk First Street
- Flood 7/10 Severe FEMA zone X · 99% chance over 30 yrs
- Wildfire 4/10 Moderate
- Heat 5/10 Major 7 d/yr ≥101°F today · 20 d/yr by 30 yrs out
- Wind 2/10 Low 100% chance of damaging wind over 30 yrs
- Air quality 2/10 Low 0 unhealthy d/yr today · 1 by 30 yrs out
Nearby sold comps map
Loading sold comps map…
Walkable amenities ~0.75 mi
Loading nearby amenities…
Taxation est. · year 1
- Rental income
- $12,054
- − Mortgage interest
- −$4,476
- − Property taxes
- −$548
- − Insurance
- −$1,197
- − Repairs & maintenance
- −$964
- − Management
- −$964
- − Depreciation
- −$2,324
- Taxable income
- $1,580
- Est. tax owed @ 24.0%
- −$379
- After-tax cash flow
- $2,370/yr
For passive investors: Depreciation is non-cash, so a rental often shows a tax loss while cash-flowing — sheltering income. Rental losses are passive: they offset passive income freely, and up to $25,000/yr can offset ordinary (W-2) income if you actively participate and your MAGI is under $100k (phasing out to $0 by $150k); unused losses carry forward. On sale, claimed depreciation is recaptured at up to 25%, and gains may owe capital-gains tax (a 1031 exchange can defer both). Figures are a year-1 estimate at your 24.0% rate — not tax advice; consult a CPA.
Schools (NCES district)
- District
- Wayne County Schools
- NCES district ID
- 5401500
- Math proficiency
- 25% ▼ -15.00%
- Reading proficiency
- 38% ▼ -10.00%
- Median HH income
- $36,283
- Composite
- 26.08/100
- National rank
- #7297
- State rank
- #25 of 55 in WV
Livability — Kenova
- Score
- 84/100
- State rank
- #6
- US rank
- #796
Category grades
Schools grade is shown separately in the Schools card above.
Census & demographics
- Census place
- Kenova, WV
- Population (ZIP)
- 6,642
Population outlook (Wayne County) Hauer SSP2
- Today (2025)
- 38,267 people
- By 2030
- 36,578 · -4.4%
- By 2040
- 33,034 · -13.7%
- By 2050
- 29,671 · -22.5%
- By 2075
- 22,901 · -40.2%
- By 2100
- 17,421 · -54.5%
Race, ethnicity, and origin ACS 2023
- Neighborhood character
- Predominantly White (94%)
- Race & ethnicity
- White 94% Two or more races 4% Black 2%
- Common ancestry
- Scottish 4% Italian 4% Serbian 2%
Political lean MEDSL · Wayne
- 2024 margin
- Solid R (+53.4) · D 22.4% · R 75.8% · Other 1.8%
- 2008→2024 swing
- -35.1pp toward R · 2008: -18.2pp · 2024: -53.4pp
- All cycles
- 2024: R+53.4 2020: R+50.1 2016: R+51.3 2012: R+27.0 2008: R+18.2
Not yet ingested
- Civics
- —
Market trends
- HPI YoY
- ▲ 14.35%
- Current HPI
- 201.9673
- Rent YoY
- —
- Metro
- —
- State GDP YoY
- —
- F500 in state
- 0
Price history
+8.0% since first listed2 events — show timeline
- 2026-05-26 Listed $79,900 HBRMLS
- 1996-05-03 Sold (Public Records) $74,000 Public Records
Property tax history
+2.1%/yrLatest (2025): $548 · +8.1% YoY. Source: county tax records.
Cash-flow waterfall
monthlySold comps — $/sqft
last 12 mo · ≤1 miLoading sold comps…