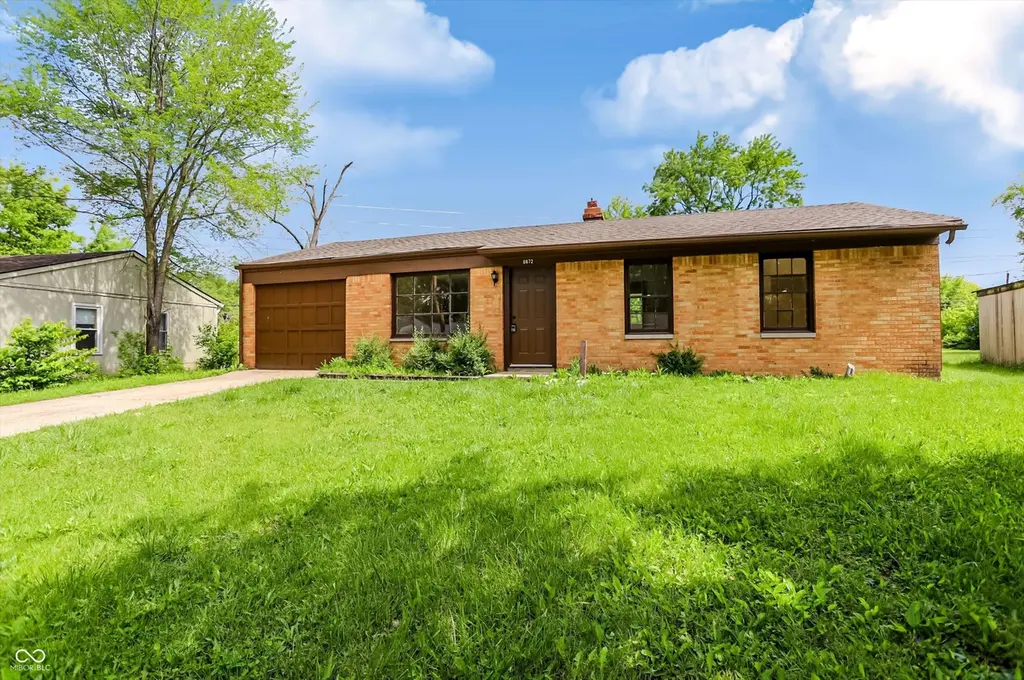
6672 E 43rd Pl · Indianapolis city (balance), IN
Flood risk 1/10 · Minimal
- FEMA flood zone
- X (unshaded)
- Chance of flooding over 30 yrs
- 0.0%
- Est. flood insurance / yr
- $507 – $1,088
Fire risk 1/10 · Minimal
- Est. fire insurance / yr
- $717 – $1,331
Heat risk 3/10 · Minor
- Hot days now (above 101°F)
- 7 days/yr
- Hot days in 30 yrs
- 18 days/yr
Wind risk 2/10 · Minimal
- Chance of severe wind over 30 yrs
- 1.0%
Air-quality risk 4/10 · Minor
- Unhealthy air days now
- 5 days/yr
- Unhealthy air days in 30 yrs
- 7 days/yr
Risk factors via First Street. Map © Google.
Why this score? — see what drove the D+ grade
The composite is a weighted blend of 9 inputs, each scored 0–100. Each bar is that input's sub-score; the figure is the points it added to the 100-point composite (weight × sub-score).
- Cash flow +18.9/30.0
- ARV discount +9.4/15.0
- DSCR +5.9/10.0
- 1% rule +4.9/10.0
- Rent growth +4.2/5.0
- Livability +2.5/5.0
- Condition / age +2.5/5.0
- Schools +1.4/10.0
- Appreciation +0.0/10.0
$150,000
🖨 Deal sheet 📄 Offer letter ✓ Due diligence
Listing remarks MLS
Welcome home to this move-in-ready 4-bedroom ranch home in the Devington area of Indianapolis! Enjoy summertime in the private, fully fenced backyard from the covered back patio. The spacious kitchen is in the heart of the home - a fridge credit will be given to the new buyer. The living room features new flooring and refreshing natural light. The converted garage is great for a large primary suite or for a second family room! Recently refreshed with new flooring, paint, and fixtures. New AC unit and new electrical (200 AMP)! Quiet neighborhood with easy access to I465 and local restaurants. Home would also make a great addition to an investor's portfolio.
Key facts
- New ac unit
- New electrical
- Covered back patio
Tags
Neighborhood map
What this means for you Summary
Snapshot
- This is a 4-bed/1.0-bath single-family listed at $150k.
Deal economics
- At list price, monthly cash flow is $153 ($2k/yr) — positive.
- The deal already cash-flows at list — no discount required.
- To meet the 1% rule (rent ≥ 1% of price), the offer needs to be $149k (0.9% below list).
- Recommended offer: $141k (6.0% below list) — sets the bar for market timing.
- Cap rate 7.5% vs local median 4.4% in Indianapolis city (balance) — top-decile yield for the area; either an underpriced asset or a hidden risk that comps aren't pricing in. Stress-test before assuming the spread holds.
Location & tenants
- Location reads: area grade D — affects rentability + tenant quality, not the cash-flow math above.
- Indianapolis Public Schools (urban): math 14% / reading 20% proficiency, ranked #286 of 301 in IN (top 95%) — low school quality limits family demand, transient renter base, plan for 1-2y turnover; 77% free/reduced lunch — lower-income household profile, screen leases tightly.
- Market conditions: Rents rising fast (+6.8%/yr); 151 active listings in the ZIP; 8 comparable units currently listed for rent nearby; rentals leasing fast (median 14d on market — plan ~1-2 weeks tenant-placement turnaround); 1,906 units permitted in Marion County in 2024 (621 in 5+ unit buildings).
- This rent runs 35% of the median local income ($50k/yr) — at the standard rent-burdened threshold; future hikes will face affordability resistance.
Forward outlook
- Local home prices are declining (-3.0%/yr); year-one equity from $1k of loan paydown is wiped out by about $4k of value loss. Plan a longer hold.
- Marion County population projected at +18% by 2050 — long-run rental-demand tailwind backs the buy-and-hold thesis.
Negotiation context
- It's been on market 66 days — a 6% lower offer ($141k) is reasonable based on typical stale-listing flexibility.
- 9 sale attempts since 19y ago; this cycle's ask has dropped $10k (6%) from the opening price — seller is motivated, your offer sets the floor, not the list.
- Current owner paid $61k; list at $150k implies a 146% gain — meaningful room to come down on a strong offer.
Risks & watch-outs
- Watch-outs: built in 1958 — expect roof / HVAC / electrical / plumbing capex.
Questions for the listing agent
- It's been on market 66 days. Have you received any prior offers? Is the seller open to a 6% concession, seller financing, or rate buy-down credit?
- Built in 1958 — when were the roof, HVAC, electrical panel, plumbing, and water heater last replaced?
- Why hasn't it sold? Are there any deal-killer items the seller is aware of (foundation, flood, title, zoning, code violations)?
- Is there a deadline driving the sale (1031 exchange, divorce, estate, relocation)? That informs how much negotiation room exists.
- The area grade is low — what's the realistic commute time and amenity access for the typical tenant pool here? Any planned neighborhood developments (good or bad) we should know about?
- What's the average days-on-market for RENTAL listings here right now (not sales)? A rising rental-DOM trend means longer vacancies and softer asking-rent achievability than the comps imply.
- What's the recent tenant-quality profile in this submarket — average credit score on applications, eviction rate, late-payment / NSF rate, and stable-employment percentage? A property-management company in the area should have these aggregated.
- How much new for-sale + rental construction is in the pipeline within 1–3 miles? Heavy new supply typically softens prices + rents 12–24 months out; constrained supply supports both.
Investment metrics
- 1% rule
- 0.99% ✗
- Cap rate
- 7.51%
- Cash-on-cash
- 4.36%
- DSCR
- 1.19
- GRM
- 8.4
CMA / ARV
- ARV (median comp)
- $156,463
- List price
- $150,000
- Delta
- -4.13%
- Verdict
- FAIR
- Comps
- 20 within 1.0 mi
Show comp detail 12 sales within ~0.75 mi
| Address | Dist | Beds/Ba | Sqft | Sold | Price | $/sf | Match |
|---|---|---|---|---|---|---|---|
| 6702 E 43rd Pl | 0.01mi | 3/1.0 (-1) | 900 (-6%) | 8mo | $130,000 | $144 | 77 |
| 6501 Meadowlark Dr | 0.21mi | 3/1.0 (-1) | 1,000 (+4%) | 13mo | $180,000 | $180 | 67 |
| 4002 N Catherwood Ave | 0.65mi | 4/1.0 | 984 (+2%) | 2mo | $125,000 | $127 | 64 |
| 4311 N Kenmore Rd | 0.32mi | 3/1.0 (-1) | 1,000 (+4%) | 15mo | $175,000 | $175 | 60 |
| 3944 N Elizabeth St | 0.39mi | 3/1.0 (-1) | 1,053 (+10%) | 2mo | $118,000 | $112 | 59 |
| 4071 Sawyer St | 0.54mi | 3/1.0 (-1) | 964 (+0%) | 14mo | $36,000 | $37 | 58 |
| 4012 N Elizabeth St | 0.31mi | 3/1.0 (-1) | 1,074 (+12%) | 5mo | $166,000 | $155 | 56 |
| 4101 N Arlington Ave | 0.68mi | 3/1.0 (-1) | 944 (-2%) | 6mo | $145,000 | $154 | 55 |
| 3940 N Webster Ave | 0.71mi | 3/1.0 (-1) | 962 (+0%) | 15mo | $142,500 | $148 | 49 |
| 4159 N Ridgeview Dr | 0.30mi | 3/1.0 (-1) | 826 (-14%) | 12mo | $108,000 | $131 | 48 |
| 4219 E 43rd Ct | 0.59mi | 3/1.0 (-1) | 1,008 (+5%) | 14mo | $159,900 | $159 | 47 |
| 3808 Elmhurst Dr | 0.73mi | 3/1.0 (-1) | 994 (+4%) | 10mo | $104,000 | $105 | 47 |
Match score weights: distance 35% · size 25% · config 20% · recency 20%. Top-matched comps best support the ARV.
Projected returns pro-forma
-3.0% appreciation · 6.76% rent growth · sell at horizon
- IRR
- -5.4%
- Equity multiple
- 0.79×
- Total profit
- $-8,736
- Equity at exit
- $22,365
- IRR
- 8.3%
- Equity multiple
- 1.73×
- Total profit
- $30,838
- Equity at exit
- $12,969
Cash invested: $42,000 (down + closing). Projections, not guarantees.
Landlord ↔ Tenant lean methodology
- Overall (STATE)
- 90 Strongly Landlord-Friendly
- State Indiana
- 90 Strongly Landlord-Friendly · R+11
- County
- — inherits STATE
- City
- — inherits STATE
ZIP-level market 46226
- Rents YoY
- 6.8%
- Active inventory
- 151
- Price-to-rent
- 8.4×
Monthly cashflow live
- Estimated rent
- $1,486 high interval (Pro) →
- Mortgage (P&I)
- −$787
- Tax from tax record
- −$172 /mo · $2,068/yr
- Insurance
- −$62
- HOA
- −$0
- Vacancy / Maint / Mgmt
- −$312
- Net cashflow
- $153
Break-even live
UW: 25.0% down · 7.5% · 30yr · 1.5% tax · 5.0% vac · 8.0% maint · 8.0% mgmt
Financing live
Cash to close
- Down payment
- $37,500
- Closing costs
- $4,500
- Reserves months
- —
- Total cash needed
- —
Loan-product check · same deal, 3 products live
Conventional
25% down · 7.5% · 30yr
- Down + closing
- —
- Monthly P&I
- —
- Monthly cashflow
- —
- DSCR
- —
- Eligible?
- —
Personal DTI + credit; lowest rate.
DSCR
20% down · 8.5% · 30yr
- Down + closing
- —
- Monthly P&I
- —
- Monthly cashflow
- —
- DSCR
- —
- Eligible?
- —
No personal income docs; deal must DSCR.
Hard money
10% down · 12.0% · 12mo
- Down + closing
- —
- Monthly P&I
- —
- Monthly cashflow
- —
- DSCR
- —
- Eligible?
- —
Short-term bridge; refi at stabilization.
Rent comps 8 comps
| Address | Beds | Baths | Sqft | Rent | $/sqft | DOM | Units | Dist |
|---|---|---|---|---|---|---|---|---|
| 4307 N Edmondson Ave Indianapolis, IN | 3.0 | 1.0 | 900 | $1,299 | $1.44 | 1d | 1 | 0.14mi |
| 4555 N Arlington Ave Indianapolis, IN | 1.0–3.0 | 1.0–1.5 | 880 | $1,379 | $1.57 | 3d | 30 | 0.73mi |
| 3775 Allerton Pl Indianapolis, IN | 1.0–4.0 | 2.0 | 1068 | $1,850 | $1.73 | 13d | 1 | 0.84mi |
| 3836 Priscilla Ave Indianapolis, IN | 3.0 | 1.5 | 1040 | $1,275 | $1.23 | 1d | 1 | 0.97mi |
| 7171 Twin Oaks Dr Indianapolis, IN | 3.0 | 1.0–1.5 | 801 | $1,399 | $1.75 | 23d | 9 | 1.02mi |
| 5602 Glencoe St Indianapolis, IN | 3.0 | 1.0 | 1000 | $1,749 | $1.75 | 17d | 1 | 1.05mi |
| 3718 N Audubon Rd Indianapolis, IN | 3.0 | 1.0 | 875 | $1,300 | $1.49 | 23d | 1 | 1.16mi |
| 3636 N Whittier Pl Indianapolis, IN | 3.0 | 1.0 | 912 | $995 | $1.09 | 7d | 1 | 1.42mi |
Listing history 37 events
-
2026-06-18days on market $150,000 Active 66 DOM
-
2026-06-17days on market $150,000 Active 65 DOM
-
2026-06-16days on market $150,000 Active 64 DOM
-
2026-06-15days on market $150,000 Active 63 DOM
-
2026-06-13days on market $150,000 Active 61 DOM
-
2026-06-13pricedays on market $150,000 Active 60 DOM
-
2026-06-09days on market $159,500 Active 57 DOM
-
2026-06-08days on market $159,500 Active 56 DOM
-
2026-06-07days on market $159,500 Active 55 DOM
-
2026-06-03days on market $159,500 Active 51 DOM
-
2026-06-02days on market $159,500 Active 50 DOM
-
2026-06-01days on market $159,500 Active 49 DOM
-
2026-05-31days on market $159,500 Active 48 DOM
-
2026-05-11price $159,500 664-char remark
Show marketing remark (664 chars)
Welcome home to this move-in-ready 4-bedroom ranch home in the Devington area of Indianapolis! Enjoy summertime in the private, fully fenced backyard from the covered back patio. The spacious kitchen is in the heart of the home - a fridge credit will be given to the new buyer. The living room features new flooring and refreshing natural light. The converted garage is great for a large primary suite or for a second family room! Recently refreshed with new flooring, paint, and fixtures. New AC unit and new electrical (200 AMP)! Quiet neighborhood with easy access to I465 and local restaurants. Home would also make a great addition to an investor's portfolio.
-
2026-04-13$160,000 Active 664-char remark
Show marketing remark (664 chars)
Welcome home to this move-in-ready 4-bedroom ranch home in the Devington area of Indianapolis! Enjoy summertime in the private, fully fenced backyard from the covered back patio. The spacious kitchen is in the heart of the home - a fridge credit will be given to the new buyer. The living room features new flooring and refreshing natural light. The converted garage is great for a large primary suite or for a second family room! Recently refreshed with new flooring, paint, and fixtures. New AC unit and new electrical (200 AMP)! Quiet neighborhood with easy access to I465 and local restaurants. Home would also make a great addition to an investor's portfolio.
-
2026-01-10historical
-
2025-11-14price $159,995
-
2025-08-29$165,000 Active
-
2019-12-20soldstatus $60,900 Sold
-
2019-12-02status Pending
-
2019-11-25status Active
-
2019-11-05status Pending
-
2019-10-31price $62,900
-
2019-10-31status Active
-
2019-10-16historical
-
2019-10-08price $66,900
-
2019-08-04$69,900 Active
-
2018-12-21soldstatus $43,900 Sold
-
2018-12-05status Pending
-
2018-11-26$43,900 Active
-
2009-01-22historical
-
2008-11-26soldstatus $14,900
-
2008-07-17historical
-
2008-07-10$14,900
-
2007-12-12$29,000
-
2007-12-11historical
-
2007-08-13$37,000
ⓘ Source: listings_history table (triggers on properties + properties_extension) + one-shot
backfill from property_details.listing_events for pre-trigger history.
Tax reassessment forecast IN · Partial reset (capped growth)
- Current annual tax
- $2,068 · $172/mo
- Projected year-2 tax
- $2,068 · $172/mo
- Expected delta
- $0/yr ($0/mo · 0.0%)
ⓘ Screening estimate from a state-policy table — verify with the county assessor before closing.
Climate risk First Street
- Flood 1/10 Low FEMA zone X (unshaded) · 0% chance over 30 yrs
- Wildfire 1/10 Low
- Heat 3/10 Moderate 7 d/yr ≥101°F today · 18 d/yr by 30 yrs out
- Wind 2/10 Low 100% chance of damaging wind over 30 yrs
- Air quality 4/10 Moderate 5 unhealthy d/yr today · 7 by 30 yrs out
Nearby sold comps map
Loading sold comps map…
Walkable amenities ~0.75 mi
Loading nearby amenities…
Taxation est. · year 1
- Rental income
- $17,835
- − Mortgage interest
- −$8,402
- − Property taxes
- −$2,068
- − Insurance
- −$750
- − Repairs & maintenance
- −$1,427
- − Management
- −$1,427
- − Depreciation
- −$4,364
- Taxable loss
- −$603
- Est. tax savings @ 24.0%
- +$145
- After-tax cash flow
- $1,977/yr
For passive investors: Depreciation is non-cash, so a rental often shows a tax loss while cash-flowing — sheltering income. Rental losses are passive: they offset passive income freely, and up to $25,000/yr can offset ordinary (W-2) income if you actively participate and your MAGI is under $100k (phasing out to $0 by $150k); unused losses carry forward. On sale, claimed depreciation is recaptured at up to 25%, and gains may owe capital-gains tax (a 1031 exchange can defer both). Figures are a year-1 estimate at your 24.0% rate — not tax advice; consult a CPA.
Schools (NCES district)
- District
- Indianapolis Public Schools
- NCES district ID
- 1804770
- Math proficiency
- 14% ▼ -7.00%
- Reading proficiency
- 20% ▼ -3.00%
- Median HH income
- $32,034
- Composite
- 13.69/100
- National rank
- #9499
- State rank
- #286 of 301 in IN
Livability — Indianapolis city (balance)
No livability data for this city. (Only ~50 U.S. cities are tracked.)
Census & demographics
- Census place
- Indianapolis city (balance), IN
- County
- Marion County · 998,460 people
- City population
- 881,119
- Metro
- Indianapolis-Carmel-Anderson, IN
- Population (ZIP)
- 47,099
- Household income
- $50,325
- Rent vs Own
- Severe rent burden
- 2742.0
Population outlook (Marion County) Hauer SSP2
- Today (2025)
- 1,025,572 people
- By 2030
- 1,065,727 · +3.9%
- By 2040
- 1,141,577 · +11.3%
- By 2050
- 1,208,920 · +17.9%
- By 2075
- 1,367,288 · +33.3%
- By 2100
- 1,438,201 · +40.2%
Race, ethnicity, and origin ACS 2023
- Neighborhood character
- Diverse neighborhood (Simpson 0.62)
- Race & ethnicity
- Black 53% White 25% Hispanic / Latino 17% Two or more races 9% Asian 2%
- Hispanic origin (detail)
- Mexican 11%
- Common ancestry
- Lithuanian 1% Italian 1% Romanian 1%
- Foreign-born
- 11% · Canada
- Languages at home
- 86% English-only · Spanish 10% French/Haitian/Cajun 1% Other Asian/Pacific 1%
Political lean MEDSL · Marion
- 2024 margin
- Strong D (+27.7) · D 63.0% · R 35.3% · Other 1.7%
- 2008→2024 swing
- -0.7pp no change · 2008: 28.4pp · 2024: 27.7pp
- All cycles
- 2024: D+27.7 2020: D+29.1 2016: D+22.8 2012: D+22.2 2008: D+28.4
Not yet ingested
- Civics
- —
Market trends
- HPI YoY
- ▼ -218.85%
- Current HPI
- 239.43
- Rent YoY
- ▲ 6.76%
- Metro
- Indianapolis-Carmel-Anderson, IN
- State GDP YoY
- ▲ 2.90%
- F500 in state
- 18
Industry mix (Fortune 500 HQ in IN)
| Industry | F500 HQs | Revenue |
|---|---|---|
| Industrial Machinery | 2 | $37B |
|
||
| Healthcare | 1 | $177B |
|
||
| Pharmaceuticals | 1 | $45B |
|
||
| Metals / Steel | 1 | $18B |
|
||
| Agriculture | 1 | $17B |
|
||
| Packaging | 1 | $12B |
|
||
Price history
+331.1% since first listed24 events — show timeline
- 2026-05-11 Price Changed $159,500 MIBOR as Distributed by MLS Grid
- 2026-04-13 Listed $160,000 MIBOR as Distributed by MLS Grid
- 2026-01-10 Listing Removed — MIBOR as Distributed by MLS Grid
- 2025-11-14 Price Changed $159,995 MIBOR as Distributed by MLS Grid
- 2025-08-29 Listed $165,000 MIBOR as Distributed by MLS Grid
- 2019-12-20 Sold (MLS) $60,900 MIBOR as Distributed by MLS Grid
- 2019-12-02 Pending — MIBOR as Distributed by MLS Grid
- 2019-11-25 Relisted — MIBOR as Distributed by MLS Grid
- 2019-11-05 Pending — MIBOR as Distributed by MLS Grid
- 2019-10-31 Price Changed $62,900 MIBOR as Distributed by MLS Grid
- 2019-10-31 Relisted — MIBOR as Distributed by MLS Grid
- 2019-10-16 Listing Removed — MIBOR as Distributed by MLS Grid
- 2019-10-08 Price Changed $66,900 MIBOR as Distributed by MLS Grid
- 2019-08-04 Listed $69,900 MIBOR as Distributed by MLS Grid
- 2018-12-21 Sold (MLS) $43,900 MIBOR as Distributed by MLS Grid
- 2018-12-05 Pending — MIBOR as Distributed by MLS Grid
- 2018-11-26 Listed $43,900 MIBOR as Distributed by MLS Grid
- 2009-01-22 Listing Removed — MIBOR as Distributed by MLS Grid
- 2008-11-26 Sold (MLS) $14,900 MIBOR as Distributed by MLS Grid
- 2008-07-17 Listing Removed — MIBOR as Distributed by MLS Grid
- 2008-07-10 Listed $14,900 MIBOR as Distributed by MLS Grid
- 2007-12-12 Listed $29,000 MIBOR as Distributed by MLS Grid
- 2007-12-11 Listing Removed — MIBOR as Distributed by MLS Grid
- 2007-08-13 Listed $37,000 MIBOR as Distributed by MLS Grid
Property tax history
+5.7%/yrLatest (2025): $2,068 · +6.7% YoY. Source: county tax records.
Cash-flow waterfall
monthlySold comps — $/sqft
last 12 mo · ≤1 miLoading sold comps…