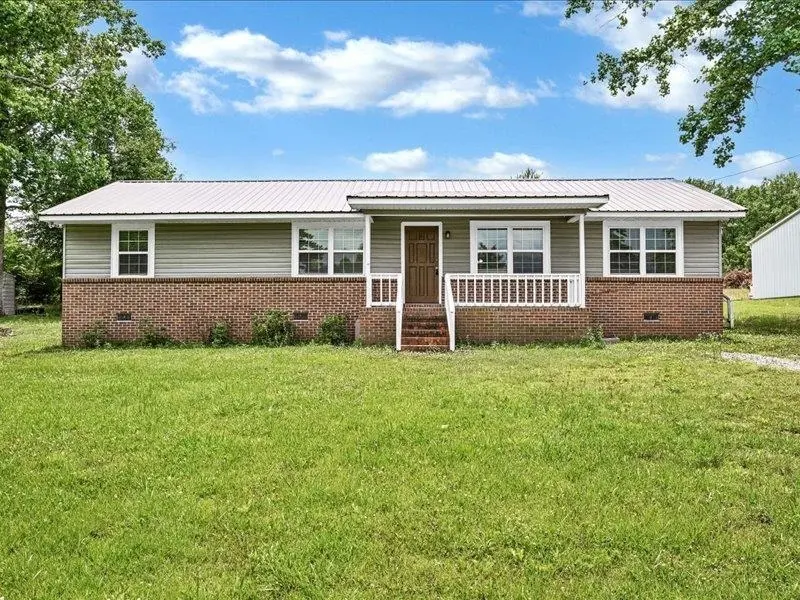
593 Co Rd 1295 · South Vinemont, AL
Flood risk 7/10 · Major
- FEMA flood zone
- X (unshaded)
- Chance of flooding over 30 yrs
- 0.99%
- Est. flood insurance / yr
- $507 – $1,088
Fire risk 4/10 · Minor
- Est. fire insurance / yr
- $916 – $1,700
Heat risk 4/10 · Minor
- Hot days now (above 104°F)
- 7 days/yr
- Hot days in 30 yrs
- 19 days/yr
Wind risk 5/10 · Moderate
- Chance of severe wind over 30 yrs
- 25.0%
Air-quality risk 2/10 · Minimal
- Unhealthy air days now
- 2 days/yr
- Unhealthy air days in 30 yrs
- 2 days/yr
Risk factors via First Street. Map © Google.
Why this score? — see what drove the C grade
The composite is a weighted blend of 9 inputs, each scored 0–100. Each bar is that input's sub-score; the figure is the points it added to the 100-point composite (weight × sub-score).
- Cash flow +23.1/30.0
- ARV discount +13.1/15.0
- DSCR +7.4/10.0
- 1% rule +4.6/10.0
- Schools +2.8/10.0
- Livability +2.8/5.0
- Rent growth +2.5/5.0
- Condition / age +2.5/5.0
- Appreciation +0.0/10.0
$210,000
🖨 Deal sheet (PDF) 📄 Offer letter ✓ Due diligence
Listing remarks
Nice 4 Bed, 2 Bath home near Vinemont. It has 2 CH & A unites, ceiling fans, crown molding in several rooms, nice location that is convenient to town and the interstate.
Key facts
- Convenient to town
- Ceiling fans
- Crown molding
Tags
Property features AI
Finance
- Other: Lot approximately 0.6 acres (150 x 210 x 150 x 210); Above-grade finished area listed as 1,816
Exterior
- Utilities: Septic tank
- Home design: Single family residence; Residential property
- Construction: Crawl space basement
- Exterior features: Storage
Interior
- Kitchen: Dishwasher; Electric cooktop; Electric range; Microwave; Refrigerator
- Bedrooms: 4 main-level bedrooms
- Flooring: Carpet; Parquet; Tile
- Bathrooms: 2 full bathrooms
- Heating & cooling: Fireplace insert (heating)
- Interior features: Laminate counters; Crown molding; Eat-in kitchen; Walk-in closet(s); Storage; Has fireplace (1)
- Laundry & utility: Gas water heater
Neighborhood map
What this means for you Summary
Snapshot
- This is a 4-bed/1.0-bath single-family listed at $210k.
Deal economics
- At list price, monthly cash flow is $309 ($4k/yr) — positive.
- The deal already cash-flows at list — no discount required.
- To meet the 1% rule (rent ≥ 1% of price), the offer needs to be $203k (3.5% below list).
- Recommended offer: $203k (3.5% below list) — sets the bar for 1% rule.
Location & tenants
- Location reads 55/100 on livability (#432 in AL) — a working-class tenant base; expect higher turnover. Strengths: cost of living A+, housing A+, crime A; Watch: amenities F, commute F, employment F.
- Cullman County (rural): math 19% / reading 49% proficiency, ranked #49 of 129 in AL (top 38%) — families likely to look elsewhere, expect single-tenant / working-renter base with shorter leases.
- Zoned schools: Vinemont Elementary School (math 29% / reading 58%, grade F, #202 of 627 statewide, top 32%, 483 students, 68% FRL); Vinemont Middle School (math 12% / reading 46%, grade F, #134 of 257 statewide, top 53%, 237 students, 63% FRL); Vinemont High School (math 27% / reading 17%, grade F, #142 of 305 statewide, top 51%, 362 students, 58% FRL).
- Market conditions: 133 active listings in the ZIP; 2 comparable units currently listed for rent nearby; 180 units permitted in Cullman County in 2024 (0 in 5+ unit buildings).
- This rent runs 39% of the median local income ($62k/yr) — at the standard rent-burdened threshold; future hikes will face affordability resistance.
Forward outlook
- Local home prices are declining (-3.0%/yr); year-one equity from $1k of loan paydown is wiped out by about $6k of value loss. Plan a longer hold.
Negotiation context
- It's been on market 16 days — a 2% lower offer ($207k) is reasonable based on typical stale-listing flexibility.
- 2 sale attempts since 20y ago with the ask held roughly flat each time — persistent listings suggest the price (not the market) is what's stuck; bring a comps-based counter.
Risks & watch-outs
- Watch-outs: flood insurance adds $66/mo.
- Climate carrying-cost: major flood risk; moderate wind risk, 25% chance of damaging wind over 30y — expect insurance premiums to compound above CPI over the hold.
Questions for the listing agent
- What's the actual annual flood-insurance premium (NFIP or private), and is the property in a SFHA with mandatory coverage?
- Is there a deadline driving the sale (1031 exchange, divorce, estate, relocation)? That informs how much negotiation room exists.
- What's the average days-on-market for RENTAL listings here right now (not sales)? A rising rental-DOM trend means longer vacancies and softer asking-rent achievability than the comps imply.
- What's the recent tenant-quality profile in this submarket — average credit score on applications, eviction rate, late-payment / NSF rate, and stable-employment percentage? A property-management company in the area should have these aggregated.
- How much new for-sale + rental construction is in the pipeline within 1–3 miles? Heavy new supply typically softens prices + rents 12–24 months out; constrained supply supports both.
Investment metrics
- 1% rule
- 0.96% ✗
- Cap rate
- 8.44%
- Cash-on-cash
- 7.66%
- DSCR
- 1.34
- GRM
- 8.6
CMA / ARV
- ARV (on-the-fly)
- $239,712
- Comps found
- 4
Show comp detail 4 sales within ~0.75 mi
| Address | Dist | Beds/Ba | Sqft | Sold | Price | $/sf | Match |
|---|---|---|---|---|---|---|---|
| 131 County Road 1296 | 0.19mi | 4/1.0 | 1,932 (+6%) | 13mo | $193,000 | $100 | 70 |
| 10 County Road 1296 | 0.18mi | 3/2.5 (-1) | 1,663 (-8%) | 14mo | $219,500 | $132 | 55 |
| 170 Co Rd 1172 | 0.65mi | 3/2.0 (-1) | 1,920 (+6%) | 2mo | $210,000 | $109 | 49 |
| 601 Co Rd 1177 | 0.72mi | 3/2.0 (-1) | 1,568 (-14%) | 10mo | $213,000 | $136 | 26 |
Match score weights: distance 35% · size 25% · config 20% · recency 20%. Top-matched comps best support the ARV.
Projected returns pro-forma
-3.0% appreciation · 3.0% rent growth · sell at horizon
- IRR
- -6.6%
- Equity multiple
- 0.75×
- Total profit
- $-14,435
- Equity at exit
- $31,312
- IRR
- 3.0%
- Equity multiple
- 1.21×
- Total profit
- $12,474
- Equity at exit
- $18,157
Cash invested: $58,800 (down + closing). Projections, not guarantees.
Landlord ↔ Tenant lean methodology
- Overall (STATE)
- 90 Strongly Landlord-Friendly
- State Alabama
- 90 Strongly Landlord-Friendly · R+15
- County
- — inherits STATE
- City
- — inherits STATE
ZIP-level market 35058
- Home prices YoY
- -17.5%
- Active inventory
- 133
- Price-to-rent
- 8.6×
Monthly cashflow live
- Estimated rent
- $2,025 medium interval (Pro) →
- Mortgage (P&I)
- −$1,101
- Tax from tax record
- −$36 /mo · $434/yr
- Insurance
- −$88
- Flood insurance flood zone
- −$66 /mo · $798/yr
- HOA
- −$0
- Vacancy / Maint / Mgmt
- −$425
- Net cashflow
- $309
Break-even live
Sensitivity live
| Price | -10% $428 | -5% $368 | +0% $309 | +5% $10 | +10% $-63 |
|---|---|---|---|---|---|
| Rent | -10% $149 | -5% $229 | +0% $309 | +5% $389 | +10% $469 |
| Rate | -1.0pp $414 | -0.5pp $362 | base $309 | +0.5pp $254 | +1.0pp $199 |
UW: 25.0% down · 7.5% · 30yr · 1.5% tax · 5.0% vac · 8.0% maint · 8.0% mgmt
Financing live
Cash to close
- Down payment
- $52,500
- Closing costs
- $6,300
- Reserves months
- —
- Total cash needed
- —
Loan-product check · same deal, 3 products live
Conventional
25% down · 7.5% · 30yr
- Down + closing
- —
- Monthly P&I
- —
- Monthly cashflow
- —
- DSCR
- —
- Eligible?
- —
Personal DTI + credit; lowest rate.
DSCR
20% down · 8.5% · 30yr
- Down + closing
- —
- Monthly P&I
- —
- Monthly cashflow
- —
- DSCR
- —
- Eligible?
- —
No personal income docs; deal must DSCR.
Hard money
10% down · 12.0% · 12mo
- Down + closing
- —
- Monthly P&I
- —
- Monthly cashflow
- —
- DSCR
- —
- Eligible?
- —
Short-term bridge; refi at stabilization.
Rent comps 2 comps
| Address | Beds | Baths | Sqft | Rent | $/sqft | DOM | Units | Dist |
|---|---|---|---|---|---|---|---|---|
| 2125 Kilpatrick Ln NW Cullman, AL | 3.0 | 2.5 | 1553 | $1,565 | $1.01 | 44d | 1 | 1.10mi |
| 2113 Kilpatrick Ln NW Cullman, AL | 3.0 | 2.5 | 1553 | $1,595 | $1.03 | 44d | 1 | 1.15mi |
Listing history 12 events
-
2026-06-19days on market $210,000 Active 16 DOM
-
2026-06-18days on market $210,000 Active 15 DOM
-
2026-06-17days on market $210,000 Active 14 DOM
-
2026-06-16days on market $210,000 Active 13 DOM
-
2026-06-15days on market $210,000 Active 12 DOM
-
2026-06-14days on market $210,000 Active 10 DOM
-
2026-06-12days on market $210,000 Active 9 DOM
-
2026-06-09days on market $210,000 Active 6 DOM
-
2026-06-08days on market $210,000 Active 5 DOM
-
2026-06-07days on market $210,000 Active 4 DOM
-
2026-06-05remarks 169-char remark
-
2026-06-05$210,000 Active 1 DOM
ⓘ Source: listings_history table (triggers on properties + properties_extension) + one-shot
backfill from property_details.listing_events for pre-trigger history.
Tax reassessment forecast AL · Resets to sale price
- Current annual tax
- $434 · $36/mo
- Projected year-2 tax
- $861 · $72/mo
- Expected delta
- +$427/yr (+$36/mo · 98.2%)
ⓘ Screening estimate from a state-policy table — verify with the county assessor before closing.
Climate risk First Street
- Flood 7/10 Severe FEMA zone X (unshaded) · 99% chance over 30 yrs
- Wildfire 4/10 Moderate
- Heat 4/10 Moderate 7 d/yr ≥104°F today · 19 d/yr by 30 yrs out
- Wind 5/10 Major 25% chance of damaging wind over 30 yrs
- Air quality 2/10 Low 2 unhealthy d/yr today · 2 by 30 yrs out
Nearby sold comps map
Loading sold comps map…
Walkable amenities ~0.75 mi
Loading nearby amenities…
Taxation est. · year 1
- Rental income
- $24,306
- − Mortgage interest
- −$11,763
- − Property taxes
- −$434
- − Insurance
- −$1,847
- − Repairs & maintenance
- −$1,944
- − Management
- −$1,944
- − Depreciation
- −$6,109
- Taxable income
- $263
- Est. tax owed @ 24.0%
- −$63
- After-tax cash flow
- $3,642/yr
For passive investors: Depreciation is non-cash, so a rental often shows a tax loss while cash-flowing — sheltering income. Rental losses are passive: they offset passive income freely, and up to $25,000/yr can offset ordinary (W-2) income if you actively participate and your MAGI is under $100k (phasing out to $0 by $150k); unused losses carry forward. On sale, claimed depreciation is recaptured at up to 25%, and gains may owe capital-gains tax (a 1031 exchange can defer both). Figures are a year-1 estimate at your 24.0% rate — not tax advice; consult a CPA.
Schools (NCES district)
- District
- Cullman County
- NCES district ID
- 0101020
- Math proficiency
- 19% ▼ -35.00%
- Reading proficiency
- 49% ▲ 1.00%
- Median HH income
- $39,449
- Composite
- 28.39/100
- National rank
- #6767
- State rank
- #49 of 129 in AL
Livability — South Vinemont
- Score
- 55/100
- State rank
- #432
- US rank
- #23262
Category grades
Schools grade is shown separately in the Schools card above.
Census & demographics
- County
- Cullman County · 47,767 people
- Metro
- Cullman, AL
- Population (ZIP)
- 11,545
- Household income
- $62,146
- Rent vs Own
- Severe rent burden
- 87.0
Population outlook (Cullman County) Hauer SSP2
- Today (2025)
- 84,522 people
- By 2030
- 85,402 · +1.0%
- By 2040
- 86,152 · +1.9%
- By 2050
- 85,202 · +0.8%
- By 2075
- 79,679 · -5.7%
- By 2100
- 66,943 · -20.8%
Race, ethnicity, and origin ACS 2023
- Neighborhood character
- Predominantly White (82%)
- Race & ethnicity
- White 82% Hispanic / Latino 10% Two or more races 4% Asian 4% Native American 1%
- Hispanic origin (detail)
- Mexican 9%
- Common ancestry
- Slovak 4% Serbian 1% Lithuanian 1%
- Foreign-born
- 6% · Canada
- Languages at home
- 89% English-only · Spanish 9% Tagalog/Filipino 1% Vietnamese 1%
Political lean MEDSL · Cullman
- 2024 margin
- Solid R (+80.5) · D 9.4% · R 89.9%
- 2008→2024 swing
- -15.3pp toward R · 2008: -65.2pp · 2024: -80.5pp
- All cycles
- 2024: R+80.5 2020: R+77.4 2016: R+77.8 2012: R+69.5 2008: R+65.2
Not yet ingested
- Civics
- —
Market trends
- HPI YoY
- ▼ -53.88%
- Current HPI
- 254.3583
- Rent YoY
- —
- Metro
- Cullman, AL
- State GDP YoY
- ▲ 2.94%
- F500 in state
- 4
Industry mix (Fortune 500 HQ in AL)
| Industry | F500 HQs | Revenue |
|---|---|---|
| Financial Services | 1 | $8B |
|
||
| Healthcare | 1 | $5B |
|
||
Price history
+61.7% since first listed3 events — show timeline
- 2026-06-03 Listed $210,000 SAARMLS
- 2022-06-16 Sold (Public Records) $210,000 Public Records
- 2006-10-12 Listed $129,900 SAARMLS
Property tax history
-0.7%/yrLatest (2025): $434 · +5.7% YoY. Source: county tax records.
Cash-flow waterfall
monthlySold comps — $/sqft
last 12 mo · ≤1 miLoading sold comps…