 Triplex
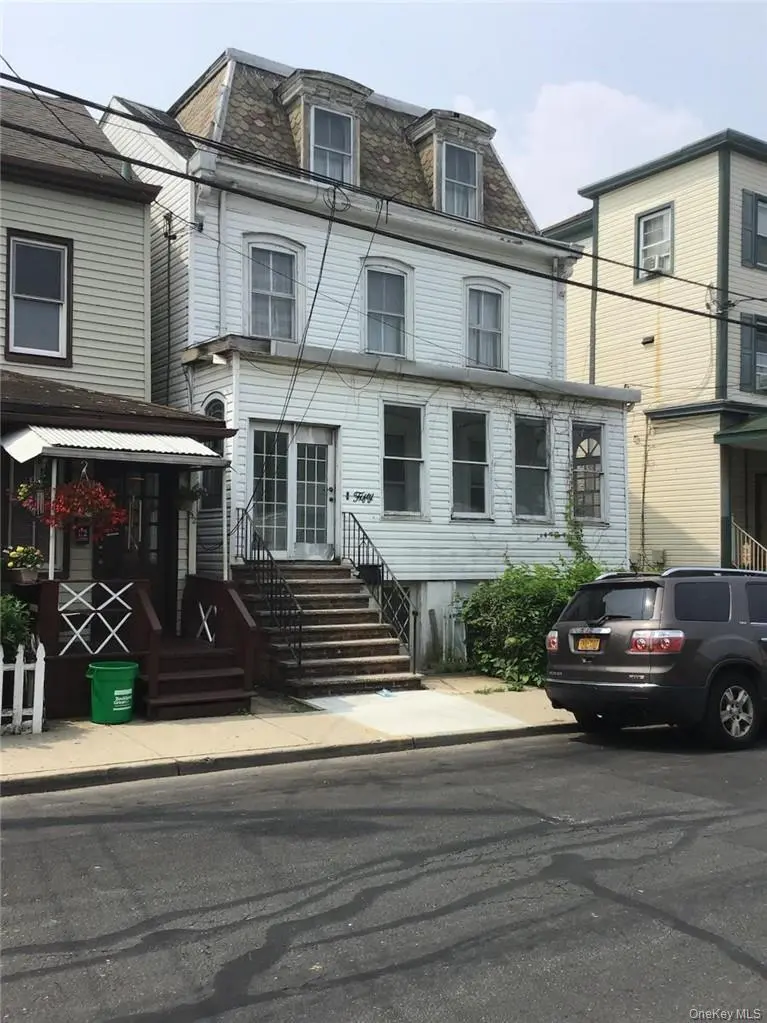
50 Broad St · Haverstraw, NY
Flood risk 1/10 · Minimal
- FEMA flood zone
- X (unshaded)
- Chance of flooding over 30 yrs
- 0.0%
- Est. flood insurance / yr
- $473 – $860
Fire risk 4/10 · Minor
- Est. fire insurance / yr
- $691 – $1,283
Heat risk 6/10 · Moderate
- Hot days now (above 100°F)
- 7 days/yr
- Hot days in 30 yrs
- 16 days/yr
Wind risk 4/10 · Minor
- Chance of severe wind over 30 yrs
- 24.0%
Air-quality risk 3/10 · Minor
- Unhealthy air days now
- 2 days/yr
- Unhealthy air days in 30 yrs
- 3 days/yr
Risk factors via First Street. Map © Google.
Why this score? — see what drove the D+ grade
The composite is a weighted blend of 9 inputs, each scored 0–100. Each bar is that input's sub-score; the figure is the points it added to the 100-point composite (weight × sub-score).
- Cash flow +22.8/30.0
- DSCR +7.3/10.0
- 1% rule +6.0/10.0
- Rent growth +4.4/5.0
- Schools +4.1/10.0
- Livability +2.9/5.0
- Condition / age +2.5/5.0
- ARV discount +0.0/15.0
- Appreciation +0.0/10.0
$879,000
🖨 Deal sheet 📄 Offer letter ✓ Due diligence
Multi-family units
County records classify this as Multi-Family (2-4 Unit). Listing-text estimate: 3 units. confirmed
Listing remarks
This incredible multi-family home is the perfect investment opportunity for any savvy investor! Located close to the Hudson River, the 3-unit home features a great location for both shopping and dining. The area is centrally located and offers convenient access to Route 9W, making commutes a breeze. Residential area, large back yard for all those outdoor activities. Large driveway for plenty of parking. Don't let this great opportunity get away! This 3-unit income property features a top-floor unit with 3–4 bedrooms, 2 full bathrooms, a large kitchen, dining room, spacious living room, and an additional small room, along with a brand-new fire escape. The middle-floor unit includes 1
Key facts
- Large driveway
- Large back yard
- 3,049 sq ft lot
Tags
Neighborhood map
What this means for you Summary
Snapshot
- This is a 3 × 2-bed/1-bath units multifamily listed at $879k.
Deal economics
- At list price, monthly cash flow is $2k ($18k/yr) — positive. Per door: $511/mo.
- The deal already cash-flows at list — no discount required.
- Meets the 1% rule at list price ($10k rent vs $879k).
- Cap rate 8.4% vs local median 5.2% in Haverstraw — top-decile yield for the area; either an underpriced asset or a hidden risk that comps aren't pricing in. Stress-test before assuming the spread holds.
Location & tenants
- Location reads 57/100 on livability (#1,087 in NY) — a working-class tenant base; expect higher turnover. Strengths: housing A+, employment B+; Watch: crime D+, amenities F, commute F.
- Haverstraw-Stony Point CSD (North Rockland) (suburban): math 41% / reading 47% proficiency, ranked #427 of 590 in NY (top 72%) — families likely to look elsewhere, expect single-tenant / working-renter base with shorter leases.
- Zoned schools: West Haverstraw Elementary School (math 22% / reading 37%, grade F, #1,729 of 2,108 statewide, top 84%, 742 students, 22% FRL); Fieldstone Middle School (math 18% / reading 46%, grade F, #511 of 729 statewide, top 71%, 1,247 students, 0% FRL); North Rockland High School (math 86% / reading 67%, grade A-, #612 of 1,100 statewide, top 56%, 2,687 students, 0% FRL) — zoned schools average 7% FRL vs 40% district-wide (33 pts lower); this property's tenant base skews higher-income than the district average.
- Market conditions: Rents rising fast (+7.6%/yr); 50 active listings in the ZIP; solid renter incomes; 429 units permitted in Rockland County in 2024 (231 in 5+ unit buildings).
- At $9,631/mo this rent would consume 154% of the median local household income ($75k/yr) (locally 791% of renters already pay >50% of income on rent) — very limited rent-growth headroom before tenants either downsize or default.
Forward outlook
- Local home prices are declining (-3.0%/yr); year-one equity from $6k of loan paydown is wiped out by about $26k of value loss. Plan a longer hold.
- Rockland County population projected at +7% by 2050 — modest demand growth; plan on rents tracking national, not racing it.
- At projected returns (-3.0% appreciation + 7.6% rent growth), your $246k cash investment doubles in ~9 years — after that, you're playing with house money.
Negotiation context
- Only 2 days on market — expect competitive offers; lowballing is unlikely to land.
- Current owner paid $325k; list at $879k implies a 170% gain — meaningful room to come down on a strong offer.
Risks & watch-outs
- Watch-outs: built in 1915 — expect roof / HVAC / electrical / plumbing capex.
- Climate carrying-cost: extreme-heat days projected 7→16/yr by 2055 (HVAC capex compounding) — expect insurance premiums to compound above CPI over the hold.
Questions for the listing agent
- Can we see the unit-by-unit rent roll, current vacancy, and any below-market leases? What's the average tenancy length?
- What capital expenditures (roof, boiler, parking lot, exteriors) have been made in the last 5 years, and what's planned in the next 2?
- Built in 1915 — when were the roof, HVAC, electrical panel, plumbing, and water heater last replaced?
- Is there a deadline driving the sale (1031 exchange, divorce, estate, relocation)? That informs how much negotiation room exists.
- Schools are F-rated, which usually means shorter tenancies and higher turnover. Who's the typical renter profile here, and what's been the actual vacancy rate?
- Crime grade is D in this area — have there been break-ins, vandalism, or insurance claims at this property in the last 3 years? What carrier currently insures it and at what premium?
- The area grade is low — what's the realistic commute time and amenity access for the typical tenant pool here? Any planned neighborhood developments (good or bad) we should know about?
- What's the average days-on-market for RENTAL listings here right now (not sales)? A rising rental-DOM trend means longer vacancies and softer asking-rent achievability than the comps imply.
- What's the recent tenant-quality profile in this submarket — average credit score on applications, eviction rate, late-payment / NSF rate, and stable-employment percentage? A property-management company in the area should have these aggregated.
- How much new apartment / multifamily construction is in the pipeline within 1–3 miles? Heavy new supply (>2% of stock underway) typically softens rents 12–24 months out; light construction supports rent growth.
Investment metrics
- 1% rule
- 1.10% ✓
- Cap rate
- 8.39%
- Cash-on-cash
- 7.48%
- DSCR
- 1.33
- GRM
- 7.6
CMA / ARV
- ARV (on-the-fly)
- $725,220
- Comps found
- 6
Show comp detail 6 sales within ~0.75 mi
| Address | Dist | Beds/Ba | Sqft | Sold | Price | $/sf | Match |
|---|---|---|---|---|---|---|---|
| 50 Broad St | 0.00mi | 7/— (+1) | 3,060 (0%) | 1mo | $875,000 | $286 | 94 |
| 55 New Main St | 0.30mi | 6/2.0 | 2,996 (-2%) | 3mo | $676,200 | $226 | 76 |
| 19 Third St | 0.11mi | 7/4.0 (+1) | 3,240 (+6%) | 7mo | $768,000 | $237 | 70 |
| 13 Third St | 0.09mi | 5/3.0 (-1) | 2,844 (-7%) | 13mo | $480,000 | $169 | 68 |
| 19 Conger Ave | 0.44mi | 7/3.0 (+1) | 3,250 (+6%) | 10mo | $919,000 | $283 | 56 |
| 68 Hudson Ave | 0.46mi | 5/2.0 (-1) | 2,907 (-5%) | 10mo | $610,000 | $210 | 53 |
Match score weights: distance 35% · size 25% · config 20% · recency 20%. Top-matched comps best support the ARV.
Projected returns pro-forma
-3.0% appreciation · 7.62% rent growth · sell at horizon
- IRR
- 0.2%
- Equity multiple
- 1.01×
- Total profit
- $2,259
- Equity at exit
- $131,062
- IRR
- 14.1%
- Equity multiple
- 2.38×
- Total profit
- $339,904
- Equity at exit
- $76,000
Cash invested: $246,120 (down + closing). Projections, not guarantees.
Landlord ↔ Tenant lean methodology
- Overall (STATE)
- 15 Strongly Tenant-Friendly
- State New York
- 15 Strongly Tenant-Friendly · D+10
- County
- — inherits STATE
- City
- — inherits STATE
ZIP-level market 10927
- Home prices YoY
- -23.6%
- Rents YoY
- 7.6%
- Active inventory
- 50
- Price-to-rent
- 22.8×
Monthly cashflow live
- Estimated rent
- $9,631 high interval (Pro) →
- Mortgage (P&I)
- −$4,610
- Tax est. 1.5%
- −$1,099 /mo · $13,185/yr
- Insurance
- −$366
- HOA
- −$0
- Vacancy / Maint / Mgmt
- −$2,023
- Net cashflow
- $1,534
Break-even live
3-unit breakdown (identical units grouped — click to expand)
| Units | Beds | Baths | Est. rent |
|---|---|---|---|
| 3× units | 2 | 1 | $9,630 |
| #1 | 2 | 1 | $3,210 |
| #2 | 2 | 1 | $3,210 |
| #3 | 2 | 1 | $3,210 |
| Total (3 units) | $9,631 | ||
UW: 25.0% down · 7.5% · 30yr · 1.5% tax · 5.0% vac · 8.0% maint · 8.0% mgmt
Financing live
Cash to close
- Down payment
- $219,750
- Closing costs
- $26,370
- Reserves months
- —
- Total cash needed
- —
Loan-product check · same deal, 3 products live
Conventional
25% down · 7.5% · 30yr
- Down + closing
- —
- Monthly P&I
- —
- Monthly cashflow
- —
- DSCR
- —
- Eligible?
- —
Personal DTI + credit; lowest rate.
DSCR
20% down · 8.5% · 30yr
- Down + closing
- —
- Monthly P&I
- —
- Monthly cashflow
- —
- DSCR
- —
- Eligible?
- —
No personal income docs; deal must DSCR.
Hard money
10% down · 12.0% · 12mo
- Down + closing
- —
- Monthly P&I
- —
- Monthly cashflow
- —
- DSCR
- —
- Eligible?
- —
Short-term bridge; refi at stabilization.
Listing history 3 events
-
2026-04-23status Pending
-
2026-04-17$879,000 Active
-
2023-06-27soldstatus $325,000
ⓘ Source: listings_history table (triggers on properties + properties_extension) + one-shot
backfill from property_details.listing_events for pre-trigger history.
Climate risk First Street
- Flood 1/10 Low FEMA zone X (unshaded) · 0% chance over 30 yrs
- Wildfire 4/10 Moderate
- Heat 6/10 Major 7 d/yr ≥100°F today · 16 d/yr by 30 yrs out
- Wind 4/10 Moderate 24% chance of damaging wind over 30 yrs
- Air quality 3/10 Moderate 2 unhealthy d/yr today · 3 by 30 yrs out
Nearby sold comps map
Loading sold comps map…
Walkable amenities ~0.75 mi
Loading nearby amenities…
Taxation est. · year 1
- Rental income
- $115,572
- − Mortgage interest
- −$49,238
- − Property taxes
- −$13,185
- − Insurance
- −$4,395
- − Repairs & maintenance
- −$9,246
- − Management
- −$9,246
- − Depreciation
- −$25,571
- Taxable income
- $4,692
- Est. tax owed @ 24.0%
- −$1,126
- After-tax cash flow
- $17,281/yr
For passive investors: Depreciation is non-cash, so a rental often shows a tax loss while cash-flowing — sheltering income. Rental losses are passive: they offset passive income freely, and up to $25,000/yr can offset ordinary (W-2) income if you actively participate and your MAGI is under $100k (phasing out to $0 by $150k); unused losses carry forward. On sale, claimed depreciation is recaptured at up to 25%, and gains may owe capital-gains tax (a 1031 exchange can defer both). Figures are a year-1 estimate at your 24.0% rate — not tax advice; consult a CPA.
Schools (NCES district)
- District
- Haverstraw-Stony Point CSD (North Rockland)
- NCES district ID
- 3614010
- Math proficiency
- 41% ▼ -7.00%
- Reading proficiency
- 47% ▼ -1.00%
- Median HH income
- $80,218
- Composite
- 40.68/100
- National rank
- #3672
- State rank
- #427 of 590 in NY
Livability — Haverstraw
- Score
- 57/100
- State rank
- #1087
- US rank
- #21649
Category grades
Schools grade is shown separately in the Schools card above.
Census & demographics
- Census place
- Haverstraw, NY
- County
- Rockland County · 98,828 people
- City population
- 12,325
- Metro
- New York-Newark-Jersey City, NY-NJ-PA
- Population (ZIP)
- 12,325
- Household income
- $75,167
- Rent vs Own
- Severe rent burden
- 791.0
Population outlook (Rockland County) Hauer SSP2
- Today (2025)
- 339,642 people
- By 2030
- 345,987 · +1.9%
- By 2040
- 357,178 · +5.2%
- By 2050
- 362,456 · +6.7%
- By 2075
- 367,281 · +8.1%
- By 2100
- 328,211 · -3.4%
Race, ethnicity, and origin ACS 2023
- Neighborhood character
- Diverse neighborhood (Simpson 0.57)
- Race & ethnicity
- Hispanic / Latino 61% Two or more races 24% White 18% Black 17% Asian 3% Native American 2%
- Hispanic origin (detail)
- Mexican 3% Puerto Rican 8% Dominican 32%
- Common ancestry
- Hispanic 5% Romanian 1% Scotch-Irish 1%
- Foreign-born
- 43% · Canada, Dominican Republic, Guatemala
- Languages at home
- 38% English-only · Spanish 53% French/Haitian/Cajun 6% Other Asian/Pacific 2%
Political lean MEDSL · Rockland
- 2024 margin
- R (+11.8) · D 44.1% · R 55.9%
- 2008→2024 swing
- -17.7pp toward R · 2008: 5.9pp · 2024: -11.8pp
- All cycles
- 2024: R+11.8 2020: D+1.7 2016: D+5.1 2012: D+6.6 2008: D+5.9
Not yet ingested
- Civics
- —
Market trends
- HPI YoY
- ▼ -73.63%
- Current HPI
- 238.4313
- Rent YoY
- ▲ 7.62%
- Metro
- New York-Newark-Jersey City, NY-NJ-PA
- State GDP YoY
- ▲ 2.60%
- F500 in state
- 92
Industry mix (Fortune 500 HQ in NY)
| Industry | F500 HQs | Revenue |
|---|---|---|
| Financial Services | 10 | $950B |
|
||
| Consumer Goods | 9 | $162B |
|
||
| Insurance | 4 | $225B |
|
||
| Telecommunications | 2 | $144B |
|
||
| Pharmaceuticals | 2 | $112B |
|
||
| Media / Entertainment | 2 | $69B |
|
||
Price history
+170.5% since first listed3 events — show timeline
- 2026-04-23 Pending — OneKey® MLS as Distributed by MLS Grid
- 2026-04-17 Listed $879,000 OneKey® MLS as Distributed by MLS Grid
- 2023-06-27 Sold (Public Records) $325,000 Public Records
Property tax history
+31.6%/yrLatest (2025): $73,377 · +7.0% YoY. Source: county tax records.
Cash-flow waterfall
monthlySold comps — $/sqft
last 12 mo · ≤1 miLoading sold comps…