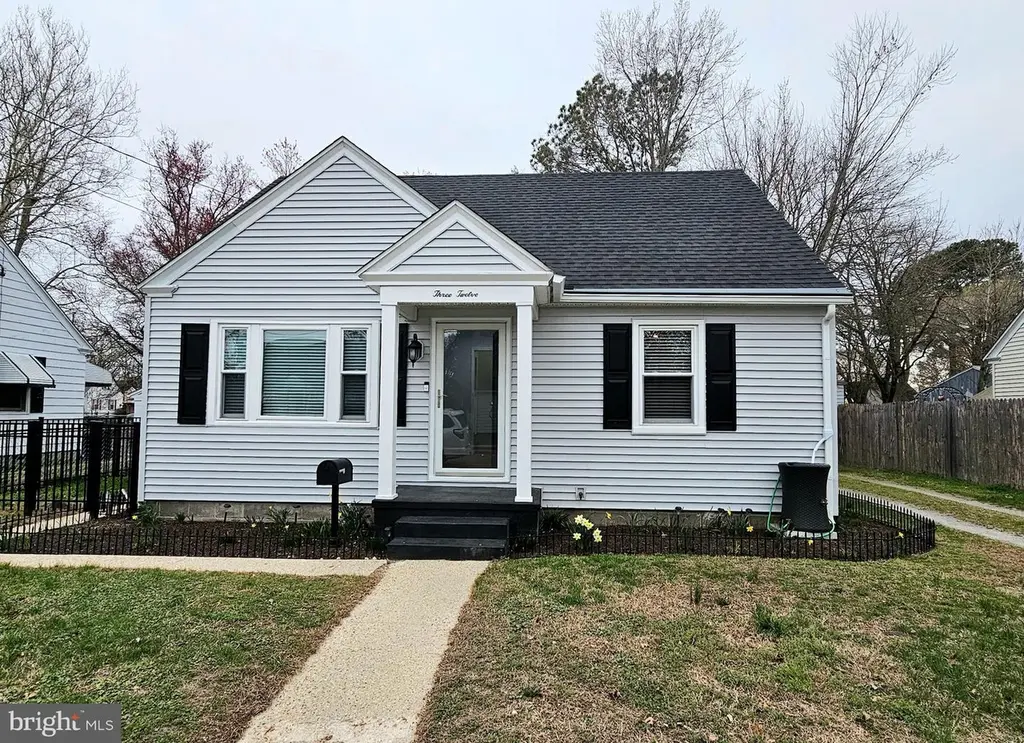
312 S Haven Ave · Salisbury, MD
Flood risk 1/10 · Minimal
- FEMA flood zone
- X (unshaded)
- Chance of flooding over 30 yrs
- 0.0%
- Est. flood insurance / yr
- $507 – $1,088
Fire risk 1/10 · Minimal
- Est. fire insurance / yr
- $755 – $1,403
Heat risk 9/10 · Severe
- Hot days now (above 105°F)
- 7 days/yr
- Hot days in 30 yrs
- 16 days/yr
Wind risk 7/10 · Major
- Chance of severe wind over 30 yrs
- 78.0%
Air-quality risk 2/10 · Minimal
- Unhealthy air days now
- 1 days/yr
- Unhealthy air days in 30 yrs
- 2 days/yr
Risk factors via First Street. Map © Google.
Why this score? — see what drove the D+ grade
The composite is a weighted blend of 9 inputs, each scored 0–100. Each bar is that input's sub-score; the figure is the points it added to the 100-point composite (weight × sub-score).
- Cash flow +16.6/30.0
- ARV discount +12.6/15.0
- DSCR +5.1/10.0
- Rent growth +3.4/5.0
- 1% rule +3.2/10.0
- Livability +3.0/5.0
- Condition / age +2.5/5.0
- Schools +1.9/10.0
- Appreciation +0.0/10.0
$200,000
🖨 Deal sheet (PDF) 📄 Offer letter ✓ Due diligence
Listing remarks MLS
Spacious 3 bedroom residential property within walking distance from both Bennett High School and Salisbury University. Second floor has been completely remodeled adding a 3rd very large bedroom. Centrally located within walking distance from dining, shopping and fitness centers. Property is ideal for location and priced to sell quickly. Don't miss out on this opportunity while looking for your first home or investment property!
Key facts
- 5,335 sq ft lot
- 2 parking spots
- Built 1954
Property features AI
Exterior
- Parking: Driveway parking (2 spaces); Total of 2 garage/parking spaces
- Utilities: Public water; Public sewer; Electric hot water
- Home design: Detached single-family home; Architectural shingle roof; Above-grade finished living area reported by assessor
- Construction: Stick-built construction with vinyl siding; Block foundation; Installed window screens
- Exterior features: Patio(s); Rear wrought iron fencing; Not in a federal flood zone; Located in city limits (Salisbury)
Interior
- Kitchen: Stove; Refrigerator
- Bedrooms: Two main-level bedrooms; One upper-level bedroom
- Flooring: Hardwood
- Bathrooms: One full bathroom (main level)
- Heating & cooling: Heat pump(s); Electric baseboard heating; Central air (electric)
- Interior features: Hardwood flooring; Living Room; Full Bath
- Laundry & utility: Washer; Dryer; Water heater
Neighborhood map
What this means for you Summary
Snapshot
- This is a 3-bed/1.0-bath single-family listed at $200k.
Deal economics
- At list price, monthly cash flow is $119 ($1k/yr) — positive.
- The deal already cash-flows at list — no discount required.
- To meet the 1% rule (rent ≥ 1% of price), the offer needs to be $165k (17.6% below list).
- Recommended offer: $165k (17.6% below list) — sets the bar for 1% rule.
- Cap rate 7.0% vs local median 4.8% in Salisbury — top-decile yield for the area; either an underpriced asset or a hidden risk that comps aren't pricing in. Stress-test before assuming the spread holds.
Location & tenants
- Location reads 60/100 on livability (#351 in MD) — a middle-class / working-renter tenant base. Strengths: health & safety A+, cost of living A, housing A; Watch: crime F, amenities F, commute F.
- Wicomico County Public Schools (urban): math 16% / reading 26% proficiency, ranked #19 of 24 in MD (top 79%) — low school quality limits family demand, transient renter base, plan for 1-2y turnover.
- Zoned schools: Prince Street School (math 5% / reading 8%, grade F, #740 of 860 statewide, top 87%, 854 students, 64% FRL); Bennett Middle (math 13% / reading 29%, grade F, #134 of 225 statewide, top 62%, 906 students, 48% FRL); James M. Bennett High (math 55% / reading 66%, grade C+, #71 of 222 statewide, top 32%, 1,343 students, 44% FRL) — zoned schools at 52% FRL track the district average.
- Market conditions: Rents rising (+3.8%/yr); 201 active listings in the ZIP; 23 comparable units currently listed for rent nearby; rentals lingering (median 46d on market — plan ~5-8 weeks vacancy on turnover, expect pricing pressure); 52% of comp listings sitting > 30 days — soft ceiling on asking rent; 278 units permitted in Wicomico County in 2024 (44 in 5+ unit buildings).
Forward outlook
- Local home prices are declining (-3.0%/yr); year-one equity from $1k of loan paydown is wiped out by about $6k of value loss. Plan a longer hold.
- Wicomico County population projected at +14% by 2050 — modest demand growth; plan on rents tracking national, not racing it.
Negotiation context
- It's been on market 31 days — a 3% lower offer ($194k) is reasonable based on typical stale-listing flexibility.
- 4 sale attempts since 26y ago with the ask held roughly flat each time — persistent listings suggest the price (not the market) is what's stuck; bring a comps-based counter.
- Current owner paid $67k; list at $200k implies a 199% gain — meaningful room to come down on a strong offer.
Risks & watch-outs
- Watch-outs: built in 1954 — expect roof / HVAC / electrical / plumbing capex.
- Climate carrying-cost: major wind risk, 78% chance of damaging wind over 30y; extreme-heat days projected 7→16/yr by 2055 (HVAC capex compounding) — expect insurance premiums to compound above CPI over the hold.
Questions for the listing agent
- It's been on market 31 days. Have you received any prior offers? Is the seller open to a 18% concession, seller financing, or rate buy-down credit?
- Built in 1954 — when were the roof, HVAC, electrical panel, plumbing, and water heater last replaced?
- Is there a deadline driving the sale (1031 exchange, divorce, estate, relocation)? That informs how much negotiation room exists.
- Schools are D-rated, which usually means shorter tenancies and higher turnover. Who's the typical renter profile here, and what's been the actual vacancy rate?
- Crime grade is F in this area — have there been break-ins, vandalism, or insurance claims at this property in the last 3 years? What carrier currently insures it and at what premium?
- The area grade is low — what's the realistic commute time and amenity access for the typical tenant pool here? Any planned neighborhood developments (good or bad) we should know about?
- What's the average days-on-market for RENTAL listings here right now (not sales)? A rising rental-DOM trend means longer vacancies and softer asking-rent achievability than the comps imply.
- What's the recent tenant-quality profile in this submarket — average credit score on applications, eviction rate, late-payment / NSF rate, and stable-employment percentage? A property-management company in the area should have these aggregated.
- How much new for-sale + rental construction is in the pipeline within 1–3 miles? Heavy new supply typically softens prices + rents 12–24 months out; constrained supply supports both.
Investment metrics
- 1% rule
- 0.82% ✗
- Cap rate
- 7.01%
- Cash-on-cash
- 2.56%
- DSCR
- 1.11
- GRM
- 10.1
CMA / ARV
- ARV (on-the-fly)
- $225,432
- Comps found
- 12
Show comp detail 12 sales within ~0.75 mi
| Address | Dist | Beds/Ba | Sqft | Sold | Price | $/sf | Match |
|---|---|---|---|---|---|---|---|
| 312 S Haven Ave | 0.00mi | 3/1.0 | 1,212 (0%) | 1mo | $197,000 | $163 | 99 |
| 716 Edgar Dr | 0.34mi | 3/1.0 | 1,288 (+6%) | 5mo | $239,900 | $186 | 69 |
| 316 Pryor Ave | 0.07mi | 3/2.0 | 1,350 (+11%) | 6mo | $275,000 | $204 | 69 |
| 703 Madison St | 0.43mi | 4/1.5 (+1) | 1,176 (-3%) | 4mo | $249,500 | $212 | 65 |
| 912 Hanover St | 0.59mi | 2/1.0 (-1) | 1,194 (-2%) | 2mo | $184,000 | $154 | 64 |
| 902 Hanson St | 0.55mi | 4/2.0 (+1) | 1,260 (+4%) | 4mo | $233,000 | $185 | 56 |
| 305 Prince St | 0.43mi | 3/1.5 | 1,061 (-12%) | 6mo | $215,000 | $203 | 52 |
| 505 E College Ave | 0.36mi | 4/2.0 (+1) | 1,344 (+11%) | 5mo | $220,000 | $164 | 52 |
| 406 Grove Pl | 0.36mi | 4/2.0 (+1) | 1,350 (+11%) | 6mo | $141,000 | $104 | 50 |
| 221 North Blvd | 0.62mi | 4/2.0 (+1) | 1,268 (+5%) | 6mo | $220,000 | $174 | 50 |
| 213 Lloyd St | 0.55mi | 4/2.0 (+1) | 1,330 (+10%) | 2mo | $252,500 | $190 | 47 |
| 232 Ohio Ave | 0.70mi | 3/1.5 | 1,068 (-12%) | 7mo | $230,000 | $215 | 40 |
Match score weights: distance 35% · size 25% · config 20% · recency 20%. Top-matched comps best support the ARV.
Projected returns pro-forma
-3.0% appreciation · 3.78% rent growth · sell at horizon
- IRR
- -11.6%
- Equity multiple
- 0.58×
- Total profit
- $-23,600
- Equity at exit
- $29,821
- IRR
- -1.5%
- Equity multiple
- 0.90×
- Total profit
- $-5,728
- Equity at exit
- $17,292
Cash invested: $56,000 (down + closing). Projections, not guarantees.
Landlord ↔ Tenant lean methodology
- Overall (STATE)
- 27 Tenant-Leaning
- State Maryland
- 27 Tenant-Leaning · D+14
- County
- — inherits STATE
- City
- — inherits STATE
ZIP-level market 21804
- Home prices YoY
- -26.7%
- Rents YoY
- 3.8%
- Active inventory
- 201
- Price-to-rent
- 10.1×
Monthly cashflow live
- Estimated rent
- $1,647 high interval (Pro) →
- Mortgage (P&I)
- −$1,049
- Tax from tax record
- −$50 /mo · $596/yr
- Insurance
- −$83
- HOA
- −$0
- Vacancy / Maint / Mgmt
- −$346
- Net cashflow
- $119
Break-even live
Sensitivity live
| Price | -10% $233 | -5% $176 | +0% $119 | +5% $63 | +10% $6 |
|---|---|---|---|---|---|
| Rent | -10% $-11 | -5% $54 | +0% $119 | +5% $184 | +10% $250 |
| Rate | -1.0pp $220 | -0.5pp $170 | base $119 | +0.5pp $68 | +1.0pp $15 |
UW: 25.0% down · 7.5% · 30yr · 1.5% tax · 5.0% vac · 8.0% maint · 8.0% mgmt
Financing live
Cash to close
- Down payment
- $50,000
- Closing costs
- $6,000
- Reserves months
- —
- Total cash needed
- —
Loan-product check · same deal, 3 products live
Conventional
25% down · 7.5% · 30yr
- Down + closing
- —
- Monthly P&I
- —
- Monthly cashflow
- —
- DSCR
- —
- Eligible?
- —
Personal DTI + credit; lowest rate.
DSCR
20% down · 8.5% · 30yr
- Down + closing
- —
- Monthly P&I
- —
- Monthly cashflow
- —
- DSCR
- —
- Eligible?
- —
No personal income docs; deal must DSCR.
Hard money
10% down · 12.0% · 12mo
- Down + closing
- —
- Monthly P&I
- —
- Monthly cashflow
- —
- DSCR
- —
- Eligible?
- —
Short-term bridge; refi at stabilization.
Rent comps 23 comps
| Address | Beds | Baths | Sqft | Rent | $/sqft | DOM | Units | Dist |
|---|---|---|---|---|---|---|---|---|
| 315 Princeton Ave Salisbury, MD | 4.0 | 1.0 | 1023 | $1,500 | $1.47 | 45d | 1 | 0.06mi |
| 1014 Cecil St Salisbury, MD | 3.0 | 1.0 | 1023 | $1,500 | $1.47 | 45d | 1 | 0.16mi |
| 306 Carrollton Ave Salisbury, MD | 4.0 | 1.0 | 1163 | $1,700 | $1.46 | 45d | 1 | 0.16mi |
| 1008 Adams Ave Unit 11D Salisbury, MD | 2.0 | 1.0 | 918 | $1,250 | $1.36 | 23d | 1 | 0.18mi |
| 1022 Adams Ave Unit 1D Salisbury, MD | 2.0 | 1.0 | 918 | $1,400 | $1.53 | 45d | 1 | 0.18mi |
| 1027 Adams Ave Ste A Salisbury, MD | 2.0 | 1.0–2.0 | 576 | $1,425 | $2.47 | 15d | 13 | 0.25mi |
| 504 Juniper St Salisbury, MD | 3.0 | 1.0 | 960 | $1,595 | $1.66 | 23d | 1 | 0.30mi |
| 719 Shiloh St Unit 1 Salisbury, MD | 3.0 | 1.0 | 1152 | $1,625 | $1.41 | 15d | 1 | 0.37mi |
| 1017 Tyler Ave Salisbury, MD | 2.0 | 1.0 | 1024 | $1,650 | $1.61 | 23d | 1 | 0.38mi |
| 146 Onley Rd Salisbury, MD | 3.0 | 1.0 | 960 | $1,550 | $1.61 | 45d | 1 | 0.54mi |
| 101 Cedar Xing Salisbury, MD | 4.0 | 2.0–4.0 | 965 | $1,375 | $1.42 | 15d | 9 | 0.56mi |
| 231 Newton St Unit A Salisbury, MD | 3.0 | 1.0 | 1000 | $1,595 | $1.59 | 45d | 1 | 0.82mi |
| 231 Newton St Unit B Salisbury, MD | 2.0 | 1.0 | 736 | $1,400 | $1.90 | 45d | 1 | 0.82mi |
| 826 S Schumaker Dr Salisbury, MD | 1.0–3.0 | 1.0–2.5 | 1022 | $1,876 | $1.84 | 15d | 5 | 0.93mi |
| 1000 Marley Manor Dr Salisbury, MD | 2.0–3.0 | 2.0 | 1225 | $2,076 | $1.69 | 15d | 20 | 0.97mi |
| 1405 Bantry Ln Salisbury, MD | 2.0 | 2.0 | 986 | $1,800 | $1.83 | 23d | 1 | 1.03mi |
| 304 Glen Ave Salisbury, MD | 1.0–2.0 | 1.0 | 675 | $1,300 | $1.93 | 45d | 4 | 1.04mi |
| 518 Alabama Ave Salisbury, MD | 1.0–3.0 | 1.0–2.5 | 1028 | $1,784 | $1.73 | 15d | 14 | 1.07mi |
| 550 Riverside Dr Salisbury, MD | 3.0 | 2.0 | 1250 | $1,975 | $1.58 | 45d | 1 | 1.09mi |
| 218 W Main St Unit 401 Salisbury, MD | 2.0 | 1.0 | 1060 | $1,695 | $1.60 | 45d | 1 | 1.10mi |
| 529 E William St Salisbury, MD | 3.0 | 1.0 | 1057 | $1,495 | $1.41 | 23d | 1 | 1.18mi |
| 308 N Division St #12 Salisbury, MD | 2.0 | 1.0 | 990 | $1,295 | $1.31 | 45d | 1 | 1.29mi |
| 255 Canal Park Dr Apt C Salisbury, MD | 4.0 | 2.0 | 1250 | $1,600 | $1.28 | 45d | 1 | 1.32mi |
Listing history 12 events
-
2026-04-26historical Active Under Contract
-
2026-03-26$200,000 Active
-
2014-02-22soldstatus $67,000 432-char remark
Show marketing remark (432 chars)
Spacious 3 bedroom residential property within walking distance from both Bennett High School and Salisbury University. Second floor has been completely remodeled adding a 3rd very large bedroom. Centrally located within walking distance from dining, shopping and fitness centers. Property is ideal for location and priced to sell quickly. Don't miss out on this opportunity while looking for your first home or investment property!
-
2014-02-14soldstatus $67,000
-
2014-01-01$69,995 432-char remark
Show marketing remark (432 chars)
Spacious 3 bedroom residential property within walking distance from both Bennett High School and Salisbury University. Second floor has been completely remodeled adding a 3rd very large bedroom. Centrally located within walking distance from dining, shopping and fitness centers. Property is ideal for location and priced to sell quickly. Don't miss out on this opportunity while looking for your first home or investment property!
-
2002-11-27soldstatus $73,900
-
2002-11-15soldstatus $75,900 202-char remark
Show marketing remark (202 chars)
Nicely updated- fenced back yard, central air, remodeled bathroom, new carpet on finished second floor (could be 3rd BR), great starter home! Settlement contingent on owners buying home of their choice.
-
2002-09-30historical 202-char remark
Show marketing remark (202 chars)
Nicely updated- fenced back yard, central air, remodeled bathroom, new carpet on finished second floor (could be 3rd BR), great starter home! Settlement contingent on owners buying home of their choice.
-
2002-09-16$73,900 202-char remark
Show marketing remark (202 chars)
Nicely updated- fenced back yard, central air, remodeled bathroom, new carpet on finished second floor (could be 3rd BR), great starter home! Settlement contingent on owners buying home of their choice.
-
2000-10-04soldstatus $56,000
-
2000-09-29soldstatus $56,000
-
2000-08-24$56,000
ⓘ Source: listings_history table (triggers on properties + properties_extension) + one-shot
backfill from property_details.listing_events for pre-trigger history.
Tax reassessment forecast MD · Partial reset (capped growth)
- Current annual tax
- $596 · $50/mo
- Projected year-2 tax
- $1,388 · $116/mo
- Expected delta
- +$792/yr (+$66/mo · 132.8%)
ⓘ Screening estimate from a state-policy table — verify with the county assessor before closing.
Climate risk First Street
- Flood 1/10 Low FEMA zone X (unshaded) · 0% chance over 30 yrs
- Wildfire 1/10 Low
- Heat 9/10 Extreme 7 d/yr ≥105°F today · 16 d/yr by 30 yrs out
- Wind 7/10 Severe 78% chance of damaging wind over 30 yrs
- Air quality 2/10 Low 1 unhealthy d/yr today · 2 by 30 yrs out
Nearby sold comps map
Loading sold comps map…
Walkable amenities ~0.75 mi
Loading nearby amenities…
Taxation est. · year 1
- Rental income
- $19,766
- − Mortgage interest
- −$11,203
- − Property taxes
- −$596
- − Insurance
- −$1,000
- − Repairs & maintenance
- −$1,581
- − Management
- −$1,581
- − Depreciation
- −$5,818
- Taxable loss
- −$2,015
- Est. tax savings @ 24.0%
- +$483
- After-tax cash flow
- $1,916/yr
For passive investors: Depreciation is non-cash, so a rental often shows a tax loss while cash-flowing — sheltering income. Rental losses are passive: they offset passive income freely, and up to $25,000/yr can offset ordinary (W-2) income if you actively participate and your MAGI is under $100k (phasing out to $0 by $150k); unused losses carry forward. On sale, claimed depreciation is recaptured at up to 25%, and gains may owe capital-gains tax (a 1031 exchange can defer both). Figures are a year-1 estimate at your 24.0% rate — not tax advice; consult a CPA.
Schools (NCES district)
- District
- Wicomico County Public Schools
- NCES district ID
- 2400690
- Math proficiency
- 16% ▼ -18.00%
- Reading proficiency
- 26% ▼ -13.00%
- Median HH income
- $51,745
- Composite
- 18.87/100
- National rank
- #8860
- State rank
- #19 of 24 in MD
Livability — Salisbury
- Score
- 60/100
- State rank
- #351
- US rank
- #18948
Category grades
Schools grade is shown separately in the Schools card above.
Census & demographics
- Census place
- Salisbury, MD
- County
- Wicomico County · 75,969 people
- City population
- 70,518
- Metro
- Salisbury, MD-DE
- Population (ZIP)
- 40,430
- Household income
- $73,156
- Rent vs Own
- Severe rent burden
- 2096.0
Population outlook (Wicomico County) Hauer SSP2
- Today (2025)
- 108,548 people
- By 2030
- 111,783 · +3.0%
- By 2040
- 118,139 · +8.8%
- By 2050
- 123,641 · +13.9%
- By 2075
- 139,784 · +28.8%
- By 2100
- 145,334 · +33.9%
Race, ethnicity, and origin ACS 2023
- Neighborhood character
- Diverse neighborhood (Simpson 0.61)
- Race & ethnicity
- White 54% Black 30% Two or more races 9% Hispanic / Latino 7% Asian 3%
- Hispanic origin (detail)
- Mexican 4% Dominican 1%
- Common ancestry
- Hispanic 8% Romanian 3% Slovak 1%
- Foreign-born
- 13% · Canada, Vietnam, South Korea
- Languages at home
- 83% English-only · French/Haitian/Cajun 7% Spanish 5% Other Indo-European 2%
Political lean MEDSL · Wicomico
- 2024 margin
- Lean R (+5.5) · D 46.1% · R 51.5% · Other 2.4%
- 2008→2024 swing
- +0.3pp no change · 2008: -5.8pp · 2024: -5.5pp
- All cycles
- 2024: R+5.5 2020: R+1.9 2016: R+11.6 2012: R+6.9 2008: R+5.8
Not yet ingested
- Civics
- —
Market trends
- HPI YoY
- ▼ -84.15%
- Current HPI
- 230.6099
- Rent YoY
- ▲ 3.78%
- Metro
- Salisbury, MD-DE
- State GDP YoY
- ▲ 2.97%
- F500 in state
- 12
Industry mix (Fortune 500 HQ in MD)
| Industry | F500 HQs | Revenue |
|---|---|---|
| Aerospace / Defense | 1 | $71B |
|
||
| Utilities | 1 | $25B |
|
||
| Hotels | 1 | $24B |
|
||
| Consumer Goods | 1 | $7B |
|
||
| Real Estate | 1 | $6B |
|
||
| Chemicals | 1 | $2B |
|
||
Price history
+257.1% since first listed12 events — show timeline
- 2026-04-26 Contingent — BRIGHT MLS
- 2026-03-26 Listed $200,000 BRIGHT MLS
- 2014-02-22 Sold (MLS) $67,000 BRIGHT MLS
- 2014-02-14 Sold (Public Records) $67,000 Public Records
- 2014-01-01 Listed $69,995 BRIGHT MLS
- 2002-11-27 Sold (Public Records) $73,900 Public Records
- 2002-11-15 Sold (MLS) $75,900 BRIGHT MLS
- 2002-09-30 Listing Removed — BRIGHT MLS
- 2002-09-16 Listed $73,900 BRIGHT MLS
- 2000-10-04 Sold (Public Records) $56,000 Public Records
- 2000-09-29 Sold (MLS) $56,000 BRIGHT MLS
- 2000-08-24 Listed $56,000 BRIGHT MLS
Property tax history
-4.1%/yrLatest (2025): $596 · +1.6% YoY. Source: county tax records.
Cash-flow waterfall
monthlySold comps — $/sqft
last 12 mo · ≤1 miLoading sold comps…