3 Michael St · Riverside, TX
Flood risk 5/10 · Moderate
- FEMA flood zone
- A
- Chance of flooding over 30 yrs
- 0.65%
- Est. flood insurance / yr
- $1,009 – $1,996
Fire risk 4/10 · Minor
- Est. fire insurance / yr
- $1,222 – $2,270
Heat risk 8/10 · Major
- Hot days now (above 111°F)
- 7 days/yr
- Hot days in 30 yrs
- 24 days/yr
Wind risk 8/10 · Major
- Chance of severe wind over 30 yrs
- 93.0%
Air-quality risk 1/10 · Minimal
- Unhealthy air days now
- 0 days/yr
- Unhealthy air days in 30 yrs
- 0 days/yr
Risk factors via First Street. Map © Google.
Why this score? — see what drove the C+ grade
The composite is a weighted blend of 9 inputs, each scored 0–100. Each bar is that input's sub-score; the figure is the points it added to the 100-point composite (weight × sub-score).
- Cash flow +30.0/30.0
- 1% rule +10.0/10.0
- DSCR +10.0/10.0
- Rent growth +3.2/5.0
- Livability +3.0/5.0
- Schools +2.6/10.0
- Condition / age +2.5/5.0
- ARV discount +0.0/15.0
- Appreciation +0.0/10.0
$55,000
🖨 Deal sheet 📄 Offer letter ✓ Due diligence
Listing remarks MLS
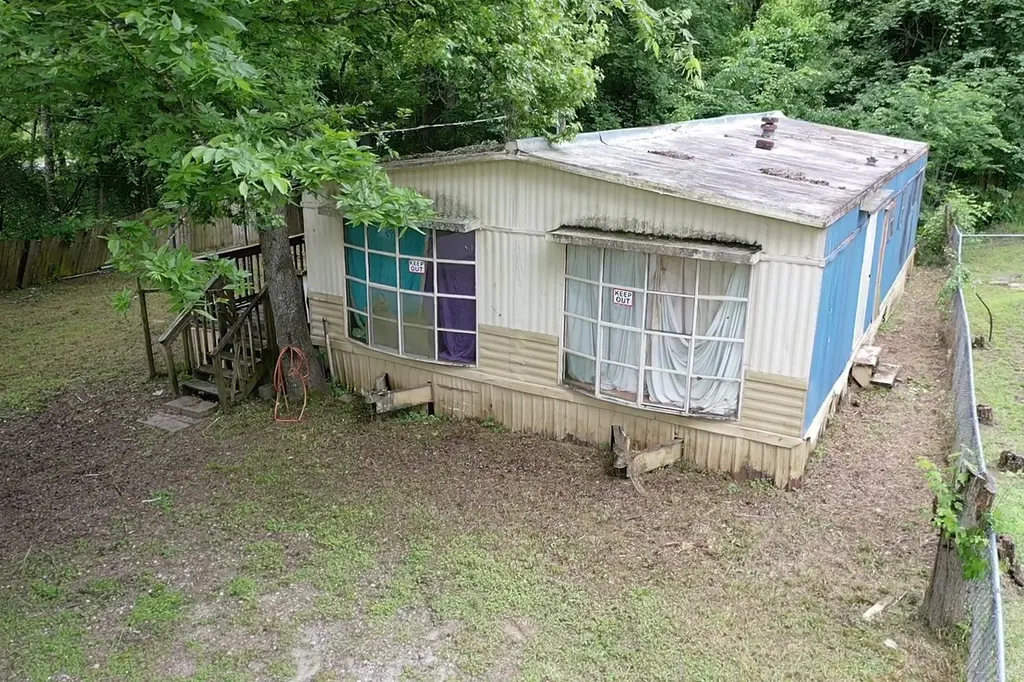
Welcome to Riverside Harbor where Your Perfect Fishing Retreat Awaits on Harmon Creek. Situated within this small fishing community, the 1152 SF Mobile Home offers 3 bedrooms and 2 full baths sitting on a little over 1/4-acre lot. Previously used as a rental unit, make this your new full-time residence, weekend retreat or investment property. This wooded, peaceful neighborhood features a small boat launch and fishing pier, a small community clubhouse and a pavilion for gatherings. Riverside Harbor is one of the communities surrounding Lake Livingston and the Trinity River featuring a community Park, Clubhouse, Playground, Marina Fishing Pier, and Boat Ramp. Conveniently located close to SHSU, schools, shopping, restaurants, State and Local Parks. Endless recreation opportunities around the second Largest Lake in Texas.
Key facts
- Fishing pier
- Small boat launch
- Community clubhouse
Tags
Property features AI
Finance
- Other: Seller disclosure available
- HOA & community: Riverside Harbor POA with $40 annual association fee
Exterior
- Utilities: Public water; Septic tank sewer
- Home design: Residential property; Single-story (all main rooms listed on first floor); Full ownership
- Construction: Aluminum siding exterior; Block foundation; Metal roof; Built in 1989
- Exterior features: Subdivision lot; Asphalt road access
Interior
- Kitchen: Kitchen (first floor)
- Bedrooms: Primary bedroom (first floor); Two additional bedrooms (first floor); All bedrooms on the first floor
- Bathrooms: 2 full bathrooms
- Heating & cooling: Central heating (electric); Central air conditioning (electric)
- Interior features: Living room; Dining room; Total of 6 rooms
Neighborhood map
What this means for you Summary
Snapshot
- This is a 3-bed/2.0-bath manufactured listed at $55k.
Deal economics
- At list price, monthly cash flow is $726 ($9k/yr) — positive.
- The deal already cash-flows at list — no discount required.
- Meets the 1% rule at list price ($2k rent vs $55k).
- Recommended offer: $53k (3.0% below list) — sets the bar for market timing.
- Cap rate 24.9% vs local median 4.4% in Riverside — top-decile yield for the area; either an underpriced asset or a hidden risk that comps aren't pricing in. Stress-test before assuming the spread holds.
Location & tenants
- Location reads 59/100 on livability (#1,150 in TX) — a working-class tenant base; expect higher turnover. Strengths: cost of living A+, housing A+; Watch: crime D-, amenities F, commute F.
- Huntsville ISD (town): math 25% / reading 37% proficiency, ranked #621 of 826 in TX (top 75%) — families likely to look elsewhere, expect single-tenant / working-renter base with shorter leases.
- Zoned schools: Huntsville El (math 27% / reading 27%, grade F, #2,791 of 4,322 statewide, top 68%, 603 students, 77% FRL); Mance Park Middle (math 26% / reading 25%, grade F, #1,236 of 1,662 statewide, top 76%, 904 students, 74% FRL); Huntsville H S (math 13% / reading 25%, grade F, #1,431 of 1,632 statewide, top 88%, 1,797 students, 68% FRL) — zoned schools average 73% FRL vs 42% district-wide (31 pts higher); higher-poverty schools than district average — tighter screening recommended.
- Market conditions: Rents rising (+2.9%/yr); 518 active listings in the ZIP; 527 units permitted in Walker County in 2024 (0 in 5+ unit buildings).
- This rent runs 33% of the median local income ($56k/yr) — at the standard rent-burdened threshold; future hikes will face affordability resistance.
Forward outlook
- Local home prices are declining (-3.0%/yr); year-one equity from $380 of loan paydown is wiped out by about $2k of value loss. Plan a longer hold.
- Walker County population projected at +29% by 2050 — long-run rental-demand tailwind backs the buy-and-hold thesis.
- At projected returns (-3.0% appreciation + 2.9% rent growth), your $15k cash investment doubles in ~3 years — after that, you're playing with house money.
Negotiation context
- It's been on market 57 days — a 3% lower offer ($53k) is reasonable based on typical stale-listing flexibility.
- 2 sale attempts with the ask held roughly flat each time — persistent listings suggest the price (not the market) is what's stuck; bring a comps-based counter.
Risks & watch-outs
- Watch-outs: flood insurance adds $125/mo.
- Climate carrying-cost: in FEMA flood zone A (mandatory federal flood insurance); severe wind risk, 93% chance of damaging wind over 30y; extreme-heat days projected 7→24/yr by 2055 (HVAC capex compounding) — expect insurance premiums to compound above CPI over the hold.
Questions for the listing agent
- It's been on market 57 days. Have you received any prior offers? Is the seller open to a 3% concession, seller financing, or rate buy-down credit?
- What's the actual annual flood-insurance premium (NFIP or private), and is the property in a SFHA with mandatory coverage?
- What does the HOA fee cover, when was the last increase, and are there any pending special assessments or reserve-fund shortfalls?
- Is there a deadline driving the sale (1031 exchange, divorce, estate, relocation)? That informs how much negotiation room exists.
- Schools are F-rated, which usually means shorter tenancies and higher turnover. Who's the typical renter profile here, and what's been the actual vacancy rate?
- Crime grade is D in this area — have there been break-ins, vandalism, or insurance claims at this property in the last 3 years? What carrier currently insures it and at what premium?
- What's the average days-on-market for RENTAL listings here right now (not sales)? A rising rental-DOM trend means longer vacancies and softer asking-rent achievability than the comps imply.
- What's the recent tenant-quality profile in this submarket — average credit score on applications, eviction rate, late-payment / NSF rate, and stable-employment percentage? A property-management company in the area should have these aggregated.
- How much new for-sale + rental construction is in the pipeline within 1–3 miles? Heavy new supply typically softens prices + rents 12–24 months out; constrained supply supports both.
Investment metrics
- 1% rule
- 2.77% ✓
- Cap rate
- 24.87%
- Cash-on-cash
- 66.36%
- DSCR
- 3.95
- GRM
- 3.0
CMA / ARV
- ARV (median comp)
- $44,022
- List price
- $55,000
- Delta
- 24.94%
- Verdict
- OVERPRICED
- Comps
- 1 within 2.0 mi
Projected returns pro-forma
-3.0% appreciation · 2.89% rent growth · sell at horizon
- IRR
- 54.9%
- Equity multiple
- 3.42×
- Total profit
- $37,269
- Equity at exit
- $8,201
- IRR
- 60.0%
- Equity multiple
- 6.95×
- Total profit
- $91,672
- Equity at exit
- $4,755
Cash invested: $15,400 (down + closing). Projections, not guarantees.
Landlord ↔ Tenant lean methodology
- Overall (STATE)
- 87 Strongly Landlord-Friendly
- State Texas
- 87 Strongly Landlord-Friendly · R+5
- County
- — inherits STATE
- City
- — inherits STATE
ZIP-level market 77320
- Home prices YoY
- -33.0%
- Rents YoY
- 2.9%
- Active inventory
- 518
- Price-to-rent
- 3.0×
Monthly cashflow live
- Estimated rent
- $1,521 medium interval (Pro) →
- Mortgage (P&I)
- −$288
- Tax from tax record
- −$36 /mo · $428/yr
- Insurance
- −$23
- Flood insurance flood zone
- −$125 /mo · $1,502/yr
- HOA
- −$3
- Vacancy / Maint / Mgmt
- −$319
- Net cashflow
- $726
Break-even live
UW: 25.0% down · 7.5% · 30yr · 1.5% tax · 5.0% vac · 8.0% maint · 8.0% mgmt
Financing live
Cash to close
- Down payment
- $13,750
- Closing costs
- $1,650
- Reserves months
- —
- Total cash needed
- —
Loan-product check · same deal, 3 products live
Conventional
25% down · 7.5% · 30yr
- Down + closing
- —
- Monthly P&I
- —
- Monthly cashflow
- —
- DSCR
- —
- Eligible?
- —
Personal DTI + credit; lowest rate.
DSCR
20% down · 8.5% · 30yr
- Down + closing
- —
- Monthly P&I
- —
- Monthly cashflow
- —
- DSCR
- —
- Eligible?
- —
No personal income docs; deal must DSCR.
Hard money
10% down · 12.0% · 12mo
- Down + closing
- —
- Monthly P&I
- —
- Monthly cashflow
- —
- DSCR
- —
- Eligible?
- —
Short-term bridge; refi at stabilization.
HOA detail
- Monthly dues
- $3 · $36/yr
Listing history 20 events
-
2026-06-19days on market $55,000 Active 57 DOM
-
2026-06-18days on market $55,000 Active 56 DOM
-
2026-06-17days on market $55,000 Active 55 DOM
-
2026-06-16days on market $55,000 Active 54 DOM
-
2026-06-15days on market $55,000 Active 53 DOM
-
2026-06-14days on market $55,000 Active 51 DOM
-
2026-06-13days on market $55,000 Active 50 DOM
-
2026-06-10days on market $55,000 Active 48 DOM
-
2026-06-09days on market $55,000 Active 47 DOM
-
2026-06-08days on market $55,000 Active 46 DOM
-
2026-06-07days on market $55,000 Active 45 DOM
-
2026-06-05days on market $55,000 Active 42 DOM
-
2026-06-03days on market $55,000 Active 41 DOM
-
2026-06-02days on market $55,000 Active 40 DOM
-
2026-06-01days on market $55,000 Active 39 DOM
-
2026-05-31days on market $55,000 Active 38 DOM
-
2026-05-30days on market $55,000 Active 37 DOM
-
2026-05-05$55,000 Active 830-char remark
Show marketing remark (830 chars)
Welcome to Riverside Harbor where Your Perfect Fishing Retreat Awaits on Harmon Creek. Situated within this small fishing community, the 1152 SF Mobile Home offers 3 bedrooms and 2 full baths sitting on a little over 1/4-acre lot. Previously used as a rental unit, make this your new full-time residence, weekend retreat or investment property. This wooded, peaceful neighborhood features a small boat launch and fishing pier, a small community clubhouse and a pavilion for gatherings. Riverside Harbor is one of the communities surrounding Lake Livingston and the Trinity River featuring a community Park, Clubhouse, Playground, Marina Fishing Pier, and Boat Ramp. Conveniently located close to SHSU, schools, shopping, restaurants, State and Local Parks. Endless recreation opportunities around the second Largest Lake in Texas.
-
2026-04-23$55,000 Active 834-char remark
-
2016-04-01soldstatus
ⓘ Source: listings_history table (triggers on properties + properties_extension) + one-shot
backfill from property_details.listing_events for pre-trigger history.
Tax reassessment forecast TX · Resets to sale price
- Current annual tax
- $428 · $36/mo
- Projected year-2 tax
- $1,006 · $84/mo
- Expected delta
- +$578/yr (+$48/mo · 135.0%)
ⓘ Screening estimate from a state-policy table — verify with the county assessor before closing.
Climate risk First Street
- Flood 5/10 Major FEMA zone A · 65% chance over 30 yrs
- Wildfire 4/10 Moderate
- Heat 8/10 Severe 7 d/yr ≥111°F today · 24 d/yr by 30 yrs out
- Wind 8/10 Severe 93% chance of damaging wind over 30 yrs
- Air quality 1/10 Low 0 unhealthy d/yr today · 0 by 30 yrs out
Nearby sold comps map
Loading sold comps map…
Walkable amenities ~0.75 mi
Loading nearby amenities…
Taxation est. · year 1
- Rental income
- $18,253
- − Mortgage interest
- −$3,081
- − Property taxes
- −$428
- − Insurance
- −$1,778
- − Repairs & maintenance
- −$1,460
- − Management
- −$1,460
- − HOA
- −$36
- − Depreciation
- −$1,600
- Taxable income
- $8,410
- Est. tax owed @ 24.0%
- −$2,018
- After-tax cash flow
- $6,699/yr
For passive investors: Depreciation is non-cash, so a rental often shows a tax loss while cash-flowing — sheltering income. Rental losses are passive: they offset passive income freely, and up to $25,000/yr can offset ordinary (W-2) income if you actively participate and your MAGI is under $100k (phasing out to $0 by $150k); unused losses carry forward. On sale, claimed depreciation is recaptured at up to 25%, and gains may owe capital-gains tax (a 1031 exchange can defer both). Figures are a year-1 estimate at your 24.0% rate — not tax advice; consult a CPA.
Schools (NCES district)
- District
- Huntsville ISD
- NCES district ID
- 4824030
- Math proficiency
- 25% ▼ -6.00%
- Reading proficiency
- 37% ▼ -2.00%
- Median HH income
- $36,597
- Composite
- 25.71/100
- National rank
- #7383
- State rank
- #621 of 826 in TX
Livability — Riverside
- Score
- 59/100
- State rank
- #1150
- US rank
- #20204
Category grades
Schools grade is shown separately in the Schools card above.
Census & demographics
- County
- Walker County · 75,669 people
- City population
- 634
- Metro
- Huntsville, TX
- Population (ZIP)
- 38,152
- Household income
- $55,663
- Rent vs Own
- Severe rent burden
- 1030.0
Population outlook (Walker County) Hauer SSP2
- Today (2025)
- 77,602 people
- By 2030
- 82,007 · +5.7%
- By 2040
- 90,436 · +16.5%
- By 2050
- 100,240 · +29.2%
- By 2075
- 123,667 · +59.4%
- By 2100
- 135,073 · +74.1%
Race, ethnicity, and origin ACS 2023
- Neighborhood character
- Diverse neighborhood (Simpson 0.64)
- Race & ethnicity
- White 50% Hispanic / Latino 26% Black 21% Two or more races 15%
- Hispanic origin (detail)
- Mexican 20%
- Common ancestry
- Lithuanian 2% Italian 2% Slovak 2%
- Foreign-born
- 9% · Canada, Vietnam
- Languages at home
- 79% English-only · Spanish 19%
Political lean MEDSL · Walker
- 2024 margin
- Solid R (+40.0) · D 29.6% · R 69.6%
- 2008→2024 swing
- -17.6pp toward R · 2008: -22.4pp · 2024: -40.0pp
- All cycles
- 2024: R+40.0 2020: R+31.7 2016: R+34.5 2012: R+28.4 2008: R+22.4
Not yet ingested
- Civics
- —
Market trends
- HPI YoY
- ▼ -93.48%
- Current HPI
- 190.199
- Rent YoY
- ▲ 2.89%
- Metro
- Huntsville, TX
- State GDP YoY
- ▲ 3.95%
- F500 in state
- 110
Industry mix (Fortune 500 HQ in TX)
| Industry | F500 HQs | Revenue |
|---|---|---|
| Energy | 16 | $1,198B |
|
||
| Technology | 5 | $198B |
|
||
| Engineering / Construction | 4 | $72B |
|
||
| Energy Services | 3 | $60B |
|
||
| Utilities | 3 | $41B |
|
||
| Healthcare | 2 | $330B |
|
||
Price history
+0.0% since first listed3 events — show timeline
- 2026-05-05 Listed $55,000 BCSRMLS
- 2026-04-23 Listed $55,000 HARMLS
- 2016-04-01 Sold (Public Records) — Public Records
Property tax history
+4.5%/yrLatest (2025): $428 · +9.3% YoY. Source: county tax records.
Cash-flow waterfall
monthlySold comps — $/sqft
last 12 mo · ≤1 miLoading sold comps…