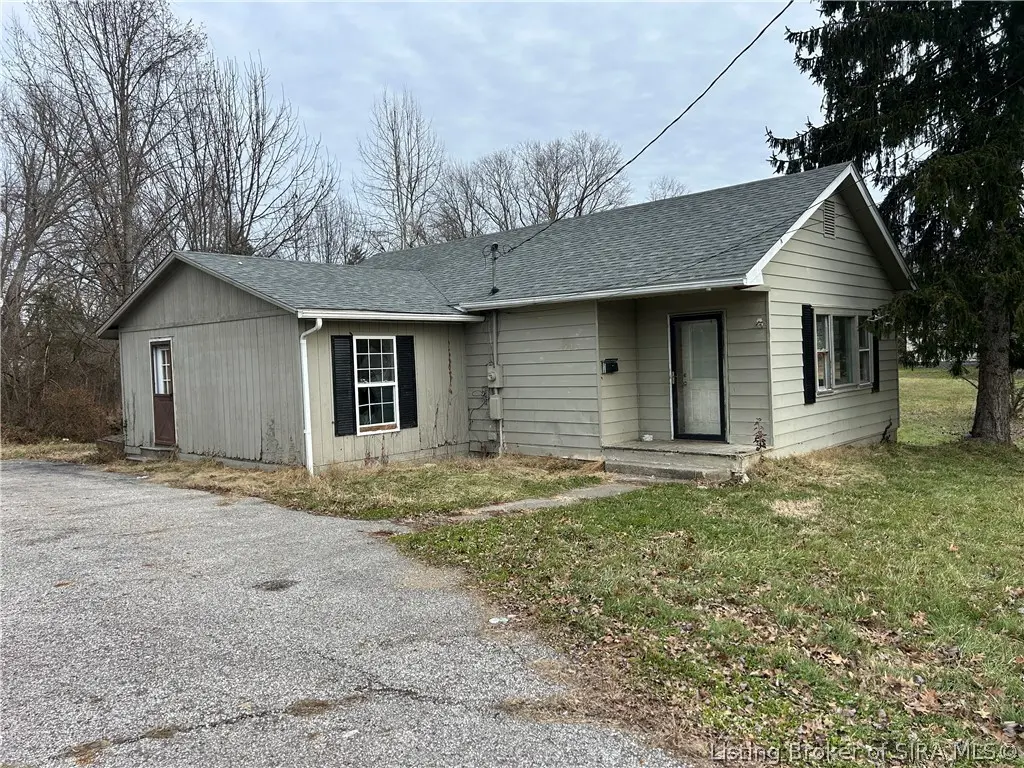
148 Morning Dr · Austin, IN
Flood risk 8/10 · Major
- FEMA flood zone
- X (unshaded)
- Chance of flooding over 30 yrs
- 0.99%
- Est. flood insurance / yr
- $507 – $1,088
Fire risk 1/10 · Minimal
- Est. fire insurance / yr
- $717 – $1,331
Heat risk 5/10 · Moderate
- Hot days now (above 104°F)
- 7 days/yr
- Hot days in 30 yrs
- 19 days/yr
Wind risk 2/10 · Minimal
- Chance of severe wind over 30 yrs
- 1.0%
Air-quality risk 2/10 · Minimal
- Unhealthy air days now
- 0 days/yr
- Unhealthy air days in 30 yrs
- 1 days/yr
Risk factors via First Street. Map © Google.
Why this score? — see what drove the B- grade
The composite is a weighted blend of 9 inputs, each scored 0–100. Each bar is that input's sub-score; the figure is the points it added to the 100-point composite (weight × sub-score).
- Cash flow +30.0/30.0
- DSCR +10.0/10.0
- 1% rule +9.3/10.0
- ARV discount +7.5/15.0
- Livability +3.0/5.0
- Rent growth +2.5/5.0
- Condition / age +2.5/5.0
- Schools +1.7/10.0
- Appreciation +0.0/10.0
$64,999
🖨 Deal sheet 📄 Offer letter ✓ Due diligence
Listing remarks
Home centrally located in Austin. Great location. Home in disrepair. Not livable. Sold As is. Side lot not included.
Key facts
- 7,405 sq ft lot
- Built 1940
- Listed 23 days
Property features AI
Finance
- Financial info: Annual tax amount reported
Exterior
- Utilities: Public water connected; Septic tank sewer
- Home design: Single-story home; 1,540 above-grade finished area
- Construction: Assessor-listed lot size of 0.17 acres; Property classified as residential
- Exterior features: Paved road access; Residential zoning
Interior
- Bathrooms: 1 full bathroom
- Interior features: Resale condition
Neighborhood map
What this means for you Summary
Snapshot
- This is a 2-bed/1.0-bath single-family listed at $65k.
Deal economics
- At list price, monthly cash flow is $210 ($3k/yr) — positive.
- The deal already cash-flows at list — no discount required.
- Meets the 1% rule at list price ($928 rent vs $65k).
- Recommended offer: $64k (1.5% below list) — sets the bar for market timing.
- Cap rate 11.4% vs local median 4.2% in Austin — top-decile yield for the area; either an underpriced asset or a hidden risk that comps aren't pricing in. Stress-test before assuming the spread holds.
Location & tenants
- Location reads 60/100 on livability (#523 in IN) — a middle-class / working-renter tenant base. Strengths: crime A+, cost of living A+; Watch: health & safety D, schools F, amenities F.
- Scott County School District 1 (town): math 16% / reading 26% proficiency, ranked #274 of 301 in IN (top 91%) — low school quality limits family demand, transient renter base, plan for 1-2y turnover; 63% free/reduced lunch — lower-income household profile, screen leases tightly.
- Market conditions: 54 active listings in the ZIP; 2 comparable units currently listed for rent nearby; 73 units permitted in Scott County in 2024 (0 in 5+ unit buildings).
Forward outlook
- Local home prices are declining (-3.0%/yr); year-one equity from $449 of loan paydown is wiped out by about $2k of value loss. Plan a longer hold.
- Scott County population projected at -23% by 2050 — secular population decline; favor cash flow + early exit over multi-decade hold.
- At projected returns (-3.0% appreciation + 3.0% rent growth), your $18k cash investment doubles in ~9 years — after that, you're playing with house money.
Negotiation context
- It's been on market 23 days — a 2% lower offer ($64k) is reasonable based on typical stale-listing flexibility.
Risks & watch-outs
- Watch-outs: flood insurance adds $66/mo; built in 1940 — expect roof / HVAC / electrical / plumbing capex.
- Climate carrying-cost: severe flood risk; extreme-heat days projected 7→19/yr by 2055 (HVAC capex compounding) — expect insurance premiums to compound above CPI over the hold.
Questions for the listing agent
- Built in 1940 — when were the roof, HVAC, electrical panel, plumbing, and water heater last replaced?
- What's the actual annual flood-insurance premium (NFIP or private), and is the property in a SFHA with mandatory coverage?
- Is there a deadline driving the sale (1031 exchange, divorce, estate, relocation)? That informs how much negotiation room exists.
- Schools are F-rated, which usually means shorter tenancies and higher turnover. Who's the typical renter profile here, and what's been the actual vacancy rate?
- What's the average days-on-market for RENTAL listings here right now (not sales)? A rising rental-DOM trend means longer vacancies and softer asking-rent achievability than the comps imply.
- What's the recent tenant-quality profile in this submarket — average credit score on applications, eviction rate, late-payment / NSF rate, and stable-employment percentage? A property-management company in the area should have these aggregated.
- How much new for-sale + rental construction is in the pipeline within 1–3 miles? Heavy new supply typically softens prices + rents 12–24 months out; constrained supply supports both.
Investment metrics
- 1% rule
- 1.43% ✓
- Cap rate
- 11.40%
- Cash-on-cash
- 18.22%
- DSCR
- 1.81
- GRM
- 5.8
CMA / ARV
- ARV (median comp)
- $176,141
- List price
- $64,999
- Delta
- -63.10%
- Verdict
- UNDERPRICED
- Comps
- 20 within 1.0 mi
Show comp detail 12 sales within ~0.75 mi
| Address | Dist | Beds/Ba | Sqft | Sold | Price | $/sf | Match |
|---|---|---|---|---|---|---|---|
| 255 Church St | 0.09mi | 3/2.0 (+1) | 1,483 (-4%) | 5mo | $167,000 | $113 | 76 |
| 232 E Main St | 0.15mi | 3/2.0 (+1) | 1,431 (-7%) | 4mo | $209,900 | $147 | 69 |
| 41 Rural St | 0.72mi | 2/1.0 | 1,608 (+4%) | 2mo | $130,000 | $81 | 57 |
| 92 W Stoneybrook Rd | 0.30mi | 3/2.0 (+1) | 1,347 (-12%) | 1mo | $269,000 | $200 | 55 |
| 377 S Second St | 0.65mi | 3/2.0 (+1) | 1,475 (-4%) | 2mo | $160,000 | $108 | 52 |
| 264 Audrey (lot 61) Ln | 0.26mi | 3/2.0 (+1) | 1,310 (-15%) | 6mo | $210,000 | $160 | 49 |
| 746 Goodin Dr | 0.36mi | 3/2.0 (+1) | 1,343 (-13%) | 5mo | $180,000 | $134 | 49 |
| 1154 Clay St | 0.67mi | 3/2.0 (+1) | 1,456 (-6%) | 4mo | $90,000 | $62 | 48 |
| 748 Goodin Dr | 0.38mi | 3/2.0 (+1) | 1,343 (-13%) | 6mo | $164,000 | $122 | 47 |
| 982 N Third St | 0.57mi | 3/2.0 (+1) | 1,340 (-13%) | 1mo | $184,900 | $138 | 42 |
| 161 S Fifth St | 0.61mi | 3/2.0 (+1) | 1,350 (-12%) | 1mo | $201,900 | $150 | 41 |
| 521 W Maple St | 0.54mi | 3/2.0 (+1) | 1,320 (-14%) | 4mo | $219,000 | $166 | 39 |
Match score weights: distance 35% · size 25% · config 20% · recency 20%. Top-matched comps best support the ARV.
Projected returns pro-forma
-3.0% appreciation · 3.0% rent growth · sell at horizon
- IRR
- 4.1%
- Equity multiple
- 1.16×
- Total profit
- $2,898
- Equity at exit
- $9,692
- IRR
- 13.7%
- Equity multiple
- 2.10×
- Total profit
- $19,983
- Equity at exit
- $5,620
Cash invested: $18,200 (down + closing). Projections, not guarantees.
Landlord ↔ Tenant lean methodology
- Overall (STATE)
- 90 Strongly Landlord-Friendly
- State Indiana
- 90 Strongly Landlord-Friendly · R+11
- County
- — inherits STATE
- City
- — inherits STATE
ZIP-level market 47102
- Home prices YoY
- -8.9%
- Active inventory
- 54
- Price-to-rent
- 5.8×
Monthly cashflow live
- Estimated rent
- $928 medium interval (Pro) →
- Mortgage (P&I)
- −$341
- Tax from tax record
- −$88 /mo · $1,061/yr
- Insurance
- −$27
- Flood insurance flood zone
- −$66 /mo · $798/yr
- HOA
- −$0
- Vacancy / Maint / Mgmt
- −$195
- Net cashflow
- $210
Break-even live
UW: 25.0% down · 7.5% · 30yr · 1.5% tax · 5.0% vac · 8.0% maint · 8.0% mgmt
Financing live
Cash to close
- Down payment
- $16,250
- Closing costs
- $1,950
- Reserves months
- —
- Total cash needed
- —
Loan-product check · same deal, 3 products live
Conventional
25% down · 7.5% · 30yr
- Down + closing
- —
- Monthly P&I
- —
- Monthly cashflow
- —
- DSCR
- —
- Eligible?
- —
Personal DTI + credit; lowest rate.
DSCR
20% down · 8.5% · 30yr
- Down + closing
- —
- Monthly P&I
- —
- Monthly cashflow
- —
- DSCR
- —
- Eligible?
- —
No personal income docs; deal must DSCR.
Hard money
10% down · 12.0% · 12mo
- Down + closing
- —
- Monthly P&I
- —
- Monthly cashflow
- —
- DSCR
- —
- Eligible?
- —
Short-term bridge; refi at stabilization.
Rent comps 2 comps
| Address | Beds | Baths | Sqft | Rent | $/sqft | DOM | Units | Dist |
|---|---|---|---|---|---|---|---|---|
| 20 Red Oak Way Austin, IN | 2.0 | 2.0 | 1080 | $929 | $0.86 | 43d | 1 | 0.33mi |
| 527 W Cherry St Austin, IN | 2.0 | 1.0 | 1080 | $925 | $0.86 | 43d | 1 | 0.61mi |
Listing history 19 events
-
2026-06-18days on market $64,999 Active 23 DOM
-
2026-06-17days on market $64,999 Active 22 DOM
-
2026-06-16days on market $64,999 Active 21 DOM
-
2026-06-15days on market $64,999 Active 20 DOM
-
2026-06-13days on market $64,999 Active 18 DOM
-
2026-06-12days on market $64,999 Active 17 DOM
-
2026-06-09days on market $64,999 Active 14 DOM
-
2026-06-08days on market $64,999 Active 13 DOM
-
2026-06-07days on market $64,999 Active 12 DOM
-
2026-06-05days on market $64,999 Active 10 DOM
-
2026-06-04days on market $64,999 Active 8 DOM
-
2026-06-02days on market $64,999 Active 7 DOM
-
2026-06-01days on market $64,999 Active 6 DOM
-
2026-05-31days on market $64,999 Active 5 DOM
-
2026-05-31days on market $64,999 Active 4 DOM
-
2026-05-11status Active 116-char remark
-
2026-04-21historical 116-char remark
-
2026-03-31$64,999 Active 116-char remark
-
2012-07-26soldstatus $62,000
ⓘ Source: listings_history table (triggers on properties + properties_extension) + one-shot
backfill from property_details.listing_events for pre-trigger history.
Tax reassessment forecast IN · Partial reset (capped growth)
- Current annual tax
- $1,061 · $88/mo
- Projected year-2 tax
- $1,061 · $88/mo
- Expected delta
- $0/yr ($0/mo · 0.0%)
ⓘ Screening estimate from a state-policy table — verify with the county assessor before closing.
Climate risk First Street
- Flood 8/10 Severe FEMA zone X (unshaded) · 99% chance over 30 yrs
- Wildfire 1/10 Low
- Heat 5/10 Major 7 d/yr ≥104°F today · 19 d/yr by 30 yrs out
- Wind 2/10 Low 100% chance of damaging wind over 30 yrs
- Air quality 2/10 Low 0 unhealthy d/yr today · 1 by 30 yrs out
Nearby sold comps map
Loading sold comps map…
Walkable amenities ~0.75 mi
Loading nearby amenities…
Taxation est. · year 1
- Rental income
- $11,131
- − Mortgage interest
- −$3,641
- − Property taxes
- −$1,061
- − Insurance
- −$1,122
- − Repairs & maintenance
- −$890
- − Management
- −$890
- − Depreciation
- −$1,891
- Taxable income
- $1,634
- Est. tax owed @ 24.0%
- −$392
- After-tax cash flow
- $2,127/yr
For passive investors: Depreciation is non-cash, so a rental often shows a tax loss while cash-flowing — sheltering income. Rental losses are passive: they offset passive income freely, and up to $25,000/yr can offset ordinary (W-2) income if you actively participate and your MAGI is under $100k (phasing out to $0 by $150k); unused losses carry forward. On sale, claimed depreciation is recaptured at up to 25%, and gains may owe capital-gains tax (a 1031 exchange can defer both). Figures are a year-1 estimate at your 24.0% rate — not tax advice; consult a CPA.
Schools (NCES district)
- District
- Scott County School District 1
- NCES district ID
- 1809990
- Math proficiency
- 16% ▼ -21.00%
- Reading proficiency
- 26% ▼ -10.00%
- Median HH income
- $36,972
- Composite
- 17.46/100
- National rank
- #9062
- State rank
- #274 of 301 in IN
Livability — Austin
- Score
- 60/100
- State rank
- #523
- US rank
- #18774
Category grades
Schools grade is shown separately in the Schools card above.
Census & demographics
- Census place
- Austin, IN
- City population
- 6,647
- Population (ZIP)
- 6,647
Population outlook (Scott County) Hauer SSP2
- Today (2025)
- 22,525 people
- By 2030
- 21,609 · -4.1%
- By 2040
- 19,536 · -13.3%
- By 2050
- 17,370 · -22.9%
- By 2075
- 12,862 · -42.9%
- By 2100
- 9,340 · -58.5%
Race, ethnicity, and origin ACS 2023
- Neighborhood character
- Predominantly White (96%)
- Race & ethnicity
- White 96% Hispanic / Latino 2% Two or more races 2%
- Common ancestry
- Slovak 2% Lithuanian 2% Italian 1%
- Foreign-born
- 1% · Canada
Political lean MEDSL · Scott
- 2024 margin
- Solid R (+51.5) · D 23.4% · R 74.9% · Other 1.6%
- 2008→2024 swing
- -49.5pp toward R · 2008: -2.0pp · 2024: -51.5pp
- All cycles
- 2024: R+51.5 2020: R+45.6 2016: R+37.9 2012: R+6.2 2008: R+2.0
Not yet ingested
- Civics
- —
Market trends
- HPI YoY
- ▼ -25.77%
- Current HPI
- 263.604
- Rent YoY
- —
- Metro
- —
- State GDP YoY
- ▲ 2.90%
- F500 in state
- 18
Industry mix (Fortune 500 HQ in IN)
| Industry | F500 HQs | Revenue |
|---|---|---|
| Industrial Machinery | 2 | $37B |
|
||
| Healthcare | 1 | $177B |
|
||
| Pharmaceuticals | 1 | $45B |
|
||
| Metals / Steel | 1 | $18B |
|
||
| Agriculture | 1 | $17B |
|
||
| Packaging | 1 | $12B |
|
||
Price history
+4.8% since first listed2 events — show timeline
- 2026-05-26 Listed $64,999 SIRA
- 2012-07-26 Sold (Public Records) $62,000 Public Records
Property tax history
+48.2%/yrLatest (2024): $1,061 · -8.8% YoY. Source: county tax records.
Cash-flow waterfall
monthlySold comps — $/sqft
last 12 mo · ≤1 miLoading sold comps…