 Duplex
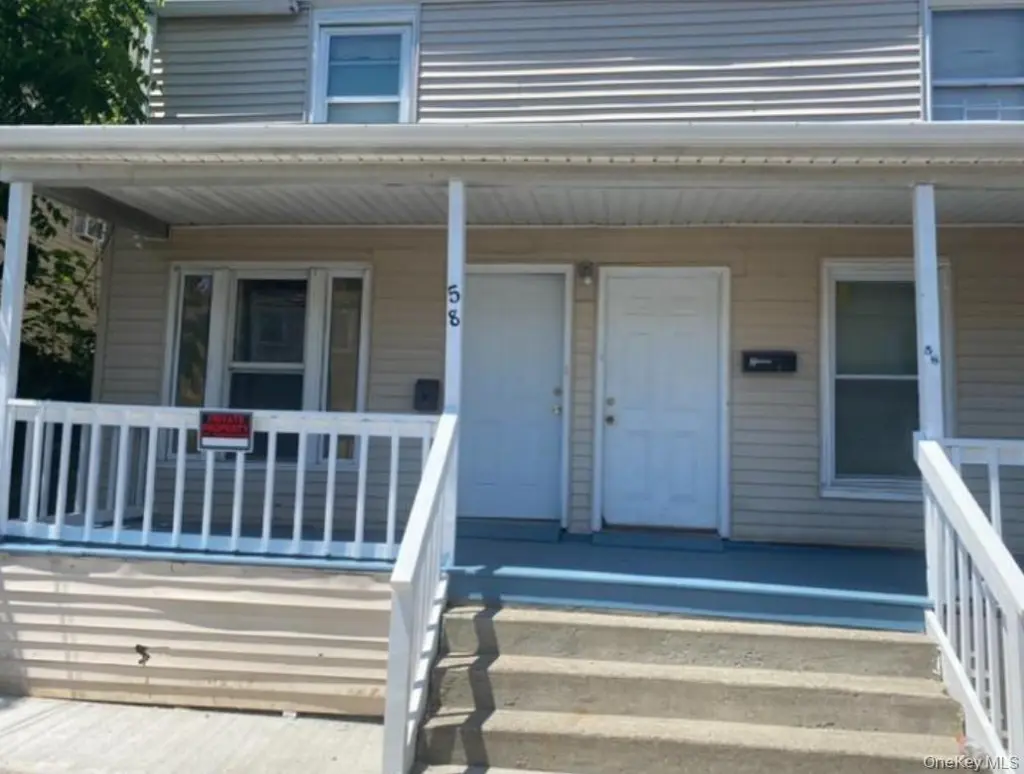
58 State St · Ossining, NY
Flood risk 1/10 · Minimal
- FEMA flood zone
- X (unshaded)
- Chance of flooding over 30 yrs
- 0.0%
- Est. flood insurance / yr
- $473 – $860
Fire risk 1/10 · Minimal
- Est. fire insurance / yr
- $691 – $1,283
Heat risk 6/10 · Moderate
- Hot days now (above 100°F)
- 7 days/yr
- Hot days in 30 yrs
- 16 days/yr
Wind risk 4/10 · Minor
- Chance of severe wind over 30 yrs
- 23.0%
Air-quality risk 3/10 · Minor
- Unhealthy air days now
- 3 days/yr
- Unhealthy air days in 30 yrs
- 4 days/yr
Risk factors via First Street. Map © Google.
Why this score? — see what drove the B+ grade
The composite is a weighted blend of 9 inputs, each scored 0–100. Each bar is that input's sub-score; the figure is the points it added to the 100-point composite (weight × sub-score).
- Cash flow +28.2/30.0
- ARV discount +15.0/15.0
- DSCR +10.0/10.0
- 1% rule +8.4/10.0
- Schools +6.4/10.0
- Livability +4.0/5.0
- Rent growth +2.5/5.0
- Condition / age +2.5/5.0
- Appreciation +0.0/10.0
$600,000
🖨 Deal sheet 📄 Offer letter ✓ Due diligence
Multi-family units
County records classify this as Multi-Family (2-4 Unit). Listing-text estimate: 2 units. confirmed
Listing remarks MLS
Income-producing duplex in a desirable location! Has 5 bedrooms and two baths total. 3 bedrooms 1 bath in one unit, 2 bedrooms 1 bath in second unit. This well-maintained property offers two units with strong rental history and consistent cash flow. Ideal for investors or owner-occupants looking to offset their mortgage. Features include separate utilities, spacious layouts, and convenient access to transportation, shopping, and major highways. A rare opportunity to own a turnkey investment in a growing market.
Key facts
- Separate utilities
- Spacious layouts
- Turnkey investment
Tags
Neighborhood map
What this means for you Summary
Snapshot
- This is a 2 × 3-bed/1.0-bath units multifamily listed at $600k.
Deal economics
- At list price, monthly cash flow is $2k ($23k/yr) — positive. Per door: $949/mo.
- The deal already cash-flows at list — no discount required.
- Meets the 1% rule at list price ($8k rent vs $600k).
- Recommended offer: $564k (6.0% below list) — sets the bar for market timing.
- Cap rate 10.1% vs local median 2.9% in Ossining — top-decile yield for the area; either an underpriced asset or a hidden risk that comps aren't pricing in. Stress-test before assuming the spread holds.
Location & tenants
- Location reads 80/100 on livability (#116 in NY, #1,876 nationally) — a professional / high-income tenant draw. Strengths: commute A+, employment A+, health & safety A; Watch: schools D+, cost of living F.
- Ossining Union Free School District (suburban): math 72% / reading 72% proficiency, ranked #104 of 590 in NY (top 18%) — strong family-tenant draw, lease renewals of 3-5y typical.
- Market conditions: 134 active listings in the ZIP; 1 comparable units currently listed for rent nearby; high-income renter base; 954 units permitted in Westchester County in 2024 (649 in 5+ unit buildings).
- At $8,064/mo this rent would consume 84% of the median local household income ($116k/yr) (locally 1248% of renters already pay >50% of income on rent) — very limited rent-growth headroom before tenants either downsize or default.
Forward outlook
- Local home prices are declining (-3.0%/yr); year-one equity from $4k of loan paydown is wiped out by about $18k of value loss. Plan a longer hold.
- Westchester County population projected at +10% by 2050 — modest demand growth; plan on rents tracking national, not racing it.
- At projected returns (-3.0% appreciation + 3.0% rent growth), your $168k cash investment doubles in ~9 years — after that, you're playing with house money.
Negotiation context
- It's been on market 64 days — a 6% lower offer ($564k) is reasonable based on typical stale-listing flexibility.
- 3 sale attempts since 21y ago with the ask held roughly flat each time — persistent listings suggest the price (not the market) is what's stuck; bring a comps-based counter.
- Current owner paid $286k; list at $600k implies a 110% gain — meaningful room to come down on a strong offer.
Risks & watch-outs
- Watch-outs: built in 1925 — expect roof / HVAC / electrical / plumbing capex.
- Climate carrying-cost: extreme-heat days projected 7→16/yr by 2055 (HVAC capex compounding) — expect insurance premiums to compound above CPI over the hold.
Questions for the listing agent
- It's been on market 64 days. Have you received any prior offers? Is the seller open to a 6% concession, seller financing, or rate buy-down credit?
- Can we see the unit-by-unit rent roll, current vacancy, and any below-market leases? What's the average tenancy length?
- What capital expenditures (roof, boiler, parking lot, exteriors) have been made in the last 5 years, and what's planned in the next 2?
- Built in 1925 — when were the roof, HVAC, electrical panel, plumbing, and water heater last replaced?
- Why hasn't it sold? Are there any deal-killer items the seller is aware of (foundation, flood, title, zoning, code violations)?
- Is there a deadline driving the sale (1031 exchange, divorce, estate, relocation)? That informs how much negotiation room exists.
- Schools are D-rated, which usually means shorter tenancies and higher turnover. Who's the typical renter profile here, and what's been the actual vacancy rate?
- What's the average days-on-market for RENTAL listings here right now (not sales)? A rising rental-DOM trend means longer vacancies and softer asking-rent achievability than the comps imply.
- What's the recent tenant-quality profile in this submarket — average credit score on applications, eviction rate, late-payment / NSF rate, and stable-employment percentage? A property-management company in the area should have these aggregated.
- How much new apartment / multifamily construction is in the pipeline within 1–3 miles? Heavy new supply (>2% of stock underway) typically softens rents 12–24 months out; light construction supports rent growth.
Investment metrics
- 1% rule
- 1.34% ✓
- Cap rate
- 10.09%
- Cash-on-cash
- 13.56%
- DSCR
- 1.60
- GRM
- 6.2
CMA / ARV
- ARV (median comp)
- $1,009,733
- List price
- $600,000
- Delta
- -40.58%
- Verdict
- UNDERPRICED
- Comps
- 20 within 1.0 mi
Show comp detail 3 sales within ~0.75 mi
| Address | Dist | Beds/Ba | Sqft | Sold | Price | $/sf | Match |
|---|---|---|---|---|---|---|---|
| 4 Everett Ave | 0.20mi | 4/2.0 (-1) | 1,432 (-1%) | 20mo | $455,000 | $318 | 68 |
| 132 S Highland Ave | 0.45mi | 4/3.0 (-1) | 1,236 (-14%) | 12mo | $631,000 | $511 | 36 |
| 30 Yale Ave | 0.73mi | 4/2.0 (-1) | 1,532 (+6%) | 22mo | $520,000 | $339 | 32 |
Match score weights: distance 35% · size 25% · config 20% · recency 20%. Top-matched comps best support the ARV.
Projected returns pro-forma
-3.0% appreciation · 3.0% rent growth · sell at horizon
- IRR
- 3.7%
- Equity multiple
- 1.14×
- Total profit
- $23,991
- Equity at exit
- $89,462
- IRR
- 13.3%
- Equity multiple
- 2.06×
- Total profit
- $177,871
- Equity at exit
- $51,877
Cash invested: $168,000 (down + closing). Projections, not guarantees.
Landlord ↔ Tenant lean methodology
- Overall (STATE)
- 15 Strongly Tenant-Friendly
- State New York
- 15 Strongly Tenant-Friendly · D+10
- County
- — inherits STATE
- City
- — inherits STATE
ZIP-level market 10562
- Active inventory
- 134
- Price-to-rent
- 12.4×
Monthly cashflow live
- Estimated rent
- $8,064 medium interval (Pro) →
- Mortgage (P&I)
- −$3,146
- Tax from tax record
- −$1,076 /mo · $12,911/yr
- Insurance
- −$250
- HOA
- −$0
- Vacancy / Maint / Mgmt
- −$1,693
- Net cashflow
- $1,898
Break-even live
2-unit breakdown (identical units grouped — click to expand)
| Units | Beds | Baths | Est. rent |
|---|---|---|---|
| 2× units | 3 | 1 | $8,064 |
| #1 | 3 | 1 | $4,032 |
| #2 | 3 | 1 | $4,032 |
| Total (2 units) | $8,064 | ||
UW: 25.0% down · 7.5% · 30yr · 1.5% tax · 5.0% vac · 8.0% maint · 8.0% mgmt
Financing live
Cash to close
- Down payment
- $150,000
- Closing costs
- $18,000
- Reserves months
- —
- Total cash needed
- —
Loan-product check · same deal, 3 products live
Conventional
25% down · 7.5% · 30yr
- Down + closing
- —
- Monthly P&I
- —
- Monthly cashflow
- —
- DSCR
- —
- Eligible?
- —
Personal DTI + credit; lowest rate.
DSCR
20% down · 8.5% · 30yr
- Down + closing
- —
- Monthly P&I
- —
- Monthly cashflow
- —
- DSCR
- —
- Eligible?
- —
No personal income docs; deal must DSCR.
Hard money
10% down · 12.0% · 12mo
- Down + closing
- —
- Monthly P&I
- —
- Monthly cashflow
- —
- DSCR
- —
- Eligible?
- —
Short-term bridge; refi at stabilization.
Rent comps 1 comps
| Address | Beds | Baths | Sqft | Rent | $/sqft | DOM | Units | Dist |
|---|---|---|---|---|---|---|---|---|
| 51 Iroquois Rd Ossining, NY | 4.0 | 2.0 | 1703 | $4,950 | $2.91 | 24d | 1 | 1.42mi |
Listing history 25 events
-
2026-06-18days on market $600,000 Active 64 DOM
-
2026-06-17days on market $600,000 Active 63 DOM
-
2026-06-16days on market $600,000 Active 62 DOM
-
2026-06-15days on market $600,000 Active 61 DOM
-
2026-06-13days on market $600,000 Active 59 DOM
-
2026-06-09days on market $600,000 Active 55 DOM
-
2026-06-08days on market $600,000 Active 54 DOM
-
2026-06-07days on market $600,000 Active 53 DOM
-
2026-06-04days on market $600,000 Active 50 DOM
-
2026-06-03days on market $600,000 Active 49 DOM
-
2026-06-02days on market $600,000 Active 48 DOM
-
2026-06-01days on market $600,000 Active 47 DOM
-
2026-05-31days on market $600,000 Active 46 DOM
-
2026-04-30price $600,000 516-char remark
Show marketing remark (516 chars)
Income-producing duplex in a desirable location! Has 5 bedrooms and two baths total. 3 bedrooms 1 bath in one unit, 2 bedrooms 1 bath in second unit. This well-maintained property offers two units with strong rental history and consistent cash flow. Ideal for investors or owner-occupants looking to offset their mortgage. Features include separate utilities, spacious layouts, and convenient access to transportation, shopping, and major highways. A rare opportunity to own a turnkey investment in a growing market.
-
2026-04-30status Active 516-char remark
Show marketing remark (516 chars)
Income-producing duplex in a desirable location! Has 5 bedrooms and two baths total. 3 bedrooms 1 bath in one unit, 2 bedrooms 1 bath in second unit. This well-maintained property offers two units with strong rental history and consistent cash flow. Ideal for investors or owner-occupants looking to offset their mortgage. Features include separate utilities, spacious layouts, and convenient access to transportation, shopping, and major highways. A rare opportunity to own a turnkey investment in a growing market.
-
2026-04-15status Pending 516-char remark
Show marketing remark (516 chars)
Income-producing duplex in a desirable location! Has 5 bedrooms and two baths total. 3 bedrooms 1 bath in one unit, 2 bedrooms 1 bath in second unit. This well-maintained property offers two units with strong rental history and consistent cash flow. Ideal for investors or owner-occupants looking to offset their mortgage. Features include separate utilities, spacious layouts, and convenient access to transportation, shopping, and major highways. A rare opportunity to own a turnkey investment in a growing market.
-
2026-03-30$585,000 Active 516-char remark
Show marketing remark (516 chars)
Income-producing duplex in a desirable location! Has 5 bedrooms and two baths total. 3 bedrooms 1 bath in one unit, 2 bedrooms 1 bath in second unit. This well-maintained property offers two units with strong rental history and consistent cash flow. Ideal for investors or owner-occupants looking to offset their mortgage. Features include separate utilities, spacious layouts, and convenient access to transportation, shopping, and major highways. A rare opportunity to own a turnkey investment in a growing market.
-
2006-06-16soldstatus $286,200
-
2006-06-16soldstatus $286,200
-
2006-03-03soldstatus $270,000 180-char remark
Show marketing remark (180 chars)
House Being Sold as, Is. Handyman Special. Tenants Must Be Home To Show. Advance Notice Appreciated. Taxes Do Not Include Star. Taxes & Sq. Ft. Per Tax Office, Please Verify.
-
2006-02-17price $319,000 180-char remark
Show marketing remark (180 chars)
House Being Sold as, Is. Handyman Special. Tenants Must Be Home To Show. Advance Notice Appreciated. Taxes Do Not Include Star. Taxes & Sq. Ft. Per Tax Office, Please Verify.
-
2006-02-17historical 180-char remark
Show marketing remark (180 chars)
House Being Sold as, Is. Handyman Special. Tenants Must Be Home To Show. Advance Notice Appreciated. Taxes Do Not Include Star. Taxes & Sq. Ft. Per Tax Office, Please Verify.
-
2005-11-22$270,000 180-char remark
Show marketing remark (180 chars)
House Being Sold as, Is. Handyman Special. Tenants Must Be Home To Show. Advance Notice Appreciated. Taxes Do Not Include Star. Taxes & Sq. Ft. Per Tax Office, Please Verify.
-
2001-03-07soldstatus $190,000
-
1995-10-31soldstatus $65,000
ⓘ Source: listings_history table (triggers on properties + properties_extension) + one-shot
backfill from property_details.listing_events for pre-trigger history.
Tax reassessment forecast NY · Partial reset (capped growth)
- Current annual tax
- $12,911 · $1,076/mo
- Projected year-2 tax
- $12,911 · $1,076/mo
- Expected delta
- $0/yr ($0/mo · 0.0%)
ⓘ Screening estimate from a state-policy table — verify with the county assessor before closing.
Climate risk First Street
- Flood 1/10 Low FEMA zone X (unshaded) · 0% chance over 30 yrs
- Wildfire 1/10 Low
- Heat 6/10 Major 7 d/yr ≥100°F today · 16 d/yr by 30 yrs out
- Wind 4/10 Moderate 23% chance of damaging wind over 30 yrs
- Air quality 3/10 Moderate 3 unhealthy d/yr today · 4 by 30 yrs out
Nearby sold comps map
Loading sold comps map…
Walkable amenities ~0.75 mi
Loading nearby amenities…
Taxation est. · year 1
- Rental income
- $96,768
- − Mortgage interest
- −$33,609
- − Property taxes
- −$12,911
- − Insurance
- −$3,000
- − Repairs & maintenance
- −$7,741
- − Management
- −$7,741
- − Depreciation
- −$17,455
- Taxable income
- $14,310
- Est. tax owed @ 24.0%
- −$3,434
- After-tax cash flow
- $19,344/yr
For passive investors: Depreciation is non-cash, so a rental often shows a tax loss while cash-flowing — sheltering income. Rental losses are passive: they offset passive income freely, and up to $25,000/yr can offset ordinary (W-2) income if you actively participate and your MAGI is under $100k (phasing out to $0 by $150k); unused losses carry forward. On sale, claimed depreciation is recaptured at up to 25%, and gains may owe capital-gains tax (a 1031 exchange can defer both). Figures are a year-1 estimate at your 24.0% rate — not tax advice; consult a CPA.
Schools (NCES district)
- District
- Ossining Union Free School District
- NCES district ID
- 3622020
- Math proficiency
- 72% ▲ 27.00%
- Reading proficiency
- 72% ▲ 25.00%
- Median HH income
- $78,402
- Composite
- 63.75/100
- National rank
- #599
- State rank
- #104 of 590 in NY
Livability — Ossining
- Score
- 80/100
- State rank
- #116
- US rank
- #1876
Category grades
Schools grade is shown separately in the Schools card above.
Census & demographics
- Census place
- Ossining, NY
- County
- Westchester County · 709,332 people
- City population
- 33,793
- Metro
- New York-Newark-Jersey City, NY-NJ-PA
- Population (ZIP)
- 33,793
- Household income
- $115,697
- Rent vs Own
- Severe rent burden
- 1248.0
Population outlook (Westchester County) Hauer SSP2
- Today (2025)
- 1,028,035 people
- By 2030
- 1,051,636 · +2.3%
- By 2040
- 1,098,520 · +6.9%
- By 2050
- 1,136,044 · +10.5%
- By 2075
- 1,196,925 · +16.4%
- By 2100
- 1,175,147 · +14.3%
Race, ethnicity, and origin ACS 2023
- Neighborhood character
- Diverse neighborhood (Simpson 0.63)
- Race & ethnicity
- White 47% Hispanic / Latino 37% Two or more races 11% Black 8% Asian 4%
- Hispanic origin (detail)
- Puerto Rican 6% Cuban 2% Dominican 3%
- Common ancestry
- Romanian 3% Scotch-Irish 3% Italian 2%
- Foreign-born
- 28% · Canada, Jamaica, China
- Languages at home
- 59% English-only · Spanish 31% Other Indo-European 4% Russian/Polish/Slavic 1%
Political lean MEDSL · Westchester
- 2024 margin
- Strong D (+26.3) · D 63.1% · R 36.9%
- 2008→2024 swing
- -1.3pp toward R · 2008: 27.6pp · 2024: 26.3pp
- All cycles
- 2024: D+26.3 2020: D+36.3 2016: D+32.8 2012: D+22.2 2008: D+27.6
Not yet ingested
- Civics
- —
Market trends
- HPI YoY
- ▼ -605.12%
- Current HPI
- 251.6831
- Rent YoY
- —
- Metro
- New York-Newark-Jersey City, NY-NJ-PA
- State GDP YoY
- ▲ 2.60%
- F500 in state
- 92
Industry mix (Fortune 500 HQ in NY)
| Industry | F500 HQs | Revenue |
|---|---|---|
| Financial Services | 10 | $950B |
|
||
| Consumer Goods | 9 | $162B |
|
||
| Insurance | 4 | $225B |
|
||
| Telecommunications | 2 | $144B |
|
||
| Pharmaceuticals | 2 | $112B |
|
||
| Media / Entertainment | 2 | $69B |
|
||
Price history
+823.1% since first listed12 events — show timeline
- 2026-04-30 Price Changed $600,000 OneKey® MLS as Distributed by MLS Grid
- 2026-04-30 Relisted — OneKey® MLS as Distributed by MLS Grid
- 2026-04-15 Pending — OneKey® MLS as Distributed by MLS Grid
- 2026-03-30 Listed $585,000 OneKey® MLS as Distributed by MLS Grid
- 2006-06-16 Sold (Public Records) $286,200 Public Records
- 2006-06-16 Sold (Public Records) $286,200 Public Records
- 2006-03-03 Sold (MLS) $270,000 HGMLS
- 2006-02-17 Delisted — HGMLS
- 2006-02-17 Price Changed $319,000 HGMLS
- 2005-11-22 Listed $270,000 HGMLS
- 2001-03-07 Sold (Public Records) $190,000 Public Records
- 1995-10-31 Sold (Public Records) $65,000 Public Records
Property tax history
+4.3%/yrLatest (2025): $12,911 · +3.4% YoY. Source: county tax records.
Cash-flow waterfall
monthlySold comps — $/sqft
last 12 mo · ≤1 miLoading sold comps…