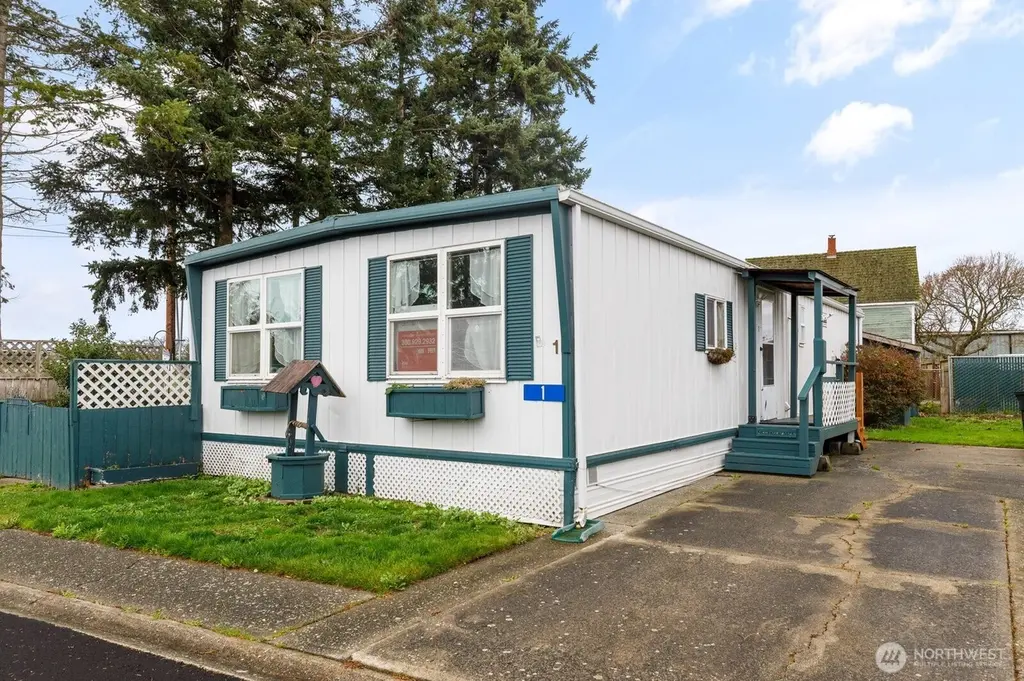
701 S Main St #1 · Coupeville, WA
Flood risk 1/10 · Minimal
- FEMA flood zone
- X (unshaded)
- Chance of flooding over 30 yrs
- 0.0%
- Est. flood insurance / yr
- $507 – $1,088
Fire risk 4/10 · Minor
- Est. fire insurance / yr
- $604 – $1,122
Heat risk 2/10 · Minimal
- Hot days now (above 80°F)
- 7 days/yr
- Hot days in 30 yrs
- 18 days/yr
Wind risk 1/10 · Minimal
- Chance of severe wind over 30 yrs
- —
Air-quality risk 6/10 · Moderate
- Unhealthy air days now
- 7 days/yr
- Unhealthy air days in 30 yrs
- 8 days/yr
Risk factors via First Street. Map © Google.
Why this score? — see what drove the B grade
The composite is a weighted blend of 9 inputs, each scored 0–100. Each bar is that input's sub-score; the figure is the points it added to the 100-point composite (weight × sub-score).
- Cash flow +30.0/30.0
- 1% rule +10.0/10.0
- DSCR +10.0/10.0
- ARV discount +7.5/15.0
- Schools +5.6/10.0
- Livability +4.0/5.0
- Rent growth +2.5/5.0
- Condition / age +2.5/5.0
- Appreciation +0.0/10.0
$67,000
🖨 Deal sheet 📄 Offer letter ✓ Due diligence
Listing remarks
Low-maintenance living meets comfort in this delightful 2-bed, 1.75-bath home in a 55+ park. The private primary suite and open layout provide ease and privacy. Entertain or unwind in the fully-fenced yard w/ shady patio. Enjoy the covered porch area and extra storage in 2 sheds. Raised garden beds ready for whatever you want to grow. Off-street parking and a prime location near parks and shopping. It's ready for you to add your personal touches.
Key facts
- Extra storage
- Fully-fenced yard
- Covered porch area
Tags
Neighborhood map
What this means for you Summary
Snapshot
- This is a 2-bed/2.0-bath manufactured listed at $67k.
Deal economics
- At list price, monthly cash flow is $987 ($12k/yr) — positive.
- The deal already cash-flows at list — no discount required.
- Meets the 1% rule at list price ($2k rent vs $67k).
- Recommended offer: $59k (12.0% below list) — sets the bar for market timing.
- Cap rate 24.0% vs local median 1.8% in Coupeville — top-decile yield for the area; either an underpriced asset or a hidden risk that comps aren't pricing in. Stress-test before assuming the spread holds.
Location & tenants
- Location reads 79/100 on livability (#107 in WA, #2,126 nationally) — a middle-class / working-renter tenant base. Strengths: crime A+, health & safety A+, schools A; Watch: commute F, cost of living D-.
- Coupeville School District (rural): math 54% / reading 73% proficiency, ranked #40 of 291 in WA (top 14%) — acceptable for families but not a draw, mixed tenant base, ~2y average lease.
- Market conditions: 138 active listings in the ZIP; 4 comparable units currently listed for rent nearby; rentals lingering (median 44d on market — plan ~5-8 weeks vacancy on turnover, expect pricing pressure); 50% of comp listings sitting > 30 days — soft ceiling on asking rent; solid renter incomes; 402 units permitted in Island County in 2024 (54 in 5+ unit buildings).
Forward outlook
- Local home prices are declining (-3.0%/yr); year-one equity from $463 of loan paydown is wiped out by about $2k of value loss. Plan a longer hold.
- Island County population projected to shrink 6% by 2050 — rents likely to lag national; underwrite the cash flow, not the appreciation.
- At projected returns (-3.0% appreciation + 3.0% rent growth), your $19k cash investment doubles in ~2 years — after that, you're playing with house money.
Negotiation context
- It's been on market 343 days — a 12% lower offer ($59k) is reasonable based on typical stale-listing flexibility.
- 7 sale attempts since 24y ago; this cycle's ask has dropped $13k (16%) from the opening price — seller is motivated, your offer sets the floor, not the list.
- Current owner paid $11k; list at $67k implies a 509% gain — meaningful room to come down on a strong offer.
Questions for the listing agent
- It's been on market 343 days. Have you received any prior offers? Is the seller open to a 12% concession, seller financing, or rate buy-down credit?
- Built in 1969 — when were the roof, HVAC, electrical panel, plumbing, and water heater last replaced?
- Why hasn't it sold? Are there any deal-killer items the seller is aware of (foundation, flood, title, zoning, code violations)?
- Is there a deadline driving the sale (1031 exchange, divorce, estate, relocation)? That informs how much negotiation room exists.
- Schools are A-rated — typically a magnet for longer-tenancy family renters. What's the average tenant stay here, and is there a school-zone premium baked into asking?
- What's the average days-on-market for RENTAL listings here right now (not sales)? A rising rental-DOM trend means longer vacancies and softer asking-rent achievability than the comps imply.
- What's the recent tenant-quality profile in this submarket — average credit score on applications, eviction rate, late-payment / NSF rate, and stable-employment percentage? A property-management company in the area should have these aggregated.
- How much new for-sale + rental construction is in the pipeline within 1–3 miles? Heavy new supply typically softens prices + rents 12–24 months out; constrained supply supports both.
Investment metrics
- 1% rule
- 2.63% ✓
- Cap rate
- 23.98%
- Cash-on-cash
- 63.16%
- DSCR
- 3.81
- GRM
- 3.2
CMA / ARV
- ARV (median comp)
- $150,611
- List price
- $67,000
- Delta
- -55.51%
- Verdict
- UNDERPRICED
- Comps
- 1 within 2.0 mi
Projected returns pro-forma
-3.0% appreciation · 3.0% rent growth · sell at horizon
- IRR
- 62.2%
- Equity multiple
- 3.77×
- Total profit
- $52,023
- Equity at exit
- $9,990
- IRR
- 66.7%
- Equity multiple
- 7.73×
- Total profit
- $126,243
- Equity at exit
- $5,793
Cash invested: $18,760 (down + closing). Projections, not guarantees.
Landlord ↔ Tenant lean methodology
- Overall (STATE)
- 28 Tenant-Leaning
- State Washington
- 28 Tenant-Leaning · D+8
- County
- — inherits STATE
- City
- — inherits STATE
ZIP-level market 98239
- Active inventory
- 138
- Price-to-rent
- 3.2×
Monthly cashflow live
- Estimated rent
- $1,762 medium interval (Pro) →
- Mortgage (P&I)
- −$351
- Tax from tax record
- −$25 /mo · $301/yr
- Insurance
- −$28
- HOA
- −$0
- Vacancy / Maint / Mgmt
- −$370
- Net cashflow
- $987
Break-even live
UW: 25.0% down · 7.5% · 30yr · 1.5% tax · 5.0% vac · 8.0% maint · 8.0% mgmt
Financing live
Cash to close
- Down payment
- $16,750
- Closing costs
- $2,010
- Reserves months
- —
- Total cash needed
- —
Loan-product check · same deal, 3 products live
Conventional
25% down · 7.5% · 30yr
- Down + closing
- —
- Monthly P&I
- —
- Monthly cashflow
- —
- DSCR
- —
- Eligible?
- —
Personal DTI + credit; lowest rate.
DSCR
20% down · 8.5% · 30yr
- Down + closing
- —
- Monthly P&I
- —
- Monthly cashflow
- —
- DSCR
- —
- Eligible?
- —
No personal income docs; deal must DSCR.
Hard money
10% down · 12.0% · 12mo
- Down + closing
- —
- Monthly P&I
- —
- Monthly cashflow
- —
- DSCR
- —
- Eligible?
- —
Short-term bridge; refi at stabilization.
Rent comps 4 comps
| Address | Beds | Baths | Sqft | Rent | $/sqft | DOM | Units | Dist |
|---|---|---|---|---|---|---|---|---|
| 106 S Main St Coupeville, WA | 2.0 | 1.0 | 775 | $1,615 | $2.08 | 3d | 1 | 0.44mi |
| 304 N Main St Apt 09 Coupeville, WA | 2.0 | 1.0 | 850 | $1,550 | $1.82 | 43d | 1 | 0.74mi |
| 304 N Main St Apt 21 Coupeville, WA | 1.0 | 1.0 | 650 | $1,440 | $2.22 | 43d | 1 | 0.74mi |
| 304 N Main St Apt 02 Coupeville, WA | 1.0 | 1.0 | 650 | $1,465 | $2.25 | 23d | 1 | 0.76mi |
Listing history 37 events
-
2026-06-19days on market $67,000 Active 343 DOM
-
2026-06-18days on market $67,000 Active 342 DOM
-
2026-06-17days on market $67,000 Active 341 DOM
-
2026-06-16days on market $67,000 Active 340 DOM
-
2026-06-15days on market $67,000 Active 339 DOM
-
2026-06-14days on market $67,000 Active 337 DOM
-
2026-06-13pricedays on market $67,000 Active 336 DOM
-
2026-06-10days on market $69,800 Active 334 DOM
-
2026-06-09days on market $69,800 Active 333 DOM
-
2026-06-08days on market $69,800 Active 332 DOM
-
2026-06-07days on market $69,800 Active 331 DOM
-
2026-06-05days on market $69,800 Active 328 DOM
-
2026-06-03days on market $69,800 Active 327 DOM
-
2026-06-02days on market $69,800 Active 326 DOM
-
2026-06-01days on market $69,800 Active 325 DOM
-
2026-05-31days on market $69,800 Active 324 DOM
-
2026-05-30days on market $69,800 Active 323 DOM
-
2026-04-28status Active
-
2026-03-17status Active
-
2026-03-16status Pending - Backup Offer Requested
-
2026-03-05status Pending
-
2026-02-21price $69,800
-
2025-12-08price $75,000
-
2025-06-26$80,000 Active
-
2014-10-29historical
-
2014-10-20soldstatus $11,000 Sold
-
2014-09-30status Pending
-
2014-08-14price $16,800
-
2014-07-14status Active
-
2014-07-09status Pending
-
2014-06-20status Active
-
2014-06-11status Pending Inspection
-
2014-05-16$18,000 Active
-
2002-10-11soldstatus $22,000
-
2002-05-02$23,900
-
1996-02-01soldstatus $12,500
-
1996-02-01soldstatus $12,500
ⓘ Source: listings_history table (triggers on properties + properties_extension) + one-shot
backfill from property_details.listing_events for pre-trigger history.
Tax reassessment forecast WA · Resets to sale price
- Current annual tax
- $301 · $25/mo
- Projected year-2 tax
- $657 · $55/mo
- Expected delta
- +$356/yr (+$30/mo · 118.4%)
ⓘ Screening estimate from a state-policy table — verify with the county assessor before closing.
Climate risk First Street
- Flood 1/10 Low FEMA zone X (unshaded) · 0% chance over 30 yrs
- Wildfire 4/10 Moderate
- Heat 2/10 Low 7 d/yr ≥80°F today · 18 d/yr by 30 yrs out
- Wind 1/10 Low
- Air quality 6/10 Major 7 unhealthy d/yr today · 8 by 30 yrs out
Nearby sold comps map
Loading sold comps map…
Walkable amenities ~0.75 mi
Loading nearby amenities…
Taxation est. · year 1
- Rental income
- $21,141
- − Mortgage interest
- −$3,753
- − Property taxes
- −$301
- − Insurance
- −$335
- − Repairs & maintenance
- −$1,691
- − Management
- −$1,691
- − Depreciation
- −$1,949
- Taxable income
- $11,420
- Est. tax owed @ 24.0%
- −$2,741
- After-tax cash flow
- $9,108/yr
For passive investors: Depreciation is non-cash, so a rental often shows a tax loss while cash-flowing — sheltering income. Rental losses are passive: they offset passive income freely, and up to $25,000/yr can offset ordinary (W-2) income if you actively participate and your MAGI is under $100k (phasing out to $0 by $150k); unused losses carry forward. On sale, claimed depreciation is recaptured at up to 25%, and gains may owe capital-gains tax (a 1031 exchange can defer both). Figures are a year-1 estimate at your 24.0% rate — not tax advice; consult a CPA.
Schools (NCES district)
- District
- Coupeville School District
- NCES district ID
- 5301800
- Math proficiency
- 54% ▲ 4.00%
- Reading proficiency
- 73% ▲ 1.00%
- Median HH income
- $57,404
- Composite
- 56.12/100
- National rank
- #2536
- State rank
- #40 of 291 in WA
Livability — Coupeville
- Score
- 79/100
- State rank
- #107
- US rank
- #2126
Category grades
Schools grade is shown separately in the Schools card above.
Census & demographics
- Census place
- Coupeville, WA
- County
- Island County · 71,196 people
- City population
- 7,656
- Metro
- Oak Harbor, WA
- Population (ZIP)
- 7,656
- Household income
- $92,125
- Rent vs Own
- Severe rent burden
- 140.0
Population outlook (Island County) Hauer SSP2
- Today (2025)
- 82,019 people
- By 2030
- 81,329 · -0.8%
- By 2040
- 78,552 · -4.2%
- By 2050
- 77,042 · -6.1%
- By 2075
- 80,799 · -1.5%
- By 2100
- 84,451 · +3.0%
Race, ethnicity, and origin ACS 2023
- Neighborhood character
- Predominantly White (86%)
- Race & ethnicity
- White 86% Hispanic / Latino 6% Two or more races 6% Asian 2%
- Hispanic origin (detail)
- Mexican 4%
- Common ancestry
- Italian 5% Portuguese 3% Slovak 3%
- Foreign-born
- 8% · Canada, China
- Languages at home
- 94% English-only · Spanish 2% Other Indo-European 1% Chinese 0%
Political lean MEDSL · Island
- 2024 margin
- D (+16.6) · D 56.8% · R 40.3% · Other 2.9%
- 2008→2024 swing
- +10.3pp toward D · 2008: 6.2pp · 2024: 16.6pp
- All cycles
- 2024: D+16.6 2020: D+12.0 2016: D+5.9 2012: D+4.4 2008: D+6.2
Not yet ingested
- Civics
- —
Market trends
- HPI YoY
- ▼ -274.50%
- Current HPI
- 193.7597
- Rent YoY
- —
- Metro
- Oak Harbor, WA
- State GDP YoY
- ▲ 4.65%
- F500 in state
- 22
Industry mix (Fortune 500 HQ in WA)
| Industry | F500 HQs | Revenue |
|---|---|---|
| Retail | 2 | $269B |
|
||
| Technology / Retail | 1 | $638B |
|
||
| Technology | 1 | $245B |
|
||
| Telecommunications | 1 | $38B |
|
||
| Food / Beverage | 1 | $36B |
|
||
| Automotive / Trucks | 1 | $34B |
|
||
Price history
+458.4% since first listed20 events — show timeline
- 2026-04-28 Relisted — NWMLS as Distributed by MLS Grid
- 2026-03-17 Relisted — NWMLS as Distributed by MLS Grid
- 2026-03-16 Pending — NWMLS as Distributed by MLS Grid
- 2026-03-05 Pending — NWMLS as Distributed by MLS Grid
- 2026-02-21 Price Changed $69,800 NWMLS as Distributed by MLS Grid
- 2025-12-08 Price Changed $75,000 NWMLS as Distributed by MLS Grid
- 2025-06-26 Listed $80,000 NWMLS as Distributed by MLS Grid
- 2014-10-29 Delisted — NWMLS as Distributed by MLS Grid
- 2014-10-20 Sold (MLS) $11,000 NWMLS as Distributed by MLS Grid
- 2014-09-30 Pending — NWMLS as Distributed by MLS Grid
- 2014-08-14 Price Changed $16,800 NWMLS as Distributed by MLS Grid
- 2014-07-14 Relisted — NWMLS as Distributed by MLS Grid
- 2014-07-09 Pending — NWMLS as Distributed by MLS Grid
- 2014-06-20 Relisted — NWMLS as Distributed by MLS Grid
- 2014-06-11 Pending — NWMLS as Distributed by MLS Grid
- 2014-05-16 Listed $18,000 NWMLS as Distributed by MLS Grid
- 2002-10-11 Sold (MLS) $22,000 NWMLS as Distributed by MLS Grid
- 2002-05-02 Listed $23,900 NWMLS as Distributed by MLS Grid
- 1996-02-01 Sold (Public Records) $12,500 Public Records
- 1996-02-01 Sold (Public Records) $12,500 Public Records
Property tax history
+8.8%/yrLatest (2021): $301 · +19.3% YoY. Source: county tax records.
Cash-flow waterfall
monthlySold comps — $/sqft
last 12 mo · ≤1 miLoading sold comps…