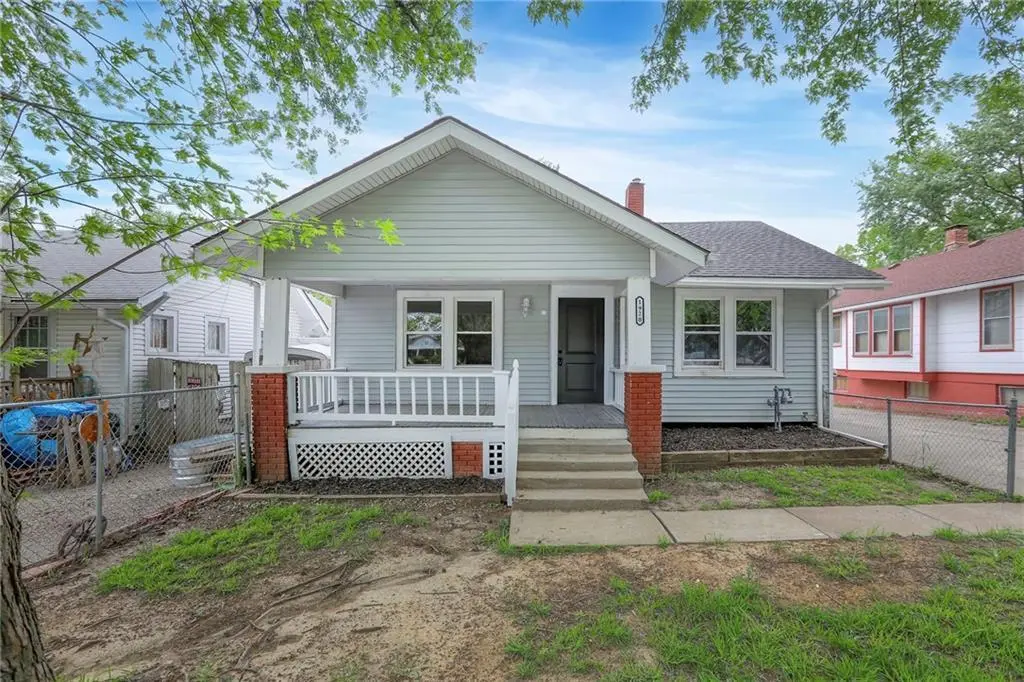
1920 S Ralston Ave · Independence, MO
Flood risk 1/10 · Minimal
- FEMA flood zone
- X (unshaded)
- Chance of flooding over 30 yrs
- 0.0%
- Est. flood insurance / yr
- $473 – $860
Fire risk 1/10 · Minimal
- Est. fire insurance / yr
- $1,054 – $1,958
Heat risk 4/10 · Minor
- Hot days now (above 106°F)
- 7 days/yr
- Hot days in 30 yrs
- 17 days/yr
Wind risk 2/10 · Minimal
- Chance of severe wind over 30 yrs
- —
Air-quality risk 3/10 · Minor
- Unhealthy air days now
- 2 days/yr
- Unhealthy air days in 30 yrs
- 3 days/yr
Risk factors via First Street. Map © Google.
Why this score? — see what drove the D grade
The composite is a weighted blend of 9 inputs, each scored 0–100. Each bar is that input's sub-score; the figure is the points it added to the 100-point composite (weight × sub-score).
- Cash flow +14.1/30.0
- ARV discount +8.3/15.0
- DSCR +4.3/10.0
- Livability +4.1/5.0
- Rent growth +3.9/5.0
- 1% rule +2.9/10.0
- Schools +2.7/10.0
- Condition / age +2.5/5.0
- Appreciation +0.0/10.0
$179,900
🖨 Deal sheet 📄 Offer letter ✓ Due diligence
Listing remarks MLS
Sweet little bungalow in an established neighborhood just a few blocks from Englewood Arts District & from Hill Park. All freshly painted w/ brand new carpet. Nice Galley style kitchen w/ lots of counter space & breakfast nook. Living room features vaulted ceiling w/ skylight & decorative fireplace. Inside entrance to basement where the master and master bath are located or could be a great family room area. Covered front porch & fenced front yard for pets or children to play. Vinyl windows and siding and all soffits are covered for easy outside maintenance. Off street parking for at least 4-5 cars and big concrete pad in back yard to build a detached garage in the future. Basement is also walkup to backyard.
Key facts
- Ample parking
- Finished basement
- Long driveway
Tags
Property features AI
Finance
- Other: Lot roughly 40 x 140 (5,528 sq ft)
- HOA & community: No association fees
Exterior
- Parking: Other parking
- Security: Smoke detector(s)
- Utilities: Public water; Public sewer
- Home design: Single family residence; Residential property; Bungalow style; Approximately 1,233 above-grade finished area and 695 below-grade finished area; Inside city limits
- Construction: Frame construction with vinyl siding; Composition roof
- Exterior features: Porch; Partial fencing; Paved road access
Interior
- Kitchen: Laminate counters; Electric range; Free-standing electric oven; Dishwasher
- Bedrooms: 3 bedrooms total; Basement bedroom (carpeted, 18x21); First-floor bedroom (carpeted, ceiling fan, 11x12); First-floor bedroom (carpeted, ceiling fan, 9x11)
- Flooring: Carpet in living spaces and bedrooms; Ceramic tile in bathrooms
- Bathrooms: 2 full bathrooms; Bathroom with ceramic tile and shower-over-tub (first floor); Bathroom with ceramic tile and shower-over-tub (basement)
- Heating & cooling: Forced air heating; Electric cooling
- Interior features: Thermal windows; Finished full basement with inside entrance; Bungalow floor plan; Smoke detectors
- Laundry & utility: Laundry located in basement
Neighborhood map
What this means for you Summary
Snapshot
- This is a 4-bed/2.0-bath single-family listed at $180k.
Deal economics
- At list price, monthly cash flow is $26 ($308/yr) — positive.
- The deal already cash-flows at list — no discount required.
- To meet the 1% rule (rent ≥ 1% of price), the offer needs to be $143k (20.5% below list).
- Recommended offer: $143k (20.5% below list) — sets the bar for 1% rule.
- Cap rate 6.5% vs local median 5.0% in Independence — meaningfully above typical; check what's discounted (condition, days-on-market, listing class) to confirm the premium yield is real.
Location & tenants
- Location reads 82/100 on livability (#10 in MO, #1,296 nationally) — a professional / high-income tenant draw. Strengths: amenities A+, commute A+, cost of living A+; Watch: employment D+, crime F.
- Independence 30 (suburban): math 26% / reading 38% proficiency, ranked #252 of 324 in MO (top 78%) — families likely to look elsewhere, expect single-tenant / working-renter base with shorter leases.
- Zoned schools: Abraham Mallinson Elementary (math 20% / reading 34%, grade F, #850 of 1,115 statewide, top 78%, 272 students, 80% FRL); Van Horn High (math 13% / reading 27%, grade F, #472 of 521 statewide, top 91%, 1,047 students, 72% FRL) — zoned schools average 76% FRL vs 58% district-wide (18 pts higher); higher-poverty schools than district average — tighter screening recommended.
- Market conditions: Rents rising fast (+5.4%/yr); 127 active listings in the ZIP; 1 comparable units currently listed for rent nearby; 4,002 units permitted in Jackson County in 2024 (2,271 in 5+ unit buildings).
Forward outlook
- Local home prices are declining (-3.0%/yr); year-one equity from $1k of loan paydown is wiped out by about $5k of value loss. Plan a longer hold.
- Jackson County population projected at +4% by 2050 — modest demand growth; plan on rents tracking national, not racing it.
Negotiation context
- Only 5 days on market — expect competitive offers; lowballing is unlikely to land.
- 2 sale attempts since 6y ago with the ask held roughly flat each time — persistent listings suggest the price (not the market) is what's stuck; bring a comps-based counter.
Risks & watch-outs
- Watch-outs: built in 1925 — expect roof / HVAC / electrical / plumbing capex.
Questions for the listing agent
- Built in 1925 — when were the roof, HVAC, electrical panel, plumbing, and water heater last replaced?
- Is there a deadline driving the sale (1031 exchange, divorce, estate, relocation)? That informs how much negotiation room exists.
- Crime grade is F in this area — have there been break-ins, vandalism, or insurance claims at this property in the last 3 years? What carrier currently insures it and at what premium?
- The area grade is low — what's the realistic commute time and amenity access for the typical tenant pool here? Any planned neighborhood developments (good or bad) we should know about?
- What's the average days-on-market for RENTAL listings here right now (not sales)? A rising rental-DOM trend means longer vacancies and softer asking-rent achievability than the comps imply.
- What's the recent tenant-quality profile in this submarket — average credit score on applications, eviction rate, late-payment / NSF rate, and stable-employment percentage? A property-management company in the area should have these aggregated.
- How much new for-sale + rental construction is in the pipeline within 1–3 miles? Heavy new supply typically softens prices + rents 12–24 months out; constrained supply supports both.
Investment metrics
- 1% rule
- 0.79% ✗
- Cap rate
- 6.46%
- Cash-on-cash
- 0.61%
- DSCR
- 1.03
- GRM
- 10.5
CMA / ARV
- ARV (median comp)
- $183,331
- List price
- $179,900
- Delta
- -1.87%
- Verdict
- FAIR
- Comps
- 20 within 1.0 mi
Show comp detail 3 sales within ~0.75 mi
| Address | Dist | Beds/Ba | Sqft | Sold | Price | $/sf | Match |
|---|---|---|---|---|---|---|---|
| 2501 S Hawthorne Ave | 0.59mi | 3/1.0 (-1) | 792 (+8%) | 13mo | $140,000 | $177 | 39 |
| 2544 S Overton Ave | 0.74mi | 3/1.0 (-1) | 802 (+10%) | 10mo | $99,000 | $123 | 32 |
| 2341 Englewood Ct | 0.67mi | 3/1.0 (-1) | 825 (+13%) | 20mo | $149,900 | $182 | 22 |
Match score weights: distance 35% · size 25% · config 20% · recency 20%. Top-matched comps best support the ARV.
Projected returns pro-forma
-3.0% appreciation · 5.43% rent growth · sell at horizon
- IRR
- -13.0%
- Equity multiple
- 0.52×
- Total profit
- $-24,002
- Equity at exit
- $26,824
- IRR
- -1.0%
- Equity multiple
- 0.93×
- Total profit
- $-3,612
- Equity at exit
- $15,554
Cash invested: $50,372 (down + closing). Projections, not guarantees.
Landlord ↔ Tenant lean methodology
- Overall (STATE)
- 81 Strongly Landlord-Friendly
- State Missouri
- 81 Strongly Landlord-Friendly · R+10
- County
- — inherits STATE
- City
- — inherits STATE
ZIP-level market 64052
- Home prices YoY
- -34.6%
- Rents YoY
- 5.4%
- Active inventory
- 127
- Price-to-rent
- 10.5×
Monthly cashflow live
- Estimated rent
- $1,430 medium interval (Pro) →
- Mortgage (P&I)
- −$943
- Tax from tax record
- −$86 /mo · $1,029/yr
- Insurance
- −$75
- HOA
- −$0
- Vacancy / Maint / Mgmt
- −$300
- Net cashflow
- $26
Break-even live
UW: 25.0% down · 7.5% · 30yr · 1.5% tax · 5.0% vac · 8.0% maint · 8.0% mgmt
Financing live
Cash to close
- Down payment
- $44,975
- Closing costs
- $5,397
- Reserves months
- —
- Total cash needed
- —
Loan-product check · same deal, 3 products live
Conventional
25% down · 7.5% · 30yr
- Down + closing
- —
- Monthly P&I
- —
- Monthly cashflow
- —
- DSCR
- —
- Eligible?
- —
Personal DTI + credit; lowest rate.
DSCR
20% down · 8.5% · 30yr
- Down + closing
- —
- Monthly P&I
- —
- Monthly cashflow
- —
- DSCR
- —
- Eligible?
- —
No personal income docs; deal must DSCR.
Hard money
10% down · 12.0% · 12mo
- Down + closing
- —
- Monthly P&I
- —
- Monthly cashflow
- —
- DSCR
- —
- Eligible?
- —
Short-term bridge; refi at stabilization.
Rent comps 1 comps
| Address | Beds | Baths | Sqft | Rent | $/sqft | DOM | Units | Dist |
|---|---|---|---|---|---|---|---|---|
| 9528 E Winner Rd Independence, MO | 1.0–3.0 | 1.0 | 730 | $1,099 | $1.51 | 43d | 1 | 1.13mi |
Listing history 9 events
-
2026-05-02status Pending 418-char remark
-
2026-04-27$179,900 Active 418-char remark
-
2026-03-13soldstatus
-
2020-06-03soldstatus
-
2020-05-29soldstatus Sold 742-char remark
Show marketing remark (742 chars)
Sweet little bungalow in an established neighborhood just a few blocks from Englewood Arts District & from Hill Park. All freshly painted w/ brand new carpet. Nice Galley style kitchen w/ lots of counter space & breakfast nook. Living room features vaulted ceiling w/ skylight & decorative fireplace. Inside entrance to basement where the master and master bath are located or could be a great family room area. Covered front porch & fenced front yard for pets or children to play. Vinyl windows and siding and all soffits are covered for easy outside maintenance. Off street parking for at least 4-5 cars and big concrete pad in back yard to build a detached garage in the future. Basement is also walkup to backyard.
-
2020-04-22status Pending 742-char remark
Show marketing remark (742 chars)
Sweet little bungalow in an established neighborhood just a few blocks from Englewood Arts District & from Hill Park. All freshly painted w/ brand new carpet. Nice Galley style kitchen w/ lots of counter space & breakfast nook. Living room features vaulted ceiling w/ skylight & decorative fireplace. Inside entrance to basement where the master and master bath are located or could be a great family room area. Covered front porch & fenced front yard for pets or children to play. Vinyl windows and siding and all soffits are covered for easy outside maintenance. Off street parking for at least 4-5 cars and big concrete pad in back yard to build a detached garage in the future. Basement is also walkup to backyard.
-
2020-04-16$92,900 Active 742-char remark
Show marketing remark (742 chars)
Sweet little bungalow in an established neighborhood just a few blocks from Englewood Arts District & from Hill Park. All freshly painted w/ brand new carpet. Nice Galley style kitchen w/ lots of counter space & breakfast nook. Living room features vaulted ceiling w/ skylight & decorative fireplace. Inside entrance to basement where the master and master bath are located or could be a great family room area. Covered front porch & fenced front yard for pets or children to play. Vinyl windows and siding and all soffits are covered for easy outside maintenance. Off street parking for at least 4-5 cars and big concrete pad in back yard to build a detached garage in the future. Basement is also walkup to backyard.
-
2006-10-13soldstatus
-
1988-04-12soldstatus
ⓘ Source: listings_history table (triggers on properties + properties_extension) + one-shot
backfill from property_details.listing_events for pre-trigger history.
Tax reassessment forecast MO · Resets to sale price
- Current annual tax
- $1,029 · $86/mo
- Projected year-2 tax
- $1,745 · $145/mo
- Expected delta
- +$716/yr (+$60/mo · 69.6%)
ⓘ Screening estimate from a state-policy table — verify with the county assessor before closing.
Climate risk First Street
- Flood 1/10 Low FEMA zone X (unshaded) · 0% chance over 30 yrs
- Wildfire 1/10 Low
- Heat 4/10 Moderate 7 d/yr ≥106°F today · 17 d/yr by 30 yrs out
- Wind 2/10 Low
- Air quality 3/10 Moderate 2 unhealthy d/yr today · 3 by 30 yrs out
Nearby sold comps map
Loading sold comps map…
Walkable amenities ~0.75 mi
Loading nearby amenities…
Taxation est. · year 1
- Rental income
- $17,161
- − Mortgage interest
- −$10,077
- − Property taxes
- −$1,029
- − Insurance
- −$900
- − Repairs & maintenance
- −$1,373
- − Management
- −$1,373
- − Depreciation
- −$5,233
- Taxable loss
- −$2,824
- Est. tax savings @ 24.0%
- +$678
- After-tax cash flow
- $985/yr
For passive investors: Depreciation is non-cash, so a rental often shows a tax loss while cash-flowing — sheltering income. Rental losses are passive: they offset passive income freely, and up to $25,000/yr can offset ordinary (W-2) income if you actively participate and your MAGI is under $100k (phasing out to $0 by $150k); unused losses carry forward. On sale, claimed depreciation is recaptured at up to 25%, and gains may owe capital-gains tax (a 1031 exchange can defer both). Figures are a year-1 estimate at your 24.0% rate — not tax advice; consult a CPA.
Schools (NCES district)
- District
- Independence 30
- NCES district ID
- 2915480
- Math proficiency
- 26% ▼ -8.00%
- Reading proficiency
- 38% ▼ -5.00%
- Median HH income
- $41,843
- Composite
- 27.04/100
- National rank
- #7054
- State rank
- #252 of 324 in MO
Livability — Independence
- Score
- 82/100
- State rank
- #10
- US rank
- #1296
Category grades
Schools grade is shown separately in the Schools card above.
Census & demographics
- Census place
- Independence, MO
- County
- Jackson County · 687,798 people
- City population
- 117,675
- Metro
- Kansas City, MO-KS
- Population (ZIP)
- 22,138
- Household income
- $59,007
- Rent vs Own
- Severe rent burden
- 965.0
Population outlook (Jackson County) Hauer SSP2
- Today (2025)
- 719,589 people
- By 2030
- 731,456 · +1.6%
- By 2040
- 746,689 · +3.8%
- By 2050
- 749,289 · +4.1%
- By 2075
- 736,227 · +2.3%
- By 2100
- 668,210 · -7.1%
Race, ethnicity, and origin ACS 2023
- Neighborhood character
- Diverse neighborhood (Simpson 0.56)
- Race & ethnicity
- White 62% Hispanic / Latino 23% Two or more races 15% Black 7% Asian 2%
- Hispanic origin (detail)
- Mexican 15%
- Common ancestry
- Italian 12% Slovak 2% Lithuanian 2%
- Foreign-born
- 11% · Canada, China
- Languages at home
- 85% English-only · Spanish 13% Other Asian/Pacific 1%
Political lean MEDSL · Jackson
- 2024 margin
- D (+19.3) · D 58.9% · R 39.5% · Other 1.6%
- 2008→2024 swing
- -6.1pp toward R · 2008: 25.4pp · 2024: 19.3pp
- All cycles
- 2024: D+19.3 2020: D+22.0 2016: D+16.6 2012: D+19.0 2008: D+25.4
Not yet ingested
- Civics
- —
Market trends
- HPI YoY
- ▼ -160.06%
- Current HPI
- 302.1124
- Rent YoY
- ▲ 5.43%
- Metro
- Kansas City, MO-KS
- State GDP YoY
- ▲ 1.84%
- F500 in state
- 20
Industry mix (Fortune 500 HQ in MO)
| Industry | F500 HQs | Revenue |
|---|---|---|
| Healthcare | 1 | $163B |
|
||
| Insurance | 1 | $21B |
|
||
| Industrial Technology | 1 | $17B |
|
||
| Retail | 1 | $16B |
|
||
| Industrial Distribution | 1 | $10B |
|
||
| Utilities | 1 | $9B |
|
||
Price history
+93.6% since first listed10 events — show timeline
- 2026-05-26 Sold (MLS) — Heartland MLS as Distributed by MLS Grid
- 2026-05-02 Pending — Heartland MLS as Distributed by MLS Grid
- 2026-04-27 Listed $179,900 Heartland MLS as Distributed by MLS Grid
- 2026-03-13 Sold (Public Records) — Public Records
- 2020-06-03 Sold (Public Records) — Public Records
- 2020-05-29 Sold (MLS) — Heartland MLS as Distributed by MLS Grid
- 2020-04-22 Pending — Heartland MLS as Distributed by MLS Grid
- 2020-04-16 Listed $92,900 Heartland MLS as Distributed by MLS Grid
- 2006-10-13 Sold (Public Records) — Public Records
- 1988-04-12 Sold (Public Records) — Public Records
Property tax history
+5.0%/yrLatest (2025): $1,029 · -26.3% YoY. Source: county tax records.
Cash-flow waterfall
monthlySold comps — $/sqft
last 12 mo · ≤1 miLoading sold comps…