53 S Perry St · Prue, OK
Flood risk 1/10 · Minimal
- FEMA flood zone
- X (unshaded)
- Chance of flooding over 30 yrs
- 0.0%
- Est. flood insurance / yr
- $507 – $1,088
Fire risk 9/10 · Severe
- Est. fire insurance / yr
- $2,463 – $4,575
Heat risk 6/10 · Moderate
- Hot days now (above 110°F)
- 7 days/yr
- Hot days in 30 yrs
- 18 days/yr
Wind risk 3/10 · Minor
- Chance of severe wind over 30 yrs
- 5.0%
Air-quality risk 2/10 · Minimal
- Unhealthy air days now
- 1 days/yr
- Unhealthy air days in 30 yrs
- 1 days/yr
Risk factors via First Street. Map © Google.
Why this score? — see what drove the C grade
The composite is a weighted blend of 9 inputs, each scored 0–100. Each bar is that input's sub-score; the figure is the points it added to the 100-point composite (weight × sub-score).
- Cash flow +23.3/30.0
- DSCR +7.5/10.0
- ARV discount +7.5/15.0
- 1% rule +6.1/10.0
- Appreciation +5.0/10.0
- Schools +3.7/10.0
- Livability +2.8/5.0
- Rent growth +2.5/5.0
- Condition / age +1.0/5.0
$100,000
🖨 Deal sheet 📄 Offer letter ✓ Due diligence
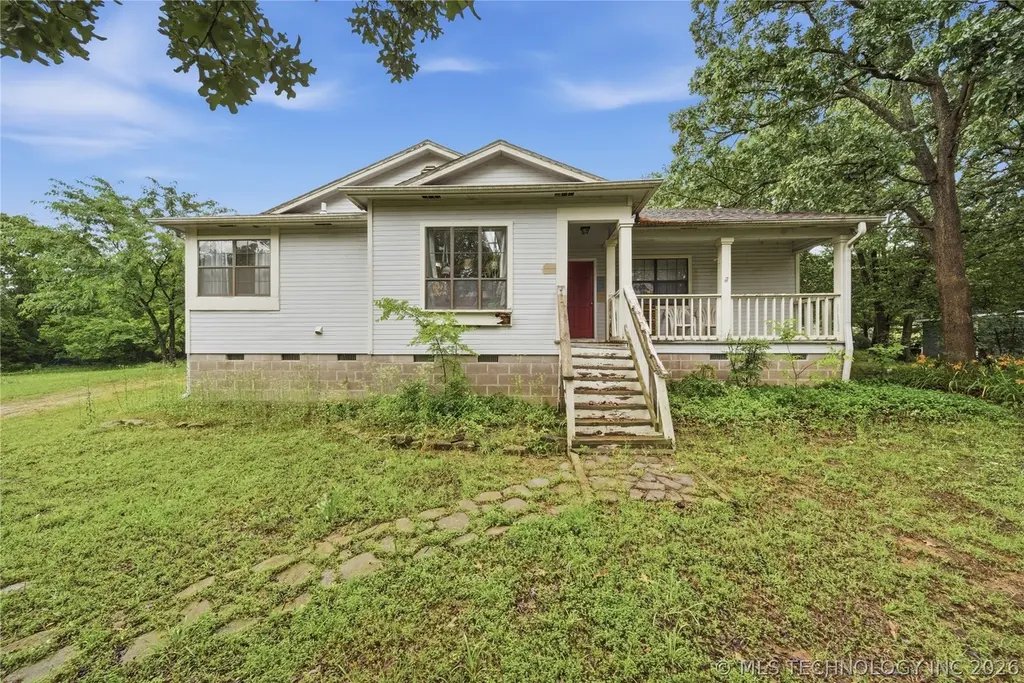
Listing remarks
Stop dreaming about the lake life and start living it! Located at 53 S Perry in Prue, OK, this 1,288 sq ft bungalow sits on a gorgeous 2.3-acre parcel less than a mile from the water. What you? ll love: ? 3 Bedrooms / 2 Bathrooms with a cozy, efficient floor plan ? Covered front porch AND covered back porch for ultimate relaxation ? 2.3 private acres with room for a massive workshop or pool ? Bring your boat, RV, and toys? no HOA restrictions or storage fees! Quiet country living with unbeatable water access just minutes away. Being sold AS-IS, but at this price, this one won't last long! Schedule your private tour today and come see all that this cutie home has to&zwnj
Key facts
- Covered front porch
- Private acres
- Water access
Tags
Property features AI
Finance
- Financial info: Annual tax information available
Exterior
- Parking: Gravel driveway
- Security: Smoke detector(s); No safety shelter
- Utilities: Public water; Septic tank; Electricity available; Cable available; Phone available
- Home design: Single-story home
- Construction: HardiPlank siding and wood frame construction; Asphalt/fiberglass roof; Built per public records (year built source: public records); Crawlspace foundation
- Exterior features: Covered porch and patio; Gravel driveway; Mature trees and wooded lot; Boat ramp/lift access to Keystone Lake; Faces west
Interior
- Kitchen: Oven; Range; Refrigerator; Disposal; Pantry; Plumbed for ice maker
- Bedrooms: Master bedroom with private bath and walk-in closet (first floor); Bedroom with walk-in closet (first floor); Bedroom without bath (first floor)
- Flooring: Carpet; Vinyl
- Bathrooms: Two full bathrooms (including a master bath with double sink)
- Heating & cooling: Central heating (electric); Central air; Window unit(s); Zoned cooling
- Interior features: High ceilings; High-speed internet; Laminate counters; Wired for data; Aluminum window frames; Electric oven and range connections; Crawl space
- Laundry & utility: Washer hookup; Electric dryer hookup; Interior utility room (first floor)
Neighborhood map
What this means for you Summary
Snapshot
- This is a 3-bed/2.0-bath single-family listed at $100k. Condition is rated poor.
Deal economics
- At list price, monthly cash flow is $184 ($2k/yr) — positive.
- The deal already cash-flows at list — no discount required.
- Meets the 1% rule at list price ($1k rent vs $100k).
Location & tenants
- Location reads 56/100 on livability (#527 in OK) — a working-class tenant base; expect higher turnover. Strengths: cost of living A+, housing A+; Watch: employment C-, schools D-, crime F.
- Prue (rural): math 45% / reading 35% proficiency, ranked #102 of 513 in OK (top 20%) — families likely to look elsewhere, expect single-tenant / working-renter base with shorter leases; 78% free/reduced lunch — lower-income household profile, screen leases tightly.
- Market conditions: 5 active listings in the ZIP; 89 units permitted in Osage County in 2024 (0 in 5+ unit buildings).
Forward outlook
- In year one you build about $4k of equity ($691 loan paydown + $3k appreciation (3.0% local appreciation)).
- Osage County population projected to shrink 6% by 2050 — rents likely to lag national; underwrite the cash flow, not the appreciation.
- At projected returns (3.0% appreciation + 3.0% rent growth), your $28k cash investment doubles in ~5 years — after that, you're playing with house money.
- By year 9, paydown + projected appreciation supports a ~$31k cash-out refi (75% LTV) — recoverable capital for the next deal without selling this one.
Negotiation context
- Only 4 days on market — expect competitive offers; lowballing is unlikely to land.
Risks & watch-outs
- Climate carrying-cost: severe wildfire risk; extreme-heat days projected 7→18/yr by 2055 (HVAC capex compounding) — expect insurance premiums to compound above CPI over the hold.
Questions for the listing agent
- Have any recent inspections been done? Can we get a copy of the seller's disclosures and any deferred-maintenance estimates?
- Is there a deadline driving the sale (1031 exchange, divorce, estate, relocation)? That informs how much negotiation room exists.
- Schools are D-rated, which usually means shorter tenancies and higher turnover. Who's the typical renter profile here, and what's been the actual vacancy rate?
- Crime grade is F in this area — have there been break-ins, vandalism, or insurance claims at this property in the last 3 years? What carrier currently insures it and at what premium?
- What's the average days-on-market for RENTAL listings here right now (not sales)? A rising rental-DOM trend means longer vacancies and softer asking-rent achievability than the comps imply.
- What's the recent tenant-quality profile in this submarket — average credit score on applications, eviction rate, late-payment / NSF rate, and stable-employment percentage? A property-management company in the area should have these aggregated.
- How much new for-sale + rental construction is in the pipeline within 1–3 miles? Heavy new supply typically softens prices + rents 12–24 months out; constrained supply supports both.
Investment metrics
- 1% rule
- 1.11% ✓
- Cap rate
- 8.50%
- Cash-on-cash
- 7.87%
- DSCR
- 1.35
- GRM
- 7.5
CMA / ARV
- ARV (on-the-fly)
- $204,792
- Comps found
- 4
Show comp detail 4 sales within ~0.75 mi
| Address | Dist | Beds/Ba | Sqft | Sold | Price | $/sf | Match |
|---|---|---|---|---|---|---|---|
| 37 N Main St | 0.14mi | 3/2.0 | 1,152 (-11%) | 1mo | $215,000 | $187 | 75 |
| 63 Quail Run Rd | 0.40mi | 3/2.0 | 1,320 (+2%) | 10mo | $30,000 | $23 | 68 |
| 181 N Perry St | 0.23mi | 3/2.0 | 1,248 (-3%) | 20mo | $199,000 | $159 | 67 |
| 127 N 1st St | 0.24mi | 3/2.0 | 1,468 (+14%) | 18mo | $210,000 | $143 | 50 |
Match score weights: distance 35% · size 25% · config 20% · recency 20%. Top-matched comps best support the ARV.
Projected returns pro-forma
3.0% appreciation · 3.0% rent growth · sell at horizon
- IRR
- 14.9%
- Equity multiple
- 1.85×
- Total profit
- $23,754
- Equity at exit
- $44,964
- IRR
- 16.6%
- Equity multiple
- 3.44×
- Total profit
- $68,217
- Equity at exit
- $69,295
Cash invested: $28,000 (down + closing). Projections, not guarantees.
Landlord ↔ Tenant lean methodology
- Overall (STATE)
- 83 Strongly Landlord-Friendly
- State Oklahoma
- 83 Strongly Landlord-Friendly · R+20
- County
- — inherits STATE
- City
- — inherits STATE
ZIP-level market 74060
- Active inventory
- 5
- Price-to-rent
- 7.5×
Monthly cashflow live
- Estimated rent
- $1,107 medium interval (Pro) →
- Mortgage (P&I)
- −$524
- Tax est. 1.5%
- −$125 /mo · $1,500/yr
- Insurance
- −$42
- HOA
- −$0
- Vacancy / Maint / Mgmt
- −$232
- Net cashflow
- $184
Break-even live
UW: 25.0% down · 7.5% · 30yr · 1.5% tax · 5.0% vac · 8.0% maint · 8.0% mgmt
Financing live
Cash to close
- Down payment
- $25,000
- Closing costs
- $3,000
- Reserves months
- —
- Total cash needed
- —
Loan-product check · same deal, 3 products live
Conventional
25% down · 7.5% · 30yr
- Down + closing
- —
- Monthly P&I
- —
- Monthly cashflow
- —
- DSCR
- —
- Eligible?
- —
Personal DTI + credit; lowest rate.
DSCR
20% down · 8.5% · 30yr
- Down + closing
- —
- Monthly P&I
- —
- Monthly cashflow
- —
- DSCR
- —
- Eligible?
- —
No personal income docs; deal must DSCR.
Hard money
10% down · 12.0% · 12mo
- Down + closing
- —
- Monthly P&I
- —
- Monthly cashflow
- —
- DSCR
- —
- Eligible?
- —
Short-term bridge; refi at stabilization.
Listing history 3 events
-
2026-06-02statusdays on market $100,000 Pending 4 DOM
-
2026-06-01days on market $100,000 Active 3 DOM
-
2026-05-31days on market $100,000 Active 2 DOM
ⓘ Source: listings_history table (triggers on properties + properties_extension) + one-shot
backfill from property_details.listing_events for pre-trigger history.
Climate risk First Street
- Flood 1/10 Low FEMA zone X (unshaded) · 0% chance over 30 yrs
- Wildfire 9/10 Extreme
- Heat 6/10 Major 7 d/yr ≥110°F today · 18 d/yr by 30 yrs out
- Wind 3/10 Moderate 5% chance of damaging wind over 30 yrs
- Air quality 2/10 Low 1 unhealthy d/yr today · 1 by 30 yrs out
Nearby sold comps map
Loading sold comps map…
Walkable amenities ~0.75 mi
Loading nearby amenities…
Taxation est. · year 1
- Rental income
- $13,286
- − Mortgage interest
- −$5,602
- − Property taxes
- −$1,500
- − Insurance
- −$500
- − Repairs & maintenance
- −$1,063
- − Management
- −$1,063
- − Depreciation
- −$2,909
- Taxable income
- $649
- Est. tax owed @ 24.0%
- −$156
- After-tax cash flow
- $2,047/yr
For passive investors: Depreciation is non-cash, so a rental often shows a tax loss while cash-flowing — sheltering income. Rental losses are passive: they offset passive income freely, and up to $25,000/yr can offset ordinary (W-2) income if you actively participate and your MAGI is under $100k (phasing out to $0 by $150k); unused losses carry forward. On sale, claimed depreciation is recaptured at up to 25%, and gains may owe capital-gains tax (a 1031 exchange can defer both). Figures are a year-1 estimate at your 24.0% rate — not tax advice; consult a CPA.
Condition & rehab AI · 2 photos
This property requires extensive repairs and maintenance, including roof, exterior siding, and landscaping. Significant improvements are needed to increase its resale and rental value.
Repairs flagged
- Major roof — Signs of water damage and potential leaks.
- Major exterior siding — Peeling paint and chipping paint indicate significant damage.
- Major front porch flooring — Uneven and damaged flooring requires replacement.
- Major landscaping — Overgrown and unkempt landscaping needs trimming and maintenance.
- Major fencing — The absence of fencing or poor condition of existing fencing would need addressing.
- Major interior walls and systems — The exterior condition suggests significant wear and tear that would likely extend to the interior and systems. Further inspection is needed to confirm this.
Value-add opportunities
- Both landscaping and curb appeal — A well-maintained and aesthetically pleasing exterior can significantly increase both resale and rental value.
- Both roof repair — Fixing the roof will prevent further water damage and improve the overall condition of the property.
- Both exterior siding repair — Repairing the siding will improve the property's appearance and increase its value.
- Both front porch flooring replacement — A new, stable front porch will enhance the property's curb appeal and functionality.
- Both fencing installation — A new fence will improve the property's security and aesthetic appeal.
- Both interior repairs and updates — Addressing any interior issues will improve the property's condition and increase its value for both resale and rental purposes. Further inspection is needed to confirm this.
Renovation cost estimate screening
| Repair item | Severity | Est. cost |
|---|---|---|
| roof · Signs of water damage and potential leaks. | Major | $15,000–50,000 |
| exterior siding · Peeling paint and chipping paint indicate significant damage. | Major | $15,000–50,000 |
| front porch flooring · Uneven and damaged flooring requires replacement. | Major | $15,000–50,000 |
| landscaping · Overgrown and unkempt landscaping needs trimming and maintenance. | Major | $15,000–50,000 |
| fencing · The absence of fencing or poor condition of existing fencing would need addressing. | Major | $15,000–50,000 |
| interior walls and systems · The exterior condition suggests significant wear and tear that would likely extend to the interior and systems. Further inspection is needed to confirm this. | Major | $15,000–50,000 |
| Total estimated repair cost · 6 items | $90,000–300,000 |
Value-add ROI direction
- Both landscaping and curb appeal — A well-maintained and aesthetically pleasing exterior can significantly increase both resale and rental value. ↑
- Both roof repair — Fixing the roof will prevent further water damage and improve the overall condition of the property. ↑
- Both exterior siding repair — Repairing the siding will improve the property's appearance and increase its value. ↑
- Both front porch flooring replacement — A new, stable front porch will enhance the property's curb appeal and functionality. ↑
- Both fencing installation — A new fence will improve the property's security and aesthetic appeal. ↑
- Both interior repairs and updates — Addressing any interior issues will improve the property's condition and increase its value for both resale and rental purposes. Further inspection is needed to confirm this. ↑
ⓘ Cost ranges are severity-bucket heuristics (US national rule-of-thumb). Get contractor quotes + a written scope before underwriting a rehab budget.
Schools (NCES district)
- District
- Prue
- NCES district ID
- 4025170
- Math proficiency
- 45% ▲ 15.00%
- Reading proficiency
- 35% ▲ 5.00%
- Median HH income
- $45,700
- Composite
- 36.53/100
- National rank
- #9301
- State rank
- #102 of 513 in OK
Livability — Prue
- Score
- 56/100
- State rank
- #527
- US rank
- #22857
Category grades
Schools grade is shown separately in the Schools card above.
Census & demographics
- Census place
- Prue, OK
- Population (ZIP)
- 368
Population outlook (Osage County) Hauer SSP2
- Today (2025)
- 48,950 people
- By 2030
- 48,936 · +-0.0%
- By 2040
- 47,826 · -2.3%
- By 2050
- 45,781 · -6.5%
- By 2075
- 41,140 · -16.0%
- By 2100
- 32,796 · -33.0%
Race, ethnicity, and origin ACS 2023
- Neighborhood character
- Predominantly White (69%)
- Race & ethnicity
- White 69% Two or more races 23% Native American 5%
- Common ancestry
- Slovak 5% Serbian 2% Iranian 1%
- Foreign-born
- 1%
Political lean MEDSL · Osage
- 2024 margin
- Solid R (+41.4) · D 28.4% · R 69.8% · Other 1.7%
- 2008→2024 swing
- -17.7pp toward R · 2008: -23.7pp · 2024: -41.4pp
- All cycles
- 2024: R+41.4 2020: R+39.5 2016: R+36.8 2012: R+25.2 2008: R+23.7
Not yet ingested
- Civics
- —
Market trends
- HPI YoY
- —
- Current HPI
- —
- Rent YoY
- —
- Metro
- —
- State GDP YoY
- ▲ 1.55%
- F500 in state
- 6
Industry mix (Fortune 500 HQ in OK)
| Industry | F500 HQs | Revenue |
|---|---|---|
| Energy | 3 | $48B |
|
||
Price history
1 event — show timeline
- 2026-05-29 Listed $100,000 MLS Technology, Inc.
Cash-flow waterfall
monthlySold comps — $/sqft
last 12 mo · ≤1 miLoading sold comps…