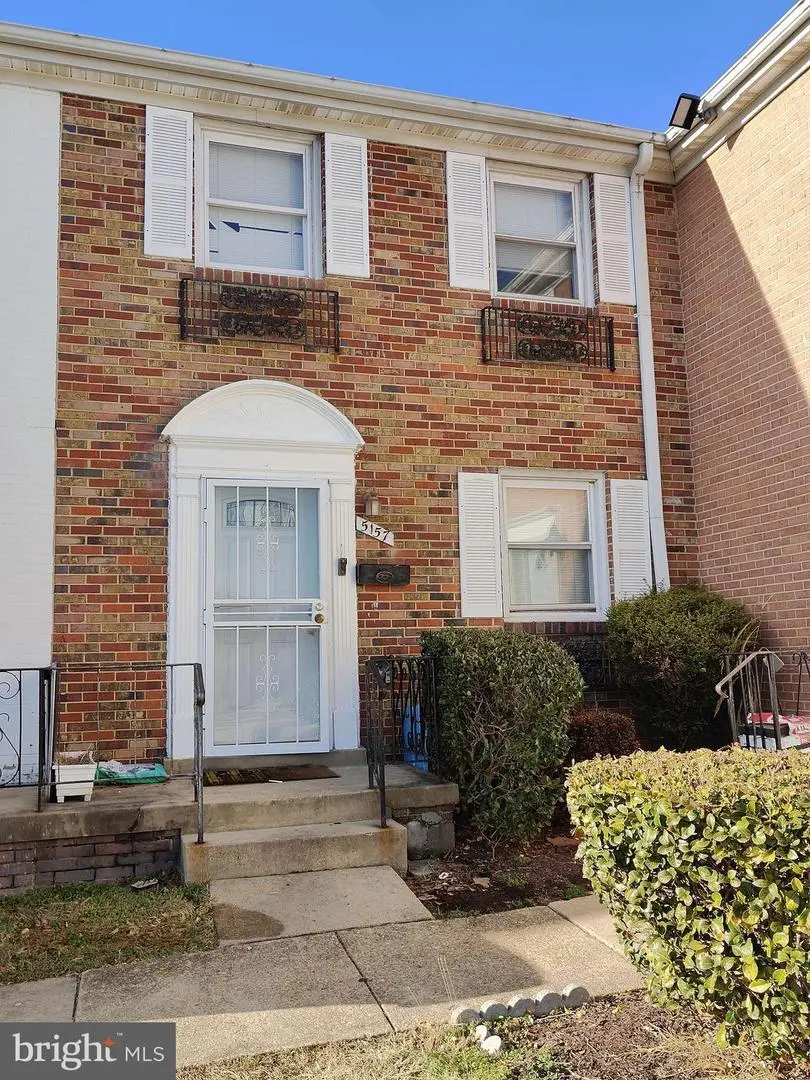
5157 Clacton Ave #54 · Camp Springs, MD
Flood risk 1/10 · Minimal
- FEMA flood zone
- X (unshaded)
- Chance of flooding over 30 yrs
- 0.0%
- Est. flood insurance / yr
- $507 – $1,088
Fire risk 1/10 · Minimal
- Est. fire insurance / yr
- $755 – $1,403
Heat risk 7/10 · Major
- Hot days now (above 103°F)
- 7 days/yr
- Hot days in 30 yrs
- 16 days/yr
Wind risk 4/10 · Minor
- Chance of severe wind over 30 yrs
- 23.0%
Air-quality risk 3/10 · Minor
- Unhealthy air days now
- 2 days/yr
- Unhealthy air days in 30 yrs
- 3 days/yr
Risk factors via First Street. Map © Google.
Why this score? — see what drove the C grade
The composite is a weighted blend of 9 inputs, each scored 0–100. Each bar is that input's sub-score; the figure is the points it added to the 100-point composite (weight × sub-score).
- Cash flow +21.2/30.0
- ARV discount +15.0/15.0
- DSCR +6.8/10.0
- 1% rule +6.7/10.0
- Livability +3.1/5.0
- Condition / age +2.5/5.0
- Rent growth +2.2/5.0
- Schools +1.7/10.0
- Appreciation +0.0/10.0
$240,000
🖨 Deal sheet 📄 Offer letter ✓ Due diligence
Listing remarks MLS
Back on market—buyer unable to secure financing. This is not FHA approved due to the high rate of rentals vs owners. Cash offers , Townhouse needs a little TLC , Near Andrews Air Force Base - just off 495 - near Branch Ave metro, Metro bus stops just steps away. Restaurants, retail, and hotels nearby as well. credit for full price and above.
Key facts
- $183 HOA
- Built 1966
- Listed 93 days
Neighborhood map
What this means for you Summary
Snapshot
- This is a 3-bed/1.5-bath condo listed at $240k.
Deal economics
- At list price, monthly cash flow is $348 ($4k/yr) — positive.
- The deal already cash-flows at list — no discount required.
- Meets the 1% rule at list price ($3k rent vs $240k).
- Recommended offer: $218k (9.0% below list) — sets the bar for market timing.
- Cap rate 8.0% vs local median 4.0% in Camp Springs — top-decile yield for the area; either an underpriced asset or a hidden risk that comps aren't pricing in. Stress-test before assuming the spread holds.
Location & tenants
- Location reads 62/100 on livability (#319 in MD) — a middle-class / working-renter tenant base. Strengths: employment A+, housing A+; Watch: crime D, amenities F, commute F.
- Prince George'S County Public Schools (suburban): math 8% / reading 24% proficiency, ranked #21 of 24 in MD (top 88%) — low school quality limits family demand, transient renter base, plan for 1-2y turnover.
- Market conditions: Rents soft (-1.2%/yr); 95 active listings in the ZIP; 11 comparable units currently listed for rent nearby; rentals leasing fast (median 13d on market — plan ~1-2 weeks tenant-placement turnaround); solid renter incomes; 1,481 units permitted in Prince George's County in 2024 (0 in 5+ unit buildings).
- This rent runs 43% of the median local income ($79k/yr) — at the standard rent-burdened threshold; future hikes will face affordability resistance.
Forward outlook
- Local home prices are declining (-3.0%/yr); year-one equity from $2k of loan paydown is wiped out by about $7k of value loss. Plan a longer hold.
- Prince George's County population projected at +18% by 2050 — long-run rental-demand tailwind backs the buy-and-hold thesis.
Negotiation context
- It's been on market 93 days — a 9% lower offer ($218k) is reasonable based on typical stale-listing flexibility.
- 2 sale attempts with the ask held roughly flat each time — persistent listings suggest the price (not the market) is what's stuck; bring a comps-based counter.
- Current owner paid $100k; list at $240k implies a 140% gain — meaningful room to come down on a strong offer.
Risks & watch-outs
- Climate carrying-cost: extreme-heat days projected 7→16/yr by 2055 (HVAC capex compounding) — expect insurance premiums to compound above CPI over the hold.
Questions for the listing agent
- It's been on market 93 days. Have you received any prior offers? Is the seller open to a 9% concession, seller financing, or rate buy-down credit?
- Built in 1966 — when were the roof, HVAC, electrical panel, plumbing, and water heater last replaced?
- What does the HOA fee cover, when was the last increase, and are there any pending special assessments or reserve-fund shortfalls?
- Any open or pending special assessments — roof, HVAC, plumbing, elevator, façade? What's the per-unit balance and payoff schedule, and is the seller paying it off at close or rolling it to the buyer?
- Why hasn't it sold? Are there any deal-killer items the seller is aware of (foundation, flood, title, zoning, code violations)?
- Is there a deadline driving the sale (1031 exchange, divorce, estate, relocation)? That informs how much negotiation room exists.
- Schools are B-rated — typically a magnet for longer-tenancy family renters. What's the average tenant stay here, and is there a school-zone premium baked into asking?
- Crime grade is D in this area — have there been break-ins, vandalism, or insurance claims at this property in the last 3 years? What carrier currently insures it and at what premium?
- What's the average days-on-market for RENTAL listings here right now (not sales)? A rising rental-DOM trend means longer vacancies and softer asking-rent achievability than the comps imply.
- What's the recent tenant-quality profile in this submarket — average credit score on applications, eviction rate, late-payment / NSF rate, and stable-employment percentage? A property-management company in the area should have these aggregated.
- How much new apartment / multifamily construction is in the pipeline within 1–3 miles? Heavy new supply (>2% of stock underway) typically softens rents 12–24 months out; light construction supports rent growth.
Investment metrics
- 1% rule
- 1.17% ✓
- Cap rate
- 8.03%
- Cash-on-cash
- 6.22%
- DSCR
- 1.28
- GRM
- 7.1
CMA / ARV
- ARV (median comp)
- $293,621
- List price
- $240,000
- Delta
- -18.26%
- Verdict
- UNDERPRICED
- Comps
- 20 within 1.0 mi
Projected returns pro-forma
-3.0% appreciation · 0.0% rent growth · sell at horizon
- IRR
- -10.5%
- Equity multiple
- 0.63×
- Total profit
- $-24,772
- Equity at exit
- $35,785
- IRR
- -6.6%
- Equity multiple
- 0.64×
- Total profit
- $-24,154
- Equity at exit
- $20,751
Cash invested: $67,200 (down + closing). Projections, not guarantees.
Landlord ↔ Tenant lean methodology
- Overall (STATE)
- 27 Tenant-Leaning
- State Maryland
- 27 Tenant-Leaning · D+14
- County
- — inherits STATE
- City
- — inherits STATE
ZIP-level market 20746
- Home prices YoY
- -15.7%
- Rents YoY
- -1.2%
- Active inventory
- 95
- Price-to-rent
- 7.1×
Monthly cashflow live
- Estimated rent
- $2,814 high interval (Pro) →
- Mortgage (P&I)
- −$1,259
- Tax from tax record
- −$333 /mo · $3,992/yr
- Insurance
- −$100
- HOA
- −$183
- Vacancy / Maint / Mgmt
- −$591
- Net cashflow
- $348
Break-even live
UW: 25.0% down · 7.5% · 30yr · 1.5% tax · 5.0% vac · 8.0% maint · 8.0% mgmt
Financing live
Cash to close
- Down payment
- $60,000
- Closing costs
- $7,200
- Reserves months
- —
- Total cash needed
- —
Loan-product check · same deal, 3 products live
Conventional
25% down · 7.5% · 30yr
- Down + closing
- —
- Monthly P&I
- —
- Monthly cashflow
- —
- DSCR
- —
- Eligible?
- —
Personal DTI + credit; lowest rate.
DSCR
20% down · 8.5% · 30yr
- Down + closing
- —
- Monthly P&I
- —
- Monthly cashflow
- —
- DSCR
- —
- Eligible?
- —
No personal income docs; deal must DSCR.
Hard money
10% down · 12.0% · 12mo
- Down + closing
- —
- Monthly P&I
- —
- Monthly cashflow
- —
- DSCR
- —
- Eligible?
- —
Short-term bridge; refi at stabilization.
Rent comps 11 comps
| Address | Beds | Baths | Sqft | Rent | $/sqft | DOM | Units | Dist |
|---|---|---|---|---|---|---|---|---|
| 4901 Braymer Ave Suitland, MD | 4.0 | 2.5 | 1684 | $2,899 | $1.72 | 12d | 1 | 0.32mi |
| 4701 Old Soper Rd Camp Springs, MD | 1.0–3.0 | 1.0–2.0 | 1300 | $3,158 | $2.43 | 2d | 18 | 0.55mi |
| 4400 Telfair Blvd Suitland, MD | 1.0–3.0 | 1.0–2.0 | 1157 | $2,949 | $2.55 | 4d | 12 | 0.77mi |
| 5925 Allentown Andrews Dr Suitland, MD | 3.0 | 2.5 | 2400 | $3,662 | $1.53 | 5d | 9 | 0.80mi |
| 4411 Reamy Dr Suitland, MD | 4.0 | 3.0 | 1248 | $2,750 | $2.20 | 18d | 1 | 0.87mi |
| 5546 Capital Gateway Dr #396 Suitland, MD | 3.0 | 2.5 | 2154 | $3,100 | $1.44 | 24d | 1 | 0.87mi |
| 4324 Talmadge Cir Suitland, MD | 3.0 | 2.5 | 1384 | $3,300 | $2.38 | 5d | 1 | 0.94mi |
| 5901 Middleton Ln Temple Hills, MD | 4.0 | 1.0 | 1260 | $2,800 | $2.22 | 43d | 1 | 1.08mi |
| 6526 Beechwood Dr #14 Temple Hills, MD | 3.0 | 1.5 | 2100 | $2,500 | $1.19 | 24d | 1 | 1.31mi |
| 5635 Regency Park Ct Hillcrest Heights, MD | 1.0–4.0 | 1.0–2.0 | 1177 | $1,875 | $1.59 | 1d | 28 | 1.34mi |
| 3616 Community Dr District Heights, MD | 4.0 | 2.5 | 1600 | $2,550 | $1.59 | 12d | 1 | 1.49mi |
HOA detail condo
- Monthly dues
- $183 · $2,196/yr
- Assessments
- None detected in remarks — confirm with the listing agent.
Listing history 22 events
-
2026-06-18days on market $240,000 Active 93 DOM
-
2026-06-17days on market $240,000 Active 92 DOM
-
2026-06-16days on market $240,000 Active 91 DOM
-
2026-06-15days on market $240,000 Active 90 DOM
-
2026-06-13days on market $240,000 Active 88 DOM
-
2026-06-10days on market $240,000 Active 84 DOM
-
2026-06-08days on market $240,000 Active 83 DOM
-
2026-06-07days on market $240,000 Active 82 DOM
-
2026-06-04days on market $240,000 Active 79 DOM
-
2026-06-03days on market $240,000 Active 78 DOM
-
2026-06-02days on market $240,000 Active 77 DOM
-
2026-06-01days on market $240,000 Active 76 DOM
-
2026-05-31days on market $240,000 Active 75 DOM
-
2026-04-29status Active 349-char remark
Show marketing remark (349 chars)
Back on market—buyer unable to secure financing. This is not FHA approved due to the high rate of rentals vs owners. Cash offers , Townhouse needs a little TLC , Near Andrews Air Force Base - just off 495 - near Branch Ave metro, Metro bus stops just steps away. Restaurants, retail, and hotels nearby as well. credit for full price and above.
-
2026-03-01status Pending 349-char remark
Show marketing remark (349 chars)
Back on market—buyer unable to secure financing. This is not FHA approved due to the high rate of rentals vs owners. Cash offers , Townhouse needs a little TLC , Near Andrews Air Force Base - just off 495 - near Branch Ave metro, Metro bus stops just steps away. Restaurants, retail, and hotels nearby as well. credit for full price and above.
-
2026-01-18$250,000 Active 349-char remark
Show marketing remark (349 chars)
Back on market—buyer unable to secure financing. This is not FHA approved due to the high rate of rentals vs owners. Cash offers , Townhouse needs a little TLC , Near Andrews Air Force Base - just off 495 - near Branch Ave metro, Metro bus stops just steps away. Restaurants, retail, and hotels nearby as well. credit for full price and above.
-
2026-01-05historical $250,000 349-char remark
Show marketing remark (349 chars)
Back on market—buyer unable to secure financing. This is not FHA approved due to the high rate of rentals vs owners. Cash offers , Townhouse needs a little TLC , Near Andrews Air Force Base - just off 495 - near Branch Ave metro, Metro bus stops just steps away. Restaurants, retail, and hotels nearby as well. credit for full price and above.
-
2022-08-09historical
-
2022-08-03historical
-
1999-11-12soldstatus $100,000
-
1999-11-04soldstatus $55,893
-
1986-07-22soldstatus $35,000
ⓘ Source: listings_history table (triggers on properties + properties_extension) + one-shot
backfill from property_details.listing_events for pre-trigger history.
Tax reassessment forecast MD · Partial reset (capped growth)
- Current annual tax
- $3,992 · $333/mo
- Projected year-2 tax
- $3,992 · $333/mo
- Expected delta
- $0/yr ($0/mo · 0.0%)
ⓘ Screening estimate from a state-policy table — verify with the county assessor before closing.
Climate risk First Street
- Flood 1/10 Low FEMA zone X (unshaded) · 0% chance over 30 yrs
- Wildfire 1/10 Low
- Heat 7/10 Severe 7 d/yr ≥103°F today · 16 d/yr by 30 yrs out
- Wind 4/10 Moderate 23% chance of damaging wind over 30 yrs
- Air quality 3/10 Moderate 2 unhealthy d/yr today · 3 by 30 yrs out
Nearby sold comps map
Loading sold comps map…
Walkable amenities ~0.75 mi
Loading nearby amenities…
Taxation est. · year 1
- Rental income
- $33,762
- − Mortgage interest
- −$13,444
- − Property taxes
- −$3,992
- − Insurance
- −$1,200
- − Repairs & maintenance
- −$2,701
- − Management
- −$2,701
- − HOA
- −$2,196
- − Depreciation
- −$6,982
- Taxable income
- $546
- Est. tax owed @ 24.0%
- −$131
- After-tax cash flow
- $4,049/yr
For passive investors: Depreciation is non-cash, so a rental often shows a tax loss while cash-flowing — sheltering income. Rental losses are passive: they offset passive income freely, and up to $25,000/yr can offset ordinary (W-2) income if you actively participate and your MAGI is under $100k (phasing out to $0 by $150k); unused losses carry forward. On sale, claimed depreciation is recaptured at up to 25%, and gains may owe capital-gains tax (a 1031 exchange can defer both). Figures are a year-1 estimate at your 24.0% rate — not tax advice; consult a CPA.
Schools (NCES district)
- District
- Prince George'S County Public Schools
- NCES district ID
- 2400510
- Math proficiency
- 8% ▼ -11.00%
- Reading proficiency
- 24% ▼ -9.00%
- Median HH income
- $73,967
- Composite
- 16.82/100
- National rank
- #9151
- State rank
- #21 of 24 in MD
Livability — Camp Springs
- Score
- 62/100
- State rank
- #319
- US rank
- #16641
Category grades
Schools grade is shown separately in the Schools card above.
Census & demographics
- Census place
- Camp Springs, MD
- County
- Prince Georges County · 919,866 people
- Metro
- Washington-Arlington-Alexandria, DC-VA-MD-WV
- Population (ZIP)
- 27,156
- Household income
- $79,330
- Rent vs Own
- Severe rent burden
- 1879.0
Population outlook (Prince George's County) Hauer SSP2
- Today (2025)
- 1,005,426 people
- By 2030
- 1,048,416 · +4.3%
- By 2040
- 1,123,425 · +11.7%
- By 2050
- 1,183,220 · +17.7%
- By 2075
- 1,306,202 · +29.9%
- By 2100
- 1,408,179 · +40.1%
Race, ethnicity, and origin ACS 2023
- Neighborhood character
- Predominantly Black (85%)
- Race & ethnicity
- Black 85% White 5% Hispanic / Latino 5% Two or more races 5%
- Foreign-born
- 8% · Canada, United Kingdom, Guatemala
- Languages at home
- 90% English-only · Spanish 4% French/Haitian/Cajun 1%
Political lean MEDSL · Prince George's
- 2024 margin
- Solid D (+75.2) · D 86.3% · R 11.2% · Other 2.5%
- 2008→2024 swing
- -3.3pp toward R · 2008: 78.5pp · 2024: 75.2pp
- All cycles
- 2024: D+75.2 2020: D+80.5 2016: D+81.0 2012: D+80.9 2008: D+78.5
Not yet ingested
- Civics
- —
Market trends
- HPI YoY
- ▼ -52.82%
- Current HPI
- 284.5911
- Rent YoY
- ▼ -1.24%
- Metro
- Washington-Arlington-Alexandria, DC-VA-MD-WV
- State GDP YoY
- ▲ 2.97%
- F500 in state
- 12
Industry mix (Fortune 500 HQ in MD)
| Industry | F500 HQs | Revenue |
|---|---|---|
| Aerospace / Defense | 1 | $71B |
|
||
| Utilities | 1 | $25B |
|
||
| Hotels | 1 | $24B |
|
||
| Consumer Goods | 1 | $7B |
|
||
| Real Estate | 1 | $6B |
|
||
| Chemicals | 1 | $2B |
|
||
Price history
+614.3% since first listed9 events — show timeline
- 2026-04-29 Relisted — BRIGHT MLS
- 2026-03-01 Pending — BRIGHT MLS
- 2026-01-18 Listed $250,000 BRIGHT MLS
- 2026-01-05 Coming Soon $250,000 BRIGHT MLS
- 2022-08-09 Listing Removed — BRIGHT MLS
- 2022-08-03 Coming Soon — BRIGHT MLS
- 1999-11-12 Sold (Public Records) $100,000 Public Records
- 1999-11-04 Sold (Public Records) $55,893 Public Records
- 1986-07-22 Sold (Public Records) $35,000 Public Records
Property tax history
+7.7%/yrLatest (2025): $3,992 · +11.5% YoY. Source: county tax records.
Cash-flow waterfall
monthlySold comps — $/sqft
last 12 mo · ≤1 miLoading sold comps…