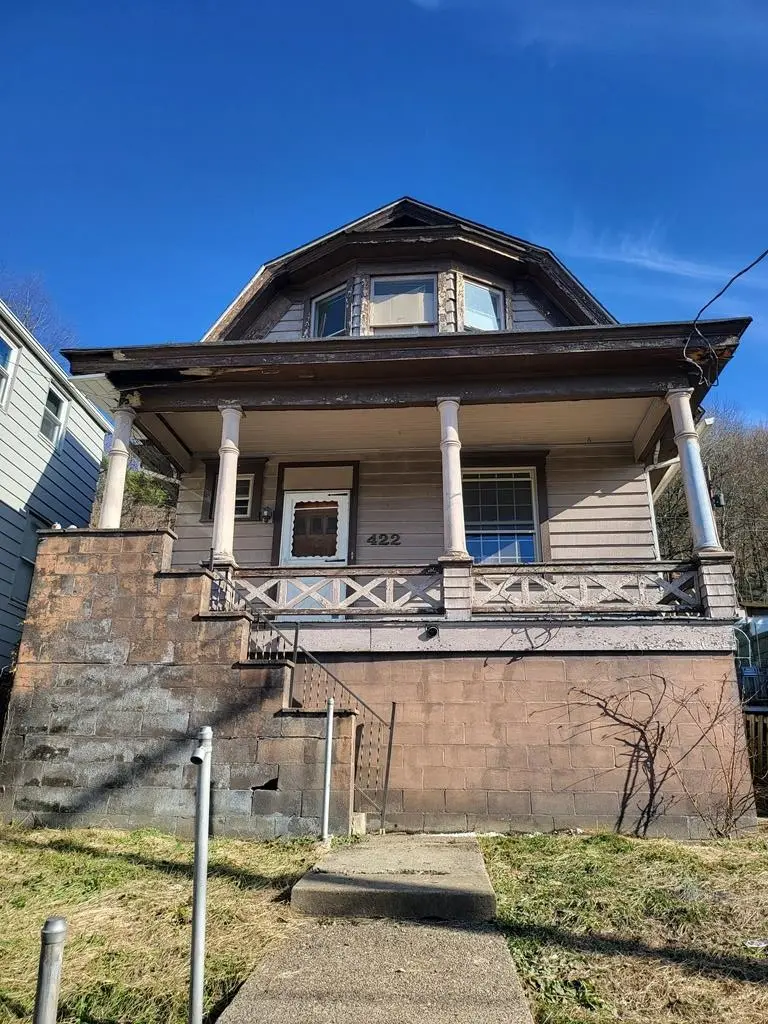
422 Warwood Ave · Wheeling, WV
Flood risk 8/10 · Major
- FEMA flood zone
- X (unshaded)
- Chance of flooding over 30 yrs
- 0.98%
- Est. flood insurance / yr
- $473 – $860
Fire risk 1/10 · Minimal
- Est. fire insurance / yr
- $787 – $1,461
Heat risk 3/10 · Minor
- Hot days now (above 97°F)
- 7 days/yr
- Hot days in 30 yrs
- 19 days/yr
Wind risk 1/10 · Minimal
- Chance of severe wind over 30 yrs
- —
Air-quality risk 2/10 · Minimal
- Unhealthy air days now
- 1 days/yr
- Unhealthy air days in 30 yrs
- 2 days/yr
Risk factors via First Street. Map © Google.
Why this score? — see what drove the B- grade
The composite is a weighted blend of 9 inputs, each scored 0–100. Each bar is that input's sub-score; the figure is the points it added to the 100-point composite (weight × sub-score).
- Cash flow +30.0/30.0
- DSCR +10.0/10.0
- 1% rule +9.7/10.0
- ARV discount +7.5/15.0
- Schools +3.5/10.0
- Livability +3.5/5.0
- Rent growth +3.3/5.0
- Condition / age +2.5/5.0
- Appreciation +0.0/10.0
$60,000
🖨 Deal sheet 📄 Offer letter ✓ Due diligence
Listing remarks MLS
Great starter home or investment property. All new windows and sliding glass doors on first floor. Fresh paint throughout. 200 amp service. newer furnace and hot water tank. Priced Right.
Key facts
- Fenced in home
- New flooring
- Back deck
Tags
Property features AI
Exterior
- Utilities: Public water; Public sewer
- Home design: Single-family residence; Contemporary style; One story
- Construction: Wood siding construction
- Exterior features: Deck; Patio; Shingle roof
Interior
- Flooring: Hardwood floors
- Bathrooms: 1 full bathroom
- Heating & cooling: Forced air heating; Central air; Ceiling fans
- Interior features: Gas water heater; Partial basement
Neighborhood map
What this means for you Summary
Snapshot
- This is a 2-bed/1.0-bath single-family listed at $60k.
Deal economics
- At list price, monthly cash flow is $226 ($3k/yr) — positive.
- The deal already cash-flows at list — no discount required.
- Meets the 1% rule at list price ($882 rent vs $60k).
- Recommended offer: $58k (3.0% below list) — sets the bar for market timing.
- Cap rate 11.9% vs local median 4.3% in Wheeling — top-decile yield for the area; either an underpriced asset or a hidden risk that comps aren't pricing in. Stress-test before assuming the spread holds.
Location & tenants
- Location reads 69/100 on livability (#74 in WV) — a middle-class / working-renter tenant base. Strengths: cost of living A+, housing A+, health & safety A-; Watch: crime F, amenities F, commute F.
- Ohio County Schools (urban): math 34% / reading 49% proficiency, ranked #5 of 55 in WV (top 9%) — families likely to look elsewhere, expect single-tenant / working-renter base with shorter leases.
- Market conditions: Rents rising (+3.0%/yr); 223 active listings in the ZIP; 2 units permitted in Ohio County in 2024 (0 in 5+ unit buildings).
Forward outlook
- Local home prices are declining (-3.0%/yr); year-one equity from $415 of loan paydown is wiped out by about $2k of value loss. Plan a longer hold.
- Ohio County population projected at -17% by 2050 — secular population decline; favor cash flow + early exit over multi-decade hold.
- At projected returns (-3.0% appreciation + 3.0% rent growth), your $17k cash investment doubles in ~8 years — after that, you're playing with house money.
Negotiation context
- It's been on market 56 days — a 3% lower offer ($58k) is reasonable based on typical stale-listing flexibility.
- 2 sale attempts since 17y ago with the ask held roughly flat each time — persistent listings suggest the price (not the market) is what's stuck; bring a comps-based counter.
- Current owner paid $34k; list at $60k implies a 76% gain — meaningful room to come down on a strong offer.
Risks & watch-outs
- Watch-outs: flood insurance adds $56/mo; built in 1915 — expect roof / HVAC / electrical / plumbing capex.
- Climate carrying-cost: severe flood risk — expect insurance premiums to compound above CPI over the hold.
Questions for the listing agent
- It's been on market 56 days. Have you received any prior offers? Is the seller open to a 3% concession, seller financing, or rate buy-down credit?
- Built in 1915 — when were the roof, HVAC, electrical panel, plumbing, and water heater last replaced?
- What's the actual annual flood-insurance premium (NFIP or private), and is the property in a SFHA with mandatory coverage?
- Is there a deadline driving the sale (1031 exchange, divorce, estate, relocation)? That informs how much negotiation room exists.
- Schools are B-rated — typically a magnet for longer-tenancy family renters. What's the average tenant stay here, and is there a school-zone premium baked into asking?
- Crime grade is F in this area — have there been break-ins, vandalism, or insurance claims at this property in the last 3 years? What carrier currently insures it and at what premium?
- What's the average days-on-market for RENTAL listings here right now (not sales)? A rising rental-DOM trend means longer vacancies and softer asking-rent achievability than the comps imply.
- What's the recent tenant-quality profile in this submarket — average credit score on applications, eviction rate, late-payment / NSF rate, and stable-employment percentage? A property-management company in the area should have these aggregated.
- How much new for-sale + rental construction is in the pipeline within 1–3 miles? Heavy new supply typically softens prices + rents 12–24 months out; constrained supply supports both.
Investment metrics
- 1% rule
- 1.47% ✓
- Cap rate
- 11.93%
- Cash-on-cash
- 20.13%
- DSCR
- 1.90
- GRM
- 5.7
CMA / ARV
- ARV (median comp)
- $128,066
- List price
- $60,000
- Delta
- -53.15%
- Verdict
- UNDERPRICED
- Comps
- 20 within 1.0 mi
Show comp detail 7 sales within ~0.75 mi
| Address | Dist | Beds/Ba | Sqft | Sold | Price | $/sf | Match |
|---|---|---|---|---|---|---|---|
| 438 Warwood Ave | 0.04mi | 2/1.0 | 1,008 (+4%) | 0mo | $126,000 | $125 | 91 |
| 415 Richland Ave | 0.08mi | 2/1.0 | 1,023 (+6%) | 5mo | $135,000 | $132 | 83 |
| 414 Warwood Ave | 0.02mi | 3/1.5 (+1) | 980 (+1%) | 11mo | $95,000 | $97 | 81 |
| 121 North 10th St | 0.39mi | 3/1.0 (+1) | 1,008 (+4%) | 14mo | $25,000 | $25 | 58 |
| 330 Richland Ave | 0.12mi | 2/1.0 | 1,094 (+13%) | 20mo | $128,000 | $117 | 56 |
| 605 Jeanette Ave | 0.63mi | 2/2.0 | 1,065 (+10%) | 9mo | $60,000 | $56 | 42 |
| 1313 N 7th St | 0.69mi | 3/2.0 (+1) | 864 (-11%) | 11mo | $115,000 | $133 | 31 |
Match score weights: distance 35% · size 25% · config 20% · recency 20%. Top-matched comps best support the ARV.
Projected returns pro-forma
-3.0% appreciation · 3.03% rent growth · sell at horizon
- IRR
- 7.2%
- Equity multiple
- 1.28×
- Total profit
- $4,760
- Equity at exit
- $8,946
- IRR
- 16.6%
- Equity multiple
- 2.37×
- Total profit
- $23,000
- Equity at exit
- $5,188
Cash invested: $16,800 (down + closing). Projections, not guarantees.
Landlord ↔ Tenant lean methodology
- Overall (STATE)
- 83 Strongly Landlord-Friendly
- State West Virginia
- 83 Strongly Landlord-Friendly · R+22
- County
- — inherits STATE
- City
- — inherits STATE
ZIP-level market 26003
- Home prices YoY
- -23.4%
- Rents YoY
- 3.0%
- Active inventory
- 223
- Price-to-rent
- 5.7×
Monthly cashflow live
- Estimated rent
- $882 medium interval (Pro) →
- Mortgage (P&I)
- −$315
- Tax est. 1.5%
- −$75 /mo · $900/yr
- Insurance
- −$25
- Flood insurance flood zone
- −$56 /mo · $666/yr
- HOA
- −$0
- Vacancy / Maint / Mgmt
- −$185
- Net cashflow
- $226
Break-even live
UW: 25.0% down · 7.5% · 30yr · 1.5% tax · 5.0% vac · 8.0% maint · 8.0% mgmt
Financing live
Cash to close
- Down payment
- $15,000
- Closing costs
- $1,800
- Reserves months
- —
- Total cash needed
- —
Loan-product check · same deal, 3 products live
Conventional
25% down · 7.5% · 30yr
- Down + closing
- —
- Monthly P&I
- —
- Monthly cashflow
- —
- DSCR
- —
- Eligible?
- —
Personal DTI + credit; lowest rate.
DSCR
20% down · 8.5% · 30yr
- Down + closing
- —
- Monthly P&I
- —
- Monthly cashflow
- —
- DSCR
- —
- Eligible?
- —
No personal income docs; deal must DSCR.
Hard money
10% down · 12.0% · 12mo
- Down + closing
- —
- Monthly P&I
- —
- Monthly cashflow
- —
- DSCR
- —
- Eligible?
- —
Short-term bridge; refi at stabilization.
Listing history 22 events
-
2026-06-19days on market $60,000 Active 56 DOM
-
2026-06-18days on market $60,000 Active 55 DOM
-
2026-06-17days on market $60,000 Active 54 DOM
-
2026-06-16days on market $60,000 Active 53 DOM
-
2026-06-15days on market $60,000 Active 52 DOM
-
2026-06-14days on market $60,000 Active 50 DOM
-
2026-06-12days on market $60,000 Active 49 DOM
-
2026-06-09days on market $60,000 Active 46 DOM
-
2026-06-08days on market $60,000 Active 45 DOM
-
2026-06-07days on market $60,000 Active 44 DOM
-
2026-06-05days on market $60,000 Active 41 DOM
-
2026-06-03days on market $60,000 Active 40 DOM
-
2026-06-02days on market $60,000 Active 39 DOM
-
2026-06-01days on market $60,000 Active 38 DOM
-
2026-05-31days on market $60,000 Active 37 DOM
-
2026-05-30days on market $60,000 Active 36 DOM
-
2026-04-24$60,000 Active 196-char remark
-
2023-02-03soldstatus $34,173
-
2021-06-03soldstatus $1,022,600
-
2010-02-26soldstatus $18,000 187-char remark
Show marketing remark (187 chars)
Great starter home or investment property. All new windows and sliding glass doors on first floor. Fresh paint throughout. 200 amp service. newer furnace and hot water tank. Priced Right.
-
2009-08-03$19,900 187-char remark
Show marketing remark (187 chars)
Great starter home or investment property. All new windows and sliding glass doors on first floor. Fresh paint throughout. 200 amp service. newer furnace and hot water tank. Priced Right.
-
1989-10-11soldstatus $15,000
ⓘ Source: listings_history table (triggers on properties + properties_extension) + one-shot
backfill from property_details.listing_events for pre-trigger history.
Climate risk First Street
- Flood 8/10 Severe FEMA zone X (unshaded) · 98% chance over 30 yrs
- Wildfire 1/10 Low
- Heat 3/10 Moderate 7 d/yr ≥97°F today · 19 d/yr by 30 yrs out
- Wind 1/10 Low
- Air quality 2/10 Low 1 unhealthy d/yr today · 2 by 30 yrs out
Nearby sold comps map
Loading sold comps map…
Walkable amenities ~0.75 mi
Loading nearby amenities…
Taxation est. · year 1
- Rental income
- $10,578
- − Mortgage interest
- −$3,361
- − Property taxes
- −$900
- − Insurance
- −$966
- − Repairs & maintenance
- −$846
- − Management
- −$846
- − Depreciation
- −$1,745
- Taxable income
- $1,913
- Est. tax owed @ 24.0%
- −$459
- After-tax cash flow
- $2,256/yr
For passive investors: Depreciation is non-cash, so a rental often shows a tax loss while cash-flowing — sheltering income. Rental losses are passive: they offset passive income freely, and up to $25,000/yr can offset ordinary (W-2) income if you actively participate and your MAGI is under $100k (phasing out to $0 by $150k); unused losses carry forward. On sale, claimed depreciation is recaptured at up to 25%, and gains may owe capital-gains tax (a 1031 exchange can defer both). Figures are a year-1 estimate at your 24.0% rate — not tax advice; consult a CPA.
Schools (NCES district)
- District
- Ohio County Schools
- NCES district ID
- 5401050
- Math proficiency
- 34% ▼ -9.00%
- Reading proficiency
- 49% ▼ -6.00%
- Median HH income
- $41,572
- Composite
- 34.88/100
- National rank
- #5085
- State rank
- #5 of 55 in WV
Livability — Wheeling
- Score
- 69/100
- State rank
- #74
- US rank
- #8950
Category grades
Schools grade is shown separately in the Schools card above.
Census & demographics
- Census place
- Wheeling, WV
- County
- Ohio County · 39,982 people
- City population
- 39,982
- Metro
- Wheeling, WV-OH
- Population (ZIP)
- 39,982
- Household income
- $57,703
- Rent vs Own
- Severe rent burden
- 1630.0
Population outlook (Ohio County) Hauer SSP2
- Today (2025)
- 40,604 people
- By 2030
- 39,150 · -3.6%
- By 2040
- 36,039 · -11.2%
- By 2050
- 33,582 · -17.3%
- By 2075
- 28,662 · -29.4%
- By 2100
- 22,963 · -43.4%
Race, ethnicity, and origin ACS 2023
- Neighborhood character
- Predominantly White (90%)
- Race & ethnicity
- White 90% Two or more races 6% Black 3% Hispanic / Latino 2%
- Common ancestry
- Romanian 6% Serbian 3% Slovak 2%
- Foreign-born
- 3% · Canada
- Languages at home
- 97% English-only · Other Indo-European 1% Spanish 1% German/W. Germanic 1%
Political lean MEDSL · Ohio
- 2024 margin
- Strong R (+26.0) · D 36.0% · R 62.0% · Other 2.0%
- 2008→2024 swing
- -15.3pp toward R · 2008: -10.8pp · 2024: -26.0pp
- All cycles
- 2024: R+26.0 2020: R+25.8 2016: R+31.6 2012: R+22.5 2008: R+10.8
Not yet ingested
- Civics
- —
Market trends
- HPI YoY
- ▼ -68.09%
- Current HPI
- 223.4106
- Rent YoY
- ▲ 3.03%
- Metro
- Wheeling, WV-OH
- State GDP YoY
- —
- F500 in state
- 0
Price history
+300.0% since first listed6 events — show timeline
- 2026-04-24 Listed $60,000 WBOR
- 2023-02-03 Sold (Public Records) $34,173 Public Records
- 2021-06-03 Sold (Public Records) $1,022,600 Public Records
- 2010-02-26 Sold (MLS) $18,000 WBOR
- 2009-08-03 Listed $19,900 WBOR
- 1989-10-11 Sold (Public Records) $15,000 Public Records
Property tax history
-12.4%/yrLatest (2025): $74 · +21.2% YoY. Source: county tax records.
Cash-flow waterfall
monthlySold comps — $/sqft
last 12 mo · ≤1 miLoading sold comps…