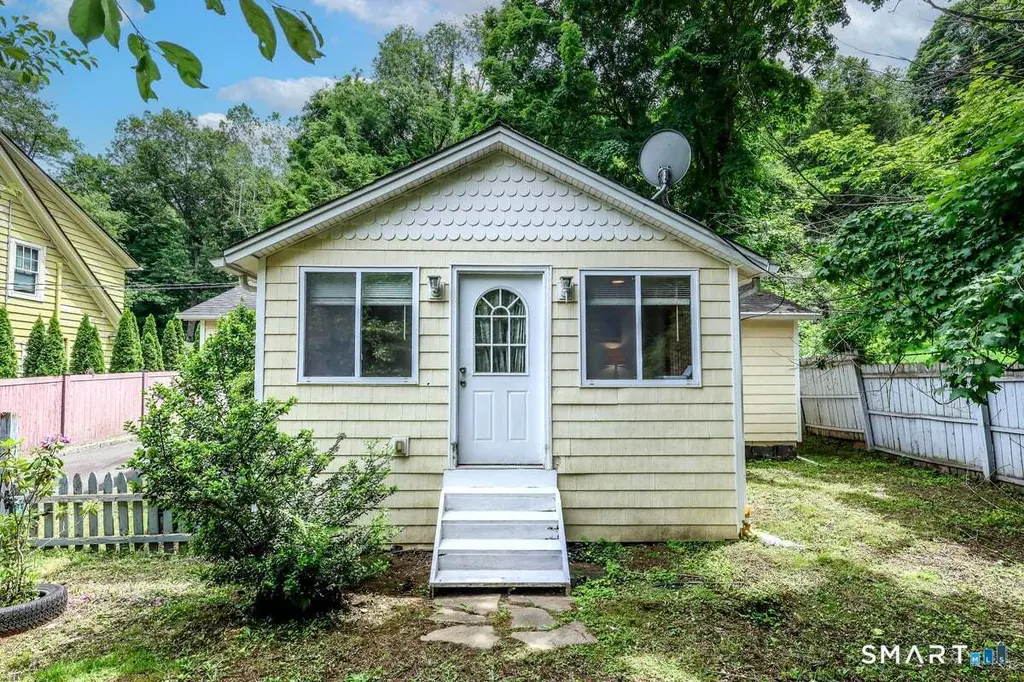
70 Dodgingtown Rd · Bethel, CT
Flood risk 1/10 · Minimal
- FEMA flood zone
- X (unshaded)
- Chance of flooding over 30 yrs
- 0.0%
- Est. flood insurance / yr
- $473 – $860
Fire risk 3/10 · Minor
- Est. fire insurance / yr
- $829 – $1,539
Heat risk 4/10 · Minor
- Hot days now (above 99°F)
- 7 days/yr
- Hot days in 30 yrs
- 15 days/yr
Wind risk 5/10 · Moderate
- Chance of severe wind over 30 yrs
- 23.0%
Air-quality risk 4/10 · Minor
- Unhealthy air days now
- 3 days/yr
- Unhealthy air days in 30 yrs
- 5 days/yr
Risk factors via First Street. Map © Google.
Why this score? — see what drove the D grade
The composite is a weighted blend of 9 inputs, each scored 0–100. Each bar is that input's sub-score; the figure is the points it added to the 100-point composite (weight × sub-score).
- Cash flow +12.7/30.0
- ARV discount +7.5/15.0
- Schools +4.7/10.0
- Livability +4.1/5.0
- DSCR +3.8/10.0
- 1% rule +3.4/10.0
- Rent growth +2.5/5.0
- Condition / age +2.5/5.0
- Appreciation +0.0/10.0
$425,000
🖨 Deal sheet 📄 Offer letter ✓ Due diligence
Listing remarks MLS
Adorable 3 Bed 2 Full Bath Ranch. No Worries! New Septic, Driveway Plus Many Newer Updates. Not A Driveby.Move In Condition. 1 St Time Buyers Dream. 1 Year Home Warranty. Don't Miss This One.
Key facts
- Wood flooring
- Vinyl flooring
- Welcoming foyer
Tags
Property features AI
Exterior
- Parking: Detached garage; 2-car garage
- Utilities: Private well water; Septic sewage system; Natural gas hot water (domestic)
- Home design: Single-family home; Yellow exterior color
- Construction: Frame construction; Vinyl and aluminum siding; Asphalt shingle roof; Concrete foundation
- Exterior features: Gutters; Exterior lighting; Treed, sloping lot
Interior
- Kitchen: Gas cooktop; Oven/range; Microwave; Refrigerator
- Bedrooms: 3 bedrooms
- Bathrooms: 2 full bathrooms
- Heating & cooling: Hot water heat; Natural gas heating; Central air
- Interior features: Central air conditioning; Crawl space foundation (basement described as crawl space); 5 total rooms
- Laundry & utility: Washer; Electric dryer; Main level laundry
Neighborhood map
What this means for you Summary
Snapshot
- This is a 3-bed/2.0-bath single-family listed at $425k.
Deal economics
- At list price, monthly cash flow is $-46 ($-554/yr) — negative.
- To cash-flow at today's rent, offer at most $417k (1.9% below list).
- To meet the 1% rule (rent ≥ 1% of price), the offer needs to be $358k (15.7% below list).
- Recommended offer: $358k (15.7% below list) — sets the bar for 1% rule.
- Cap rate 6.2% vs local median 3.5% in Bethel — top-decile yield for the area; either an underpriced asset or a hidden risk that comps aren't pricing in. Stress-test before assuming the spread holds.
Location & tenants
- Location reads 82/100 on livability (#12 in CT, #1,287 nationally) — a professional / high-income tenant draw. Strengths: crime A+, commute A+, health & safety A+; Watch: amenities F, cost of living D-.
- Bethel School District (suburban): math 43% / reading 59% proficiency, ranked #72 of 153 in CT (top 47%) — acceptable for families but not a draw, mixed tenant base, ~2y average lease; only 14% free/reduced lunch — higher-income household profile.
- Market conditions: 75 active listings in the ZIP; 2 comparable units currently listed for rent nearby; 1,151 units permitted in Western Connecticut Planning Region in 2024 (714 in 5+ unit buildings).
Forward outlook
- Local home prices are declining (-3.0%/yr); year-one equity from $3k of loan paydown is wiped out by about $13k of value loss. Plan a longer hold.
Negotiation context
- Only 10 days on market — expect competitive offers; lowballing is unlikely to land.
- 4 sale attempts since 31y ago with the ask held roughly flat each time — persistent listings suggest the price (not the market) is what's stuck; bring a comps-based counter.
- Current owner paid $310k; 37% above their basis — modest negotiation headroom, anchor on the comps not their cost.
Risks & watch-outs
- Watch-outs: built in 1940 — expect roof / HVAC / electrical / plumbing capex.
- Climate carrying-cost: moderate wind risk, 23% chance of damaging wind over 30y — expect insurance premiums to compound above CPI over the hold.
Questions for the listing agent
- What do current leases actually rent for vs. the listed asking? Can we see a recent rent roll and the last 12 months of T-12 income?
- Built in 1940 — when were the roof, HVAC, electrical panel, plumbing, and water heater last replaced?
- Is there a deadline driving the sale (1031 exchange, divorce, estate, relocation)? That informs how much negotiation room exists.
- Schools are B-rated — typically a magnet for longer-tenancy family renters. What's the average tenant stay here, and is there a school-zone premium baked into asking?
- The area grade is low — what's the realistic commute time and amenity access for the typical tenant pool here? Any planned neighborhood developments (good or bad) we should know about?
- What's the average days-on-market for RENTAL listings here right now (not sales)? A rising rental-DOM trend means longer vacancies and softer asking-rent achievability than the comps imply.
- What's the recent tenant-quality profile in this submarket — average credit score on applications, eviction rate, late-payment / NSF rate, and stable-employment percentage? A property-management company in the area should have these aggregated.
- How much new for-sale + rental construction is in the pipeline within 1–3 miles? Heavy new supply typically softens prices + rents 12–24 months out; constrained supply supports both.
Investment metrics
- 1% rule
- 0.84% ✗
- Cap rate
- 6.16%
- Cash-on-cash
- -0.47%
- DSCR
- 0.98
- GRM
- 9.9
CMA / ARV
No comps found within radius.
Projected returns pro-forma
-3.0% appreciation · 3.0% rent growth · sell at horizon
- IRR
- -17.1%
- Equity multiple
- 0.40×
- Total profit
- $-71,790
- Equity at exit
- $63,369
- IRR
- -9.0%
- Equity multiple
- 0.44×
- Total profit
- $-66,232
- Equity at exit
- $36,746
Cash invested: $119,000 (down + closing). Projections, not guarantees.
Landlord ↔ Tenant lean methodology
- Overall (STATE)
- 27 Tenant-Leaning
- State Connecticut
- 27 Tenant-Leaning · D+7
- County
- — inherits STATE
- City
- — inherits STATE
ZIP-level market 06801
- Active inventory
- 75
- Price-to-rent
- 9.9×
Monthly cashflow live
- Estimated rent
- $3,581 medium interval (Pro) →
- Mortgage (P&I)
- −$2,229
- Tax from tax record
- −$470 /mo · $5,636/yr
- Insurance
- −$177
- HOA
- −$0
- Vacancy / Maint / Mgmt
- −$752
- Net cashflow
- $-46
Break-even live
UW: 25.0% down · 7.5% · 30yr · 1.5% tax · 5.0% vac · 8.0% maint · 8.0% mgmt
Financing live
Cash to close
- Down payment
- $106,250
- Closing costs
- $12,750
- Reserves months
- —
- Total cash needed
- —
Loan-product check · same deal, 3 products live
Conventional
25% down · 7.5% · 30yr
- Down + closing
- —
- Monthly P&I
- —
- Monthly cashflow
- —
- DSCR
- —
- Eligible?
- —
Personal DTI + credit; lowest rate.
DSCR
20% down · 8.5% · 30yr
- Down + closing
- —
- Monthly P&I
- —
- Monthly cashflow
- —
- DSCR
- —
- Eligible?
- —
No personal income docs; deal must DSCR.
Hard money
10% down · 12.0% · 12mo
- Down + closing
- —
- Monthly P&I
- —
- Monthly cashflow
- —
- DSCR
- —
- Eligible?
- —
Short-term bridge; refi at stabilization.
Rent comps 2 comps
| Address | Beds | Baths | Sqft | Rent | $/sqft | DOM | Units | Dist |
|---|---|---|---|---|---|---|---|---|
| 26 Greenwood Ave Bethel, CT | 3.0 | 2.0 | 1400 | $4,500 | $3.21 | 10d | 1 | 1.29mi |
| 2 Cindy Ln Unit 8-1 Bethel, CT | 2.0 | 1.0 | 819 | $2,500 | $3.05 | 3d | 1 | 1.41mi |
Listing history 8 events
-
2026-06-18days on market $425,000 Active 10 DOM
-
2026-06-17days on market $425,000 Active 9 DOM
-
2026-06-16days on market $425,000 Active 8 DOM
-
2026-06-15days on market $425,000 Active 7 DOM
-
2026-06-13days on market $425,000 Active 5 DOM
-
2026-06-10days on market $425,000 Active 2 DOM
-
2026-06-08remarks 699-char remark
-
2026-06-08$425,000 Active 1 DOM
ⓘ Source: listings_history table (triggers on properties + properties_extension) + one-shot
backfill from property_details.listing_events for pre-trigger history.
Tax reassessment forecast CT · Partial reset (capped growth)
- Current annual tax
- $5,636 · $470/mo
- Projected year-2 tax
- $7,366 · $614/mo
- Expected delta
- +$1,730/yr (+$144/mo · 30.7%)
ⓘ Screening estimate from a state-policy table — verify with the county assessor before closing.
Climate risk First Street
- Flood 1/10 Low FEMA zone X (unshaded) · 0% chance over 30 yrs
- Wildfire 3/10 Moderate
- Heat 4/10 Moderate 7 d/yr ≥99°F today · 15 d/yr by 30 yrs out
- Wind 5/10 Major 23% chance of damaging wind over 30 yrs
- Air quality 4/10 Moderate 3 unhealthy d/yr today · 5 by 30 yrs out
Nearby sold comps map
Loading sold comps map…
Walkable amenities ~0.75 mi
Loading nearby amenities…
Taxation est. · year 1
- Rental income
- $42,978
- − Mortgage interest
- −$23,807
- − Property taxes
- −$5,636
- − Insurance
- −$2,125
- − Repairs & maintenance
- −$3,438
- − Management
- −$3,438
- − Depreciation
- −$12,364
- Taxable loss
- −$7,830
- Est. tax savings @ 24.0%
- +$1,879
- After-tax cash flow
- $1,326/yr
For passive investors: Depreciation is non-cash, so a rental often shows a tax loss while cash-flowing — sheltering income. Rental losses are passive: they offset passive income freely, and up to $25,000/yr can offset ordinary (W-2) income if you actively participate and your MAGI is under $100k (phasing out to $0 by $150k); unused losses carry forward. On sale, claimed depreciation is recaptured at up to 25%, and gains may owe capital-gains tax (a 1031 exchange can defer both). Figures are a year-1 estimate at your 24.0% rate — not tax advice; consult a CPA.
Schools (NCES district)
- District
- Bethel School District
- NCES district ID
- 0900270
- Math proficiency
- 43% ▼ -14.00%
- Reading proficiency
- 59% ▼ -8.00%
- Median HH income
- $87,843
- Composite
- 47.17/100
- National rank
- #2323
- State rank
- #72 of 153 in CT
Livability — Bethel
- Score
- 82/100
- State rank
- #12
- US rank
- #1287
Category grades
Schools grade is shown separately in the Schools card above.
Census & demographics
- City population
- 20,498
- Population (ZIP)
- 20,498
Population outlook (Western Connecticut County) Hauer SSP2
- By 2040
- 685,031
Race, ethnicity, and origin ACS 2023
- Neighborhood character
- Diverse neighborhood (Simpson 0.55)
- Race & ethnicity
- White 65% Hispanic / Latino 14% Two or more races 11% Black 6% Asian 6%
- Hispanic origin (detail)
- Puerto Rican 4% Dominican 3%
- Common ancestry
- Estonian 6% Romanian 3% Italian 2%
- Foreign-born
- 21% · Canada, China, Jamaica
- Languages at home
- 74% English-only · Other Indo-European 10% Spanish 10% Other Asian/Pacific 2%
Political lean MEDSL · Western Connecticut
- 2024 margin
- D (+19.1) · D 58.8% · R 39.7% · Other 1.6%
- All cycles
- 2024: D+19.1
Not yet ingested
- Civics
- —
Market trends
- HPI YoY
- ▼ -348.18%
- Current HPI
- 234.4823
- Rent YoY
- —
- Metro
- —
- State GDP YoY
- ▲ 1.06%
- F500 in state
- 38
Industry mix (Fortune 500 HQ in CT)
| Industry | F500 HQs | Revenue |
|---|---|---|
| Industrial Machinery | 4 | $38B |
|
||
| Insurance | 3 | $71B |
|
||
| Financial Services | 2 | $25B |
|
||
| Transportation / Logistics | 2 | $18B |
|
||
| Healthcare | 1 | $247B |
|
||
| Telecommunications | 1 | $55B |
|
||
Price history
+240.0% since first listed10 events — show timeline
- 2026-06-08 Listed $425,000 Smart MLS
- 2007-10-04 Listing Removed — Smart MLS
- 2007-09-04 Sold (Public Records) $310,000 Public Records
- 2007-08-31 Sold (MLS) $310,000 Smart MLS
- 2007-07-17 Listed $309,900 Smart MLS
- 2006-10-04 Listed $279,900 Smart MLS
- 2004-08-30 Sold (Public Records) $247,500 Public Records
- 2003-11-14 Sold (Public Records) $101,000 Public Records
- 1996-03-30 Listing Removed — Smart MLS
- 1995-09-30 Listed $125,000 Smart MLS
Property tax history
+2.1%/yrLatest (2023): $5,636 · +11.1% YoY. Source: county tax records.
Cash-flow waterfall
monthlySold comps — $/sqft
last 12 mo · ≤1 miLoading sold comps…