4000 Round Lake Rd Spc 4 · Keno, OR
Flood risk 8/10 · Major
- FEMA flood zone
- X
- Chance of flooding over 30 yrs
- 0.99%
- Est. flood insurance / yr
- $507 – $1,088
Fire risk 7/10 · Major
- Est. fire insurance / yr
- $498 – $926
Heat risk 3/10 · Minor
- Hot days now (above 90°F)
- 8 days/yr
- Hot days in 30 yrs
- 19 days/yr
Wind risk 1/10 · Minimal
- Chance of severe wind over 30 yrs
- —
Air-quality risk 10/10 · Severe
- Unhealthy air days now
- 28 days/yr
- Unhealthy air days in 30 yrs
- 30 days/yr
Risk factors via First Street. Map © Google.
Why this score? — see what drove the B- grade
The composite is a weighted blend of 9 inputs, each scored 0–100. Each bar is that input's sub-score; the figure is the points it added to the 100-point composite (weight × sub-score).
- Cash flow +30.0/30.0
- 1% rule +10.0/10.0
- DSCR +10.0/10.0
- ARV discount +7.5/15.0
- Rent growth +3.3/5.0
- Schools +2.5/10.0
- Livability +2.5/5.0
- Condition / age +2.2/5.0
- Appreciation +0.0/10.0
$89,000
🖨 Deal sheet (PDF) 📄 Offer letter ✓ Due diligence
Listing remarks MLS
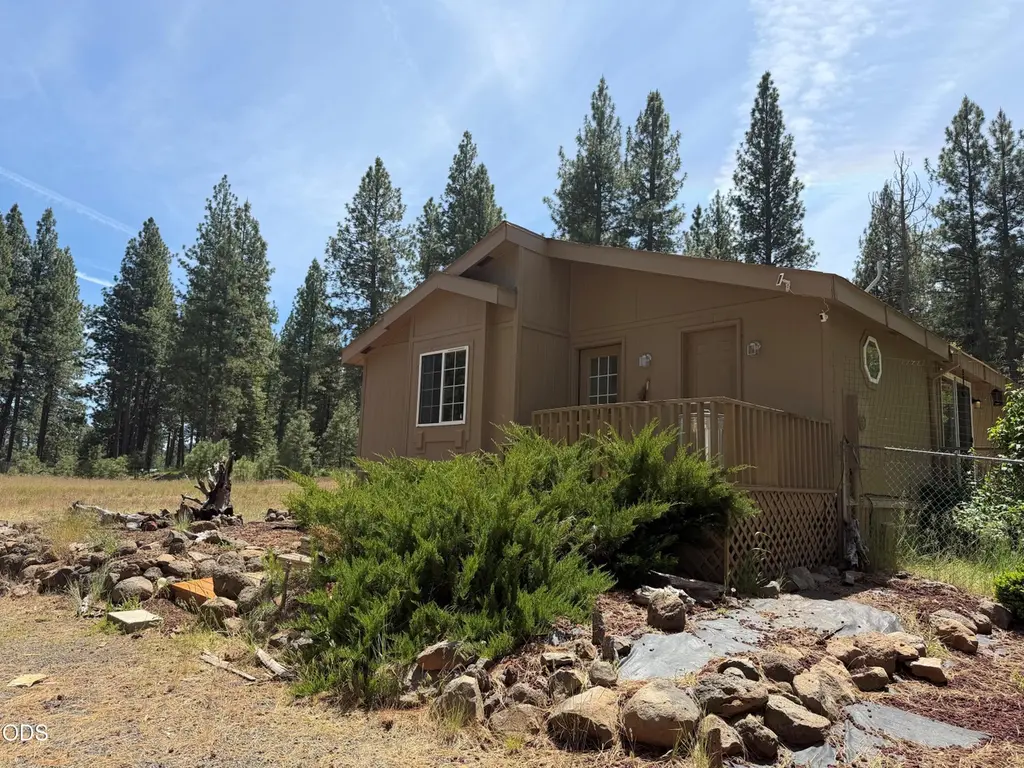
1996 Fuqua manufactured home in Round Lake Estates. This property is unique as the space sits back from the other lots in a more private setting. New paint inside the home as well as new carpet in the main living area and primary bedroom. The front and rear decks have been freshly painted and the yard is fully fenced. All the appliances currently in the home are included in as-is condition. Also included with the sale are the storage sheds shown in the photos.
Key facts
- Newer stove
- Newer dishwasher
- New flooring
Tags
Property features AI
Finance
- Financial info: Land lease: $475 monthly
- HOA & community: CCRs apply
Exterior
- Parking: Attached garage; Driveway; Gravel parking; No garage listed
- Security: Carbon monoxide detector(s); Smoke detector(s)
- Utilities: Public water; Public sewer; Electricity connected
- Home design: Mobile home (double wide) located in a park; One level; May remain in park; Manufacturer: Fuqua Homes Inc; Vinyl skirt
- Construction: Built in 1996; Pillar/post/pier foundation
- Exterior features: Composition roof; Shed(s); Vinyl window frames; On golf course; Wooded; Paved road access; Shared access road; Easement access
Interior
- Kitchen: Dishwasher; Range; Microwave; Refrigerator; Laminate counters
- Bedrooms: 3 bedrooms (including a primary bedroom)
- Flooring: Carpet; Laminate; Vinyl
- Bathrooms: 2 full bathrooms
- Heating & cooling: Electric forced air heating; Central air conditioning; Has heating and cooling
- Interior features: Laminate counters; Open floorplan; Shower/tub combo; Walk-in closet(s)
- Laundry & utility: Washer; Dryer; Water heater; Laundry room
Neighborhood map
What this means for you Summary
Snapshot
- This is a 3-bed/2.0-bath manufactured listed at $89k. Condition is rated fair.
Deal economics
- At list price, monthly cash flow is $640 ($8k/yr) — positive.
- The deal already cash-flows at list — no discount required.
- Meets the 1% rule at list price ($2k rent vs $89k).
- Recommended offer: $88k (1.5% below list) — sets the bar for market timing.
- Cap rate 15.8% vs local median 3.0% in Keno — top-decile yield for the area; either an underpriced asset or a hidden risk that comps aren't pricing in. Stress-test before assuming the spread holds.
Location & tenants
- Location reads: area grade B — affects rentability + tenant quality, not the cash-flow math above.
- Klamath County SD (rural): math 21% / reading 37% proficiency, ranked #46 of 58 in OR (top 79%) — low school quality limits family demand, transient renter base, plan for 1-2y turnover.
- Zoned schools: Keno Elementary School (math 30% / reading 44%, grade F, #200 of 412 statewide, top 49%, 194 students, 74% FRL); Henley Middle School (math 22% / reading 47%, grade F, #61 of 128 statewide, top 54%, 419 students, 72% FRL); Henley High School (693 students, 73% FRL).
- Market conditions: Rents rising (+3.1%/yr); 493 active listings in the ZIP; 232 units permitted in Klamath County in 2024 (72 in 5+ unit buildings).
- This rent runs 39% of the median local income ($52k/yr) — at the standard rent-burdened threshold; future hikes will face affordability resistance.
Forward outlook
- Local home prices are declining (-3.0%/yr); year-one equity from $615 of loan paydown is wiped out by about $3k of value loss. Plan a longer hold.
- Klamath County population projected at -12% by 2050 — secular population decline; favor cash flow + early exit over multi-decade hold.
- At projected returns (-3.0% appreciation + 3.1% rent growth), your $25k cash investment doubles in ~4 years — after that, you're playing with house money.
Negotiation context
- It's been on market 16 days — a 2% lower offer ($88k) is reasonable based on typical stale-listing flexibility.
- 2 sale attempts since 4y ago with the ask held roughly flat each time — persistent listings suggest the price (not the market) is what's stuck; bring a comps-based counter.
Risks & watch-outs
- Watch-outs: flood insurance adds $66/mo.
- Climate carrying-cost: severe flood risk; major wildfire risk — expect insurance premiums to compound above CPI over the hold.
Questions for the listing agent
- Have any recent inspections been done? Can we get a copy of the seller's disclosures and any deferred-maintenance estimates?
- What's the actual annual flood-insurance premium (NFIP or private), and is the property in a SFHA with mandatory coverage?
- Is there a deadline driving the sale (1031 exchange, divorce, estate, relocation)? That informs how much negotiation room exists.
- What's the average days-on-market for RENTAL listings here right now (not sales)? A rising rental-DOM trend means longer vacancies and softer asking-rent achievability than the comps imply.
- What's the recent tenant-quality profile in this submarket — average credit score on applications, eviction rate, late-payment / NSF rate, and stable-employment percentage? A property-management company in the area should have these aggregated.
- How much new for-sale + rental construction is in the pipeline within 1–3 miles? Heavy new supply typically softens prices + rents 12–24 months out; constrained supply supports both.
Investment metrics
- 1% rule
- 1.88% ✓
- Cap rate
- 15.82%
- Cash-on-cash
- 34.02%
- DSCR
- 2.51
- GRM
- 4.4
CMA / ARV
- ARV (on-the-fly)
- $251,888
- Comps found
- 9
Show comp detail 9 sales within ~0.75 mi
| Address | Dist | Beds/Ba | Sqft | Sold | Price | $/sf | Match |
|---|---|---|---|---|---|---|---|
| 4000 Round Lake Rd Spc 98 | 0.04mi | 3/2.0 | 1,584 (+9%) | 2mo | $57,800 | $36 | 82 |
| 14107 Ravenwood Dr | 0.30mi | 3/2.0 | 1,512 (+4%) | 2mo | $216,000 | $143 | 78 |
| 4000 Round Lake Rd #103 | 0.04mi | 2/2.0 (-1) | 1,440 (-1%) | 20mo | $60,000 | $42 | 74 |
| 14008 Ravenwood Dr | 0.27mi | 3/2.0 | 1,392 (-4%) | 14mo | $260,000 | $187 | 68 |
| 4000 Round Lake Rd #84 | 0.04mi | 3/2.0 | 1,238 (-15%) | 10mo | $59,000 | $48 | 65 |
| 13903 Ravenwood Dr | 0.31mi | 3/2.0 | 1,296 (-11%) | 10mo | $278,000 | $215 | 58 |
| 14214 Meadowbrook Ct | 0.28mi | 3/2.0 | 1,296 (-11%) | 13mo | $295,000 | $228 | 57 |
| 4366 Round Lake Rd | 0.39mi | 3/2.0 | 1,344 (-8%) | 21mo | $360,000 | $268 | 52 |
| 14013 Ravenwood Dr | 0.30mi | 3/2.0 | 1,620 (+11%) | 22mo | $280,000 | $173 | 49 |
Match score weights: distance 35% · size 25% · config 20% · recency 20%. Top-matched comps best support the ARV.
Projected returns pro-forma
-3.0% appreciation · 3.12% rent growth · sell at horizon
- IRR
- 25.8%
- Equity multiple
- 2.07×
- Total profit
- $26,612
- Equity at exit
- $13,270
- IRR
- 33.5%
- Equity multiple
- 4.08×
- Total profit
- $76,766
- Equity at exit
- $7,695
Cash invested: $24,920 (down + closing). Projections, not guarantees.
Landlord ↔ Tenant lean methodology
- Overall (STATE)
- 28 Tenant-Leaning
- State Oregon
- 28 Tenant-Leaning · D+6
- County
- — inherits STATE
- City
- — inherits STATE
ZIP-level market 97601
- Home prices YoY
- -3.7%
- Rents YoY
- 3.1%
- Active inventory
- 493
- Price-to-rent
- 4.4×
Monthly cashflow live
- Estimated rent
- $1,673 medium interval (Pro) →
- Mortgage (P&I)
- −$467
- Tax est. 1.5%
- −$111 /mo · $1,335/yr
- Insurance
- −$37
- Flood insurance flood zone
- −$66 /mo · $798/yr
- HOA
- −$0
- Vacancy / Maint / Mgmt
- −$351
- Net cashflow
- $640
Break-even live
Sensitivity live
| Price | -10% $702 | -5% $671 | +0% $640 | +5% $609 | +10% $579 |
|---|---|---|---|---|---|
| Rent | -10% $508 | -5% $574 | +0% $640 | +5% $706 | +10% $772 |
| Rate | -1.0pp $685 | -0.5pp $663 | base $640 | +0.5pp $617 | +1.0pp $594 |
UW: 25.0% down · 7.5% · 30yr · 1.5% tax · 5.0% vac · 8.0% maint · 8.0% mgmt
Financing live
Cash to close
- Down payment
- $22,250
- Closing costs
- $2,670
- Reserves months
- —
- Total cash needed
- —
Loan-product check · same deal, 3 products live
Conventional
25% down · 7.5% · 30yr
- Down + closing
- —
- Monthly P&I
- —
- Monthly cashflow
- —
- DSCR
- —
- Eligible?
- —
Personal DTI + credit; lowest rate.
DSCR
20% down · 8.5% · 30yr
- Down + closing
- —
- Monthly P&I
- —
- Monthly cashflow
- —
- DSCR
- —
- Eligible?
- —
No personal income docs; deal must DSCR.
Hard money
10% down · 12.0% · 12mo
- Down + closing
- —
- Monthly P&I
- —
- Monthly cashflow
- —
- DSCR
- —
- Eligible?
- —
Short-term bridge; refi at stabilization.
Listing history 12 events
-
2026-06-19days on market $89,000 Active 16 DOM
-
2026-06-18days on market $89,000 Active 15 DOM
-
2026-06-17days on market $89,000 Active 14 DOM
-
2026-06-16days on market $89,000 Active 13 DOM
-
2026-06-15days on market $89,000 Active 12 DOM
-
2026-06-14days on market $89,000 Active 10 DOM
-
2026-06-12days on market $89,000 Active 9 DOM
-
2026-06-09days on market $89,000 Active 6 DOM
-
2026-06-08days on market $89,000 Active 5 DOM
-
2026-06-07days on market $89,000 Active 4 DOM
-
2026-06-05remarks 543-char remark
-
2026-06-05$89,000 Active 1 DOM
ⓘ Source: listings_history table (triggers on properties + properties_extension) + one-shot
backfill from property_details.listing_events for pre-trigger history.
Climate risk First Street
- Flood 8/10 Severe FEMA zone X · 99% chance over 30 yrs
- Wildfire 7/10 Severe
- Heat 3/10 Moderate 8 d/yr ≥90°F today · 19 d/yr by 30 yrs out
- Wind 1/10 Low
- Air quality 10/10 Extreme 28 unhealthy d/yr today · 30 by 30 yrs out
Nearby sold comps map
Loading sold comps map…
Walkable amenities ~0.75 mi
Loading nearby amenities…
Taxation est. · year 1
- Rental income
- $20,075
- − Mortgage interest
- −$4,985
- − Property taxes
- −$1,335
- − Insurance
- −$1,242
- − Repairs & maintenance
- −$1,606
- − Management
- −$1,606
- − Depreciation
- −$2,589
- Taxable income
- $6,711
- Est. tax owed @ 24.0%
- −$1,611
- After-tax cash flow
- $6,070/yr
For passive investors: Depreciation is non-cash, so a rental often shows a tax loss while cash-flowing — sheltering income. Rental losses are passive: they offset passive income freely, and up to $25,000/yr can offset ordinary (W-2) income if you actively participate and your MAGI is under $100k (phasing out to $0 by $150k); unused losses carry forward. On sale, claimed depreciation is recaptured at up to 25%, and gains may owe capital-gains tax (a 1031 exchange can defer both). Figures are a year-1 estimate at your 24.0% rate — not tax advice; consult a CPA.
Condition & rehab AI · 12 photos
The home requires moderate repairs and updates to improve its condition and value. Painting the exterior and replacing the carpet would significantly enhance its curb appeal and living space aesthetics.
Repairs flagged
- Minor kitchen cabinets — existing condition
- Minor bathroom fixtures — existing condition
- Minor exterior siding — existing condition
- Minor interior walls — existing condition
Value-add opportunities
- Resale paint exterior — enhances curb appeal
- Resale replace carpet — improves living space aesthetics
- Resale update kitchen cabinets — modernizes space
- Resale update bathroom fixtures — modernizes space
- Rental repair/replace carpet — improves living space aesthetics
Renovation cost estimate screening
| Repair item | Severity | Est. cost |
|---|---|---|
| kitchen cabinets · existing condition | Minor | $500–3,000 |
| bathroom fixtures · existing condition | Minor | $500–3,000 |
| exterior siding · existing condition | Minor | $500–3,000 |
| interior walls · existing condition | Minor | $500–3,000 |
| Total estimated repair cost · 4 items | $2,000–12,000 |
Value-add ROI direction
- Resale paint exterior — enhances curb appeal ↑
- Resale replace carpet — improves living space aesthetics ↑
- Resale update kitchen cabinets — modernizes space ↑
- Resale update bathroom fixtures — modernizes space ↑
- Rental repair/replace carpet — improves living space aesthetics ↑
ⓘ Cost ranges are severity-bucket heuristics (US national rule-of-thumb). Get contractor quotes + a written scope before underwriting a rehab budget.
Schools (NCES district)
- District
- Klamath County SD
- NCES district ID
- 4107020
- Math proficiency
- 21% ▼ -17.00%
- Reading proficiency
- 37% ▼ -16.00%
- Median HH income
- $44,906
- Composite
- 24.83/100
- National rank
- #7593
- State rank
- #46 of 58 in OR
Livability — Keno
No livability data for this city. (Only ~50 U.S. cities are tracked.)
Census & demographics
- County
- Klamath County · 56,186 people
- Metro
- Klamath Falls, OR
- Population (ZIP)
- 22,964
- Household income
- $51,780
- Rent vs Own
- Severe rent burden
- 1323.0
Population outlook (Klamath County) Hauer SSP2
- Today (2025)
- 63,870 people
- By 2030
- 62,279 · -2.5%
- By 2040
- 58,891 · -7.8%
- By 2050
- 56,207 · -12.0%
- By 2075
- 51,239 · -19.8%
- By 2100
- 46,526 · -27.2%
Race, ethnicity, and origin ACS 2023
- Neighborhood character
- Predominantly White (76%)
- Race & ethnicity
- White 76% Hispanic / Latino 12% Two or more races 10% Native American 3% Asian 2%
- Hispanic origin (detail)
- Mexican 9%
- Common ancestry
- Lithuanian 4% Slovak 3% Portuguese 2%
- Foreign-born
- 4% · Canada
- Languages at home
- 92% English-only · Spanish 6%
Political lean MEDSL · Klamath
- 2024 margin
- Solid R (+41.9) · D 27.9% · R 69.8% · Other 2.4%
- 2008→2024 swing
- -8.8pp toward R · 2008: -33.1pp · 2024: -41.9pp
- All cycles
- 2024: R+41.9 2020: R+40.6 2016: R+44.8 2012: R+38.2 2008: R+33.1
Not yet ingested
- Civics
- —
Market trends
- HPI YoY
- ▼ -14.37%
- Current HPI
- 372.5418
- Rent YoY
- ▲ 3.12%
- Metro
- Klamath Falls, OR
- State GDP YoY
- ▲ 2.05%
- F500 in state
- 2
Industry mix (Fortune 500 HQ in OR)
| Industry | F500 HQs | Revenue |
|---|---|---|
| Consumer Goods | 1 | $51B |
|
||
Price history
-22.6% since first listed4 events — show timeline
- 2026-06-03 Listed $89,000 MLSCO
- 2022-09-06 Sold (MLS) $91,000 MLSCO
- 2022-07-21 Pending — MLSCO
- 2022-07-15 Listed $115,000 MLSCO
Cash-flow waterfall
monthlySold comps — $/sqft
last 12 mo · ≤1 miLoading sold comps…