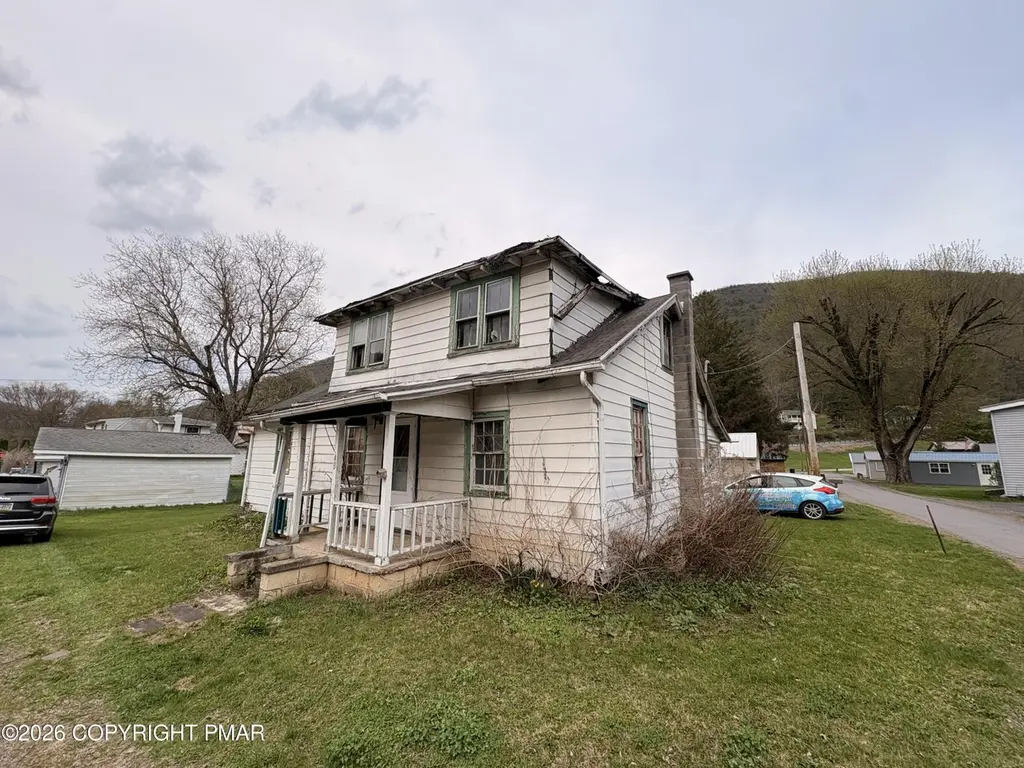
43 2nd St · Woolrich, PA
Flood risk 6/10 · Moderate
- FEMA flood zone
- AE
- Chance of flooding over 30 yrs
- 0.68%
- Est. flood insurance / yr
- $2,026 – $9,024
Fire risk 4/10 · Minor
- Est. fire insurance / yr
- $511 – $949
Heat risk 4/10 · Minor
- Hot days now (above 93°F)
- 9 days/yr
- Hot days in 30 yrs
- 19 days/yr
Wind risk 2/10 · Minimal
- Chance of severe wind over 30 yrs
- —
Air-quality risk 2/10 · Minimal
- Unhealthy air days now
- 0 days/yr
- Unhealthy air days in 30 yrs
- 1 days/yr
Risk factors via First Street. Map © Google.
Why this score? — see what drove the B+ grade
The composite is a weighted blend of 9 inputs, each scored 0–100. Each bar is that input's sub-score; the figure is the points it added to the 100-point composite (weight × sub-score).
- Cash flow +30.0/30.0
- 1% rule +10.0/10.0
- DSCR +10.0/10.0
- ARV discount +7.5/15.0
- Appreciation +7.4/10.0
- Schools +4.3/10.0
- Rent growth +2.5/5.0
- Livability +2.5/5.0
- Condition / age +2.5/5.0
$40,000
🖨 Deal sheet 📄 Offer letter ✓ Due diligence
Listing remarks
Attention investors, developers, and rehabbers, this is the opportunity you've been waiting for! Located at 43 2nd Street, this property is a full gut rehab with strong upside potential and endless possibilities for renovation or redevelopment at an affordable price point. Situated in a convenient location near local amenities and major routes, this home offers the perfect canvas for your next investment project. Whether you're looking to flip, rent, or restore, this property presents tremendous value and potential for the right buyer. Property is being sold as-is.
Key facts
- Full gut rehab
- Major routes
- Convenient location
Tags
Property features AI
Finance
- Other: Above-grade finished area reported as 1,264; Additional structures include storage and a workshop
Exterior
- Parking: Total of 4 parking spaces; One covered/garage space (garage faces front); Three open/off-street spaces; On-street parking available
- Utilities: Private water source (see remarks); Septic tank sewer; 100 amp electric service
- Home design: Single-family house; Residential zoning (R-1); No shared/common walls
- Construction: Shingle roof; Built with concrete, glass, stone, and wood siding; Foundation: block and concrete perimeter
- Exterior features: Uncovered courtyard; Patio/porch features: other (see remarks); Corner lot with meadow; Asphalt road frontage on a public, city-maintained street
Interior
- Flooring: Various/see remarks
- Bathrooms: Two full bathrooms
- Heating & cooling: Forced air heating; No central cooling
- Interior features: Wood window frames; Basement present with block and concrete construction; Unfurnished
- Laundry & utility: Laundry located in basement
Neighborhood map
What this means for you Summary
Snapshot
- This is a 4-bed/2.0-bath single-family listed at $40k.
Deal economics
- At list price, monthly cash flow is $206 ($2k/yr) — positive.
- The deal already cash-flows at list — no discount required.
- Meets the 1% rule at list price ($1k rent vs $40k).
Location & tenants
- Location reads: area grade B — affects rentability + tenant quality, not the cash-flow math above.
- Jersey Shore Area SD (town): math 41% / reading 59% proficiency, ranked #179 of 539 in PA (top 33%) — acceptable for families but not a draw, mixed tenant base, ~2y average lease.
- Market conditions: 5 active listings in the ZIP; 73 units permitted in Lycoming County in 2024 (15 in 5+ unit buildings).
Forward outlook
- In year one you build about $2k of equity ($277 loan paydown + $2k appreciation (4.7% local appreciation)).
- Lycoming County population projected to shrink 10% by 2050 — rents likely to lag national; underwrite the cash flow, not the appreciation.
- At projected returns (4.7% appreciation + 3.0% rent growth), your $11k cash investment doubles in ~3 years — after that, you're playing with house money.
Negotiation context
- Only 8 days on market — expect competitive offers; lowballing is unlikely to land.
- Current owner paid $18k; list at $40k implies a 122% gain — meaningful room to come down on a strong offer.
Risks & watch-outs
- Watch-outs: property tax is 3.0% of price; flood insurance adds $460/mo; built in 1935 — expect roof / HVAC / electrical / plumbing capex.
- Climate carrying-cost: in FEMA flood zone AE (mandatory federal flood insurance) — expect insurance premiums to compound above CPI over the hold.
Questions for the listing agent
- Built in 1935 — when were the roof, HVAC, electrical panel, plumbing, and water heater last replaced?
- Property tax is high relative to price — has the assessment been appealed recently, and will the sale trigger a re-assessment?
- What's the actual annual flood-insurance premium (NFIP or private), and is the property in a SFHA with mandatory coverage?
- Is there a deadline driving the sale (1031 exchange, divorce, estate, relocation)? That informs how much negotiation room exists.
- What's the average days-on-market for RENTAL listings here right now (not sales)? A rising rental-DOM trend means longer vacancies and softer asking-rent achievability than the comps imply.
- What's the recent tenant-quality profile in this submarket — average credit score on applications, eviction rate, late-payment / NSF rate, and stable-employment percentage? A property-management company in the area should have these aggregated.
- How much new for-sale + rental construction is in the pipeline within 1–3 miles? Heavy new supply typically softens prices + rents 12–24 months out; constrained supply supports both.
Investment metrics
- 1% rule
- 3.14% ✓
- Cap rate
- 26.27%
- Cash-on-cash
- 71.35%
- DSCR
- 4.17
- GRM
- 2.7
CMA / ARV
- ARV (on-the-fly)
- $295,776
- Comps found
- 1
Show comp detail 1 sale within ~0.75 mi
| Address | Dist | Beds/Ba | Sqft | Sold | Price | $/sf | Match |
|---|---|---|---|---|---|---|---|
| 18 N Third St | 0.09mi | 3/1.0 (-1) | 1,278 (+1%) | 6mo | $299,000 | $234 | 80 |
Match score weights: distance 35% · size 25% · config 20% · recency 20%. Top-matched comps best support the ARV.
Projected returns pro-forma
4.74% appreciation · 3.0% rent growth · sell at horizon
- IRR
- 31.9%
- Equity multiple
- 2.97×
- Total profit
- $22,062
- Equity at exit
- $22,047
- IRR
- 30.9%
- Equity multiple
- 6.03×
- Total profit
- $56,302
- Equity at exit
- $37,548
Cash invested: $11,200 (down + closing). Projections, not guarantees.
Landlord ↔ Tenant lean methodology
- Overall (STATE)
- 62 Landlord-Friendly
- State Pennsylvania
- 62 Landlord-Friendly · EVEN
- County
- — inherits STATE
- City
- — inherits STATE
ZIP-level market 17776
- Home prices YoY
- 1.5%
- Active inventory
- 5
- Price-to-rent
- 2.7×
Monthly cashflow live
- Estimated rent
- $1,258 medium interval (Pro) →
- Mortgage (P&I)
- −$210
- Tax from tax record
- −$101 /mo · $1,215/yr
- Insurance
- −$17
- Flood insurance flood zone
- −$460 /mo · $5,525/yr
- HOA
- −$0
- Vacancy / Maint / Mgmt
- −$264
- Net cashflow
- $206
Break-even live
UW: 25.0% down · 7.5% · 30yr · 1.5% tax · 5.0% vac · 8.0% maint · 8.0% mgmt
Financing live
Cash to close
- Down payment
- $10,000
- Closing costs
- $1,200
- Reserves months
- —
- Total cash needed
- —
Loan-product check · same deal, 3 products live
Conventional
25% down · 7.5% · 30yr
- Down + closing
- —
- Monthly P&I
- —
- Monthly cashflow
- —
- DSCR
- —
- Eligible?
- —
Personal DTI + credit; lowest rate.
DSCR
20% down · 8.5% · 30yr
- Down + closing
- —
- Monthly P&I
- —
- Monthly cashflow
- —
- DSCR
- —
- Eligible?
- —
No personal income docs; deal must DSCR.
Hard money
10% down · 12.0% · 12mo
- Down + closing
- —
- Monthly P&I
- —
- Monthly cashflow
- —
- DSCR
- —
- Eligible?
- —
Short-term bridge; refi at stabilization.
Listing history 8 events
-
2026-06-07statusdays on market $40,000 Pending 8 DOM
-
2026-06-04days on market $40,000 Active 6 DOM
-
2026-06-02days on market $40,000 Active 5 DOM
-
2026-06-01days on market $40,000 Active 4 DOM
-
2026-05-31days on market $40,000 Active 3 DOM
-
2026-05-31days on market $40,000 Active 2 DOM
-
2026-05-20$40,000 Active
-
1992-03-12soldstatus $18,000
ⓘ Source: listings_history table (triggers on properties + properties_extension) + one-shot
backfill from property_details.listing_events for pre-trigger history.
Tax reassessment forecast PA · Partial reset (capped growth)
- Current annual tax
- $1,215 · $101/mo
- Projected year-2 tax
- $1,215 · $101/mo
- Expected delta
- $0/yr ($0/mo · 0.0%)
ⓘ Screening estimate from a state-policy table — verify with the county assessor before closing.
Climate risk First Street
- Flood 6/10 Major FEMA zone AE · 68% chance over 30 yrs
- Wildfire 4/10 Moderate
- Heat 4/10 Moderate 9 d/yr ≥93°F today · 19 d/yr by 30 yrs out
- Wind 2/10 Low
- Air quality 2/10 Low 0 unhealthy d/yr today · 1 by 30 yrs out
Nearby sold comps map
Loading sold comps map…
Walkable amenities ~0.75 mi
Loading nearby amenities…
Taxation est. · year 1
- Rental income
- $15,093
- − Mortgage interest
- −$2,241
- − Property taxes
- −$1,215
- − Insurance
- −$5,725
- − Repairs & maintenance
- −$1,207
- − Management
- −$1,207
- − Depreciation
- −$1,164
- Taxable income
- $2,334
- Est. tax owed @ 24.0%
- −$560
- After-tax cash flow
- $1,906/yr
For passive investors: Depreciation is non-cash, so a rental often shows a tax loss while cash-flowing — sheltering income. Rental losses are passive: they offset passive income freely, and up to $25,000/yr can offset ordinary (W-2) income if you actively participate and your MAGI is under $100k (phasing out to $0 by $150k); unused losses carry forward. On sale, claimed depreciation is recaptured at up to 25%, and gains may owe capital-gains tax (a 1031 exchange can defer both). Figures are a year-1 estimate at your 24.0% rate — not tax advice; consult a CPA.
Schools (NCES district)
- District
- Jersey Shore Area SD
- NCES district ID
- 4212480
- Math proficiency
- 41% ▼ -8.00%
- Reading proficiency
- 59% ▼ -7.00%
- Median HH income
- $50,019
- Composite
- 42.72/100
- National rank
- #3165
- State rank
- #179 of 539 in PA
Livability — Woolrich
No livability data for this city. (Only ~50 U.S. cities are tracked.)
Census & demographics
- Population (ZIP)
- 158
Population outlook (Lycoming County) Hauer SSP2
- Today (2025)
- 114,164 people
- By 2030
- 112,221 · -1.7%
- By 2040
- 107,613 · -5.7%
- By 2050
- 102,950 · -9.8%
- By 2075
- 92,987 · -18.5%
- By 2100
- 80,924 · -29.1%
Race, ethnicity, and origin ACS 2023
- Neighborhood character
- Predominantly White (97%)
- Race & ethnicity
- White 97% Two or more races 1%
- Common ancestry
- Iranian 3% Serbian 3% Romanian 2%
Political lean MEDSL · Lycoming
- 2024 margin
- Solid R (+41.5) · D 28.8% · R 70.3%
- 2008→2024 swing
- -17.3pp toward R · 2008: -24.2pp · 2024: -41.5pp
- All cycles
- 2024: R+41.5 2020: R+41.3 2016: R+44.8 2012: R+33.3 2008: R+24.2
Not yet ingested
- Civics
- —
Market trends
- HPI YoY
- ▲ 4.74%
- Current HPI
- 313.1235
- Rent YoY
- —
- Metro
- —
- State GDP YoY
- ▲ 1.68%
- F500 in state
- 34
Industry mix (Fortune 500 HQ in PA)
| Industry | F500 HQs | Revenue |
|---|---|---|
| Healthcare | 2 | $309B |
|
||
| Insurance | 2 | $27B |
|
||
| Telecommunications / Media | 1 | $124B |
|
||
| Industrial Distribution | 1 | $22B |
|
||
| Financial Services | 1 | $20B |
|
||
| Chemicals / Materials | 1 | $18B |
|
||
Price history
+122.2% since first listed2 events — show timeline
- 2026-05-20 Listed $40,000 PMAR
- 1992-03-12 Sold (Public Records) $18,000 Public Records
Property tax history
+1.5%/yrLatest (2026): $1,215 · +1.7% YoY. Source: county tax records.
Cash-flow waterfall
monthlySold comps — $/sqft
last 12 mo · ≤1 miLoading sold comps…