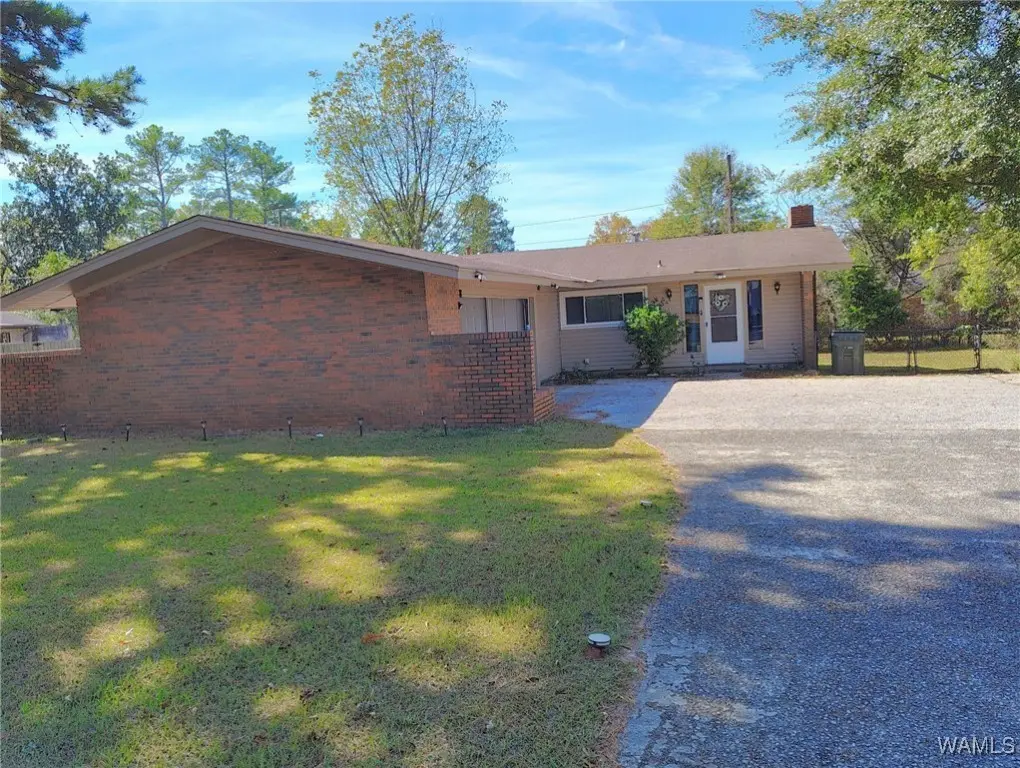
3829 University Blvd E · Tuscaloosa, AL
Flood risk 1/10 · Minimal
- FEMA flood zone
- X (unshaded)
- Chance of flooding over 30 yrs
- 0.0%
- Est. flood insurance / yr
- $507 – $1,088
Fire risk 3/10 · Minor
- Est. fire insurance / yr
- $916 – $1,700
Heat risk 7/10 · Major
- Hot days now (above 108°F)
- 7 days/yr
- Hot days in 30 yrs
- 20 days/yr
Wind risk 6/10 · Moderate
- Chance of severe wind over 30 yrs
- 55.0%
Air-quality risk 3/10 · Minor
- Unhealthy air days now
- 2 days/yr
- Unhealthy air days in 30 yrs
- 3 days/yr
Risk factors via First Street. Map © Google.
Why this score? — see what drove the D+ grade
The composite is a weighted blend of 9 inputs, each scored 0–100. Each bar is that input's sub-score; the figure is the points it added to the 100-point composite (weight × sub-score).
- Cash flow +15.5/30.0
- ARV discount +12.9/15.0
- DSCR +4.8/10.0
- Rent growth +4.2/5.0
- Livability +3.9/5.0
- 1% rule +3.6/10.0
- Schools +2.5/10.0
- Condition / age +2.5/5.0
- Appreciation +0.0/10.0
$224,900
🖨 Deal sheet 📄 Offer letter ✓ Due diligence
Listing remarks MLS
Welcome home to this beautiful all-brick Southern charmer that perfectly blends space, style, and convenience! This 3/2 offers tons of character with elegant accent areas, a breakfast bar in the kitchen, generously sized rooms throughout and an inviting layout that makes this home truly stand out. Outside, you’ll enjoy a huge yard for entertaining, gardening, or simply relaxing. Conveniently located near The University of Alabama, the interstate, and Midtown. Don’t miss this rare opportunity to own a home that has all the charm, comfort, and space you’ve been searching for! Currently leased through Fall of 2026, this property makes an excellent investment opportunity or future primary residence. Options for an earlier move in may be available, inquire for details.
Key facts
- Huge yard
- All brick
- Breakfast bar
Tags
Neighborhood map
What this means for you Summary
Snapshot
- This is a 3-bed/1.0-bath single-family listed at $225k.
Deal economics
- At list price, monthly cash flow is $91 ($1k/yr) — positive.
- The deal already cash-flows at list — no discount required.
- To meet the 1% rule (rent ≥ 1% of price), the offer needs to be $193k (14.3% below list).
- Recommended offer: $193k (14.3% below list) — sets the bar for 1% rule.
- Cap rate 6.8% vs local median 3.4% in Tuscaloosa — top-decile yield for the area; either an underpriced asset or a hidden risk that comps aren't pricing in. Stress-test before assuming the spread holds.
Location & tenants
- Location reads 77/100 on livability (#9 in AL, #2,909 nationally) — a middle-class / working-renter tenant base. Strengths: amenities A+, health & safety A+, cost of living A; Watch: crime F, employment D-.
- Tuscaloosa City (urban): math 19% / reading 40% proficiency, ranked #74 of 129 in AL (top 57%) — low school quality limits family demand, transient renter base, plan for 1-2y turnover.
- Market conditions: Rents rising fast (+6.8%/yr); 167 active listings in the ZIP; 9 comparable units currently listed for rent nearby; rentals lingering (median 44d on market — plan ~5-8 weeks vacancy on turnover, expect pricing pressure); 56% of comp listings sitting > 30 days — soft ceiling on asking rent; 622 units permitted in Tuscaloosa County in 2024 (69 in 5+ unit buildings).
- At $1,928/mo this rent would consume 47% of the median local household income ($49k/yr) (locally 1531% of renters already pay >50% of income on rent) — very limited rent-growth headroom before tenants either downsize or default.
Forward outlook
- Local home prices are declining (-3.0%/yr); year-one equity from $2k of loan paydown is wiped out by about $7k of value loss. Plan a longer hold.
- Tuscaloosa County population projected at +26% by 2050 — long-run rental-demand tailwind backs the buy-and-hold thesis.
Negotiation context
- It's been on market 211 days — a 12% lower offer ($198k) is reasonable based on typical stale-listing flexibility.
- 2 sale attempts since 11y ago; this cycle's ask has dropped $35k (13%) from the opening price — seller is motivated, your offer sets the floor, not the list.
- Current owner paid $135k; list at $225k implies a 67% gain — meaningful room to come down on a strong offer.
Risks & watch-outs
- Climate carrying-cost: major wind risk, 55% chance of damaging wind over 30y; extreme-heat days projected 7→20/yr by 2055 (HVAC capex compounding) — expect insurance premiums to compound above CPI over the hold.
Questions for the listing agent
- It's been on market 211 days. Have you received any prior offers? Is the seller open to a 14% concession, seller financing, or rate buy-down credit?
- Built in 1975 — when were the roof, HVAC, electrical panel, plumbing, and water heater last replaced?
- Why hasn't it sold? Are there any deal-killer items the seller is aware of (foundation, flood, title, zoning, code violations)?
- Is there a deadline driving the sale (1031 exchange, divorce, estate, relocation)? That informs how much negotiation room exists.
- Crime grade is F in this area — have there been break-ins, vandalism, or insurance claims at this property in the last 3 years? What carrier currently insures it and at what premium?
- The area grade is low — what's the realistic commute time and amenity access for the typical tenant pool here? Any planned neighborhood developments (good or bad) we should know about?
- What's the average days-on-market for RENTAL listings here right now (not sales)? A rising rental-DOM trend means longer vacancies and softer asking-rent achievability than the comps imply.
- What's the recent tenant-quality profile in this submarket — average credit score on applications, eviction rate, late-payment / NSF rate, and stable-employment percentage? A property-management company in the area should have these aggregated.
- How much new for-sale + rental construction is in the pipeline within 1–3 miles? Heavy new supply typically softens prices + rents 12–24 months out; constrained supply supports both.
Investment metrics
- 1% rule
- 0.86% ✗
- Cap rate
- 6.78%
- Cash-on-cash
- 1.74%
- DSCR
- 1.08
- GRM
- 9.7
CMA / ARV
- ARV (median comp)
- $255,450
- List price
- $224,900
- Delta
- -11.96%
- Verdict
- UNDERPRICED
- Comps
- 20 within 1.0 mi
Show comp detail 12 sales within ~0.75 mi
| Address | Dist | Beds/Ba | Sqft | Sold | Price | $/sf | Match |
|---|---|---|---|---|---|---|---|
| 3801 12th Pl E | 0.09mi | 3/2.0 | 2,043 (+9%) | 5mo | $255,000 | $125 | 72 |
| 1236 38th Ave E | 0.07mi | 3/2.0 | 1,671 (-11%) | 9mo | $285,000 | $171 | 68 |
| 3854 14th Pl E | 0.39mi | 3/1.0 | 1,744 (-7%) | 3mo | $165,000 | $95 | 68 |
| 20 Windsor Dr | 0.45mi | 3/2.0 | 1,964 (+5%) | 0mo | $292,500 | $149 | 66 |
| 3528 12th St E | 0.18mi | 3/2.0 | 1,656 (-11%) | 7mo | $259,900 | $157 | 63 |
| 14 Windsor Dr | 0.51mi | 3/2.0 | 1,760 (-6%) | 2mo | $245,000 | $139 | 61 |
| 3724 7th St St E | 0.45mi | 3/2.0 | 1,948 (+4%) | 9mo | $230,000 | $118 | 60 |
| 4110 Virginia Dr | 0.31mi | 3/2.0 | 1,760 (-6%) | 14mo | $192,000 | $109 | 60 |
| 15 Forest Dr | 0.51mi | 3/2.0 | 1,710 (-8%) | 3mo | $289,900 | $170 | 56 |
| 3124 Veterans Memorial Pkwy | 0.59mi | 3/2.0 | 1,958 (+5%) | 8mo | $199,000 | $102 | 54 |
| 4207 Highpoint Drive Dr | 0.37mi | 3/1.5 | 1,659 (-11%) | 10mo | $148,000 | $89 | 54 |
| 500 41st Ave E | 0.62mi | 4/2.0 (+1) | 1,772 (-5%) | 6mo | $212,000 | $120 | 49 |
Match score weights: distance 35% · size 25% · config 20% · recency 20%. Top-matched comps best support the ARV.
Projected returns pro-forma
-3.0% appreciation · 6.81% rent growth · sell at horizon
- IRR
- -9.7%
- Equity multiple
- 0.63×
- Total profit
- $-22,995
- Equity at exit
- $33,533
- IRR
- 4.0%
- Equity multiple
- 1.34×
- Total profit
- $21,344
- Equity at exit
- $19,445
Cash invested: $62,972 (down + closing). Projections, not guarantees.
Landlord ↔ Tenant lean methodology
- Overall (STATE)
- 90 Strongly Landlord-Friendly
- State Alabama
- 90 Strongly Landlord-Friendly · R+15
- County
- — inherits STATE
- City
- — inherits STATE
ZIP-level market 35404
- Rents YoY
- 6.8%
- Active inventory
- 167
- Price-to-rent
- 9.7×
Monthly cashflow live
- Estimated rent
- $1,928 high interval (Pro) →
- Mortgage (P&I)
- −$1,179
- Tax from tax record
- −$158 /mo · $1,901/yr
- Insurance
- −$94
- HOA
- −$0
- Vacancy / Maint / Mgmt
- −$405
- Net cashflow
- $91
Break-even live
UW: 25.0% down · 7.5% · 30yr · 1.5% tax · 5.0% vac · 8.0% maint · 8.0% mgmt
Financing live
Cash to close
- Down payment
- $56,225
- Closing costs
- $6,747
- Reserves months
- —
- Total cash needed
- —
Loan-product check · same deal, 3 products live
Conventional
25% down · 7.5% · 30yr
- Down + closing
- —
- Monthly P&I
- —
- Monthly cashflow
- —
- DSCR
- —
- Eligible?
- —
Personal DTI + credit; lowest rate.
DSCR
20% down · 8.5% · 30yr
- Down + closing
- —
- Monthly P&I
- —
- Monthly cashflow
- —
- DSCR
- —
- Eligible?
- —
No personal income docs; deal must DSCR.
Hard money
10% down · 12.0% · 12mo
- Down + closing
- —
- Monthly P&I
- —
- Monthly cashflow
- —
- DSCR
- —
- Eligible?
- —
Short-term bridge; refi at stabilization.
Rent comps 9 comps
| Address | Beds | Baths | Sqft | Rent | $/sqft | DOM | Units | Dist |
|---|---|---|---|---|---|---|---|---|
| 3218 Veterans Memorial Pkwy Tuscaloosa, AL | 3.0 | 3.0–3.5 | 1484 | $1,950 | $1.31 | 21d | 1 | 0.46mi |
| 2919 University Blvd E Tuscaloosa, AL | 3.0 | 1.5 | 1968 | $1,800 | $0.91 | 43d | 1 | 0.71mi |
| 5100 Old Birmingham Hwy Tuscaloosa, AL | 2.0 | 1.0–2.0 | 883 | $1,460 | $1.65 | 13d | 1 | 1.00mi |
| 5007 15th Pl E Tuscaloosa, AL | 4.0 | 2.0 | 2000 | $1,750 | $0.88 | 43d | 1 | 1.11mi |
| 1010 23rd Ave E Tuscaloosa, AL | 3.0 | 2.0 | 1251 | $1,500 | $1.20 | 43d | 1 | 1.23mi |
| 922 23rd Ave E Tuscaloosa, AL | 1.0–2.0 | 1.0–2.0 | 1092 | $2,300 | $2.11 | 13d | 4 | 1.23mi |
| 123 Circlewood Tuscaloosa, AL | 2.0 | 1.0 | 1250 | $1,150 | $0.92 | 43d | 1 | 1.34mi |
| 829 21st Ave E Tuscaloosa, AL | 3.0 | 3.5 | 1792 | $2,569 | $1.43 | 43d | 1 | 1.34mi |
| 927 Kicker Rd Tuscaloosa, AL | 3.0 | 3.0 | 1412 | $3,075 | $2.18 | 21d | 2 | 1.40mi |
Listing history 7 events
-
2026-04-09price $224,900 795-char remark
Show marketing remark (795 chars)
Welcome home to this beautiful all-brick Southern charmer that perfectly blends space, style, and convenience! This 3/2 offers tons of character with elegant accent areas, a breakfast bar in the kitchen, generously sized rooms throughout and an inviting layout that makes this home truly stand out. Outside, you’ll enjoy a huge yard for entertaining, gardening, or simply relaxing. Conveniently located near The University of Alabama, the interstate, and Midtown. Don’t miss this rare opportunity to own a home that has all the charm, comfort, and space you’ve been searching for! Currently leased through Fall of 2026, this property makes an excellent investment opportunity or future primary residence. Options for an earlier move in may be available, inquire for details.
-
2025-11-04price $244,900 795-char remark
Show marketing remark (795 chars)
Welcome home to this beautiful all-brick Southern charmer that perfectly blends space, style, and convenience! This 3/2 offers tons of character with elegant accent areas, a breakfast bar in the kitchen, generously sized rooms throughout and an inviting layout that makes this home truly stand out. Outside, you’ll enjoy a huge yard for entertaining, gardening, or simply relaxing. Conveniently located near The University of Alabama, the interstate, and Midtown. Don’t miss this rare opportunity to own a home that has all the charm, comfort, and space you’ve been searching for! Currently leased through Fall of 2026, this property makes an excellent investment opportunity or future primary residence. Options for an earlier move in may be available, inquire for details.
-
2025-10-29$259,900 Active 795-char remark
Show marketing remark (795 chars)
Welcome home to this beautiful all-brick Southern charmer that perfectly blends space, style, and convenience! This 3/2 offers tons of character with elegant accent areas, a breakfast bar in the kitchen, generously sized rooms throughout and an inviting layout that makes this home truly stand out. Outside, you’ll enjoy a huge yard for entertaining, gardening, or simply relaxing. Conveniently located near The University of Alabama, the interstate, and Midtown. Don’t miss this rare opportunity to own a home that has all the charm, comfort, and space you’ve been searching for! Currently leased through Fall of 2026, this property makes an excellent investment opportunity or future primary residence. Options for an earlier move in may be available, inquire for details.
-
2015-09-15soldstatus $135,000
-
2015-09-11soldstatus $135,000 34-char remark
Show marketing remark (34 chars)
SOLD BEFORE PUBLISHED. AS IS SALE.
-
2015-08-17$135,000 34-char remark
Show marketing remark (34 chars)
SOLD BEFORE PUBLISHED. AS IS SALE.
-
2014-06-06soldstatus $128,835
ⓘ Source: listings_history table (triggers on properties + properties_extension) + one-shot
backfill from property_details.listing_events for pre-trigger history.
Tax reassessment forecast AL · Resets to sale price
- Current annual tax
- $1,901 · $158/mo
- Projected year-2 tax
- $1,901 · $158/mo
- Expected delta
- $0/yr ($0/mo · 0.0%)
ⓘ Screening estimate from a state-policy table — verify with the county assessor before closing.
Climate risk First Street
- Flood 1/10 Low FEMA zone X (unshaded) · 0% chance over 30 yrs
- Wildfire 3/10 Moderate
- Heat 7/10 Severe 7 d/yr ≥108°F today · 20 d/yr by 30 yrs out
- Wind 6/10 Major 55% chance of damaging wind over 30 yrs
- Air quality 3/10 Moderate 2 unhealthy d/yr today · 3 by 30 yrs out
Nearby sold comps map
Loading sold comps map…
Walkable amenities ~0.75 mi
Loading nearby amenities…
Taxation est. · year 1
- Rental income
- $23,134
- − Mortgage interest
- −$12,598
- − Property taxes
- −$1,901
- − Insurance
- −$1,124
- − Repairs & maintenance
- −$1,851
- − Management
- −$1,851
- − Depreciation
- −$6,543
- Taxable loss
- −$2,734
- Est. tax savings @ 24.0%
- +$656
- After-tax cash flow
- $1,753/yr
For passive investors: Depreciation is non-cash, so a rental often shows a tax loss while cash-flowing — sheltering income. Rental losses are passive: they offset passive income freely, and up to $25,000/yr can offset ordinary (W-2) income if you actively participate and your MAGI is under $100k (phasing out to $0 by $150k); unused losses carry forward. On sale, claimed depreciation is recaptured at up to 25%, and gains may owe capital-gains tax (a 1031 exchange can defer both). Figures are a year-1 estimate at your 24.0% rate — not tax advice; consult a CPA.
Schools (NCES district)
- District
- Tuscaloosa City
- NCES district ID
- 0103360
- Math proficiency
- 19% ▼ -24.00%
- Reading proficiency
- 40% ▼ -1.00%
- Median HH income
- $37,474
- Composite
- 24.51/100
- National rank
- #7647
- State rank
- #74 of 129 in AL
Livability — Tuscaloosa
- Score
- 77/100
- State rank
- #9
- US rank
- #2909
Category grades
Schools grade is shown separately in the Schools card above.
Census & demographics
- Census place
- Tuscaloosa, AL
- County
- Tuscaloosa County · 206,491 people
- City population
- 134,228
- Metro
- Tuscaloosa, AL
- Population (ZIP)
- 22,445
- Household income
- $48,932
- Rent vs Own
- Severe rent burden
- 1531.0
Population outlook (Tuscaloosa County) Hauer SSP2
- Today (2025)
- 228,293 people
- By 2030
- 240,551 · +5.4%
- By 2040
- 263,856 · +15.6%
- By 2050
- 286,491 · +25.5%
- By 2075
- 335,783 · +47.1%
- By 2100
- 370,520 · +62.3%
Race, ethnicity, and origin ACS 2023
- Neighborhood character
- Diverse neighborhood (Simpson 0.59)
- Race & ethnicity
- Black 46% White 44% Hispanic / Latino 8% Two or more races 5% Asian 1%
- Hispanic origin (detail)
- Mexican 8%
- Common ancestry
- Italian 2% Slovak 1% Serbian 1%
- Foreign-born
- 6% · Canada, South Korea
- Languages at home
- 91% English-only · Spanish 7%
Political lean MEDSL · Tuscaloosa
- 2024 margin
- Strong R (+20.4) · D 39.4% · R 59.8%
- 2008→2024 swing
- -4.4pp toward R · 2008: -16.0pp · 2024: -20.4pp
- All cycles
- 2024: R+20.4 2020: R+14.8 2016: R+19.5 2012: R+17.4 2008: R+16.0
Not yet ingested
- Civics
- —
Market trends
- HPI YoY
- ▼ -103.00%
- Current HPI
- 170.026
- Rent YoY
- ▲ 6.81%
- Metro
- Tuscaloosa, AL
- State GDP YoY
- ▲ 2.94%
- F500 in state
- 4
Industry mix (Fortune 500 HQ in AL)
| Industry | F500 HQs | Revenue |
|---|---|---|
| Financial Services | 1 | $8B |
|
||
| Healthcare | 1 | $5B |
|
||
Price history
+74.6% since first listed7 events — show timeline
- 2026-04-09 Price Changed $224,900 WAMLS
- 2025-11-04 Price Changed $244,900 WAMLS
- 2025-10-29 Listed $259,900 WAMLS
- 2015-09-15 Sold (Public Records) $135,000 Public Records
- 2015-09-11 Sold (MLS) $135,000 WAMLS
- 2015-08-17 Listed $135,000 WAMLS
- 2014-06-06 Sold (Public Records) $128,835 Public Records
Property tax history
-0.3%/yrLatest (2025): $1,901 · +7.0% YoY. Source: county tax records.
Cash-flow waterfall
monthlySold comps — $/sqft
last 12 mo · ≤1 miLoading sold comps…