7950 W Mcnab Rd #203 · Tamarac, FL
Flood risk No data
- FEMA flood zone
- —
- Chance of flooding over 30 yrs
- —
- Est. flood insurance / yr
- —
Fire risk No data
- Est. fire insurance / yr
- —
Heat risk No data
- Hot days now (above threshold)
- —
- Hot days in 30 yrs
- —
Wind risk No data
- Chance of severe wind over 30 yrs
- —
Air-quality risk No data
- Unhealthy air days now
- —
- Unhealthy air days in 30 yrs
- —
Risk factors via First Street. Map © Google.
Why this score? — see what drove the C- grade
The composite is a weighted blend of 9 inputs, each scored 0–100. Each bar is that input's sub-score; the figure is the points it added to the 100-point composite (weight × sub-score).
- Cash flow +16.0/30.0
- 1% rule +10.0/10.0
- ARV discount +7.5/15.0
- DSCR +4.9/10.0
- Schools +4.1/10.0
- Livability +3.8/5.0
- Condition / age +2.5/5.0
- Rent growth +2.0/5.0
- Appreciation +0.0/10.0
$129,999
🖨 Deal sheet (PDF) 📄 Offer letter ✓ Due diligence
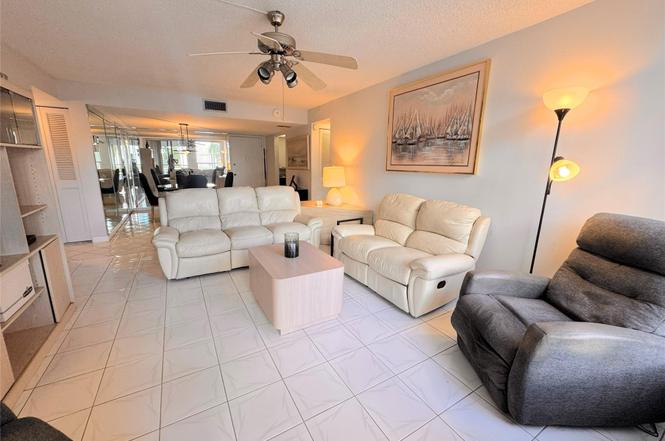
Listing remarks
ALL OFFERS CONSIDERED !! OWNER SAY SELL! Welcome to Concord Village at Tamarac Lakes - a desirable 55+ community!This well-maintained 2nd-floor unit offers comfort, convenience, & peace of mind. Enjoy a screened private large patio. Colony West Golf Club—is your backyard retreat. With plenty of closet space, washer & dryer hookups, exterior storage, & a new WH. Furniture can stay. The building has a new roof, seller assumes the assessment. 40-year certification is complete. The low HOA fee includes water & cable & fantastic amenities such as three pools, fitness room, library, billiards, shuffleboard, & more. Ideally located near major highways, hospit
Key facts
- Exterior storage
- Washer dryer hookups
- New roof
Tags
Property features AI
Finance
- Other: Resale condition; Senior community
- HOA & community: Monthly HOA fee; Community amenities: Billiard room, Clubhouse, Shuffleboard court, Storage, Maintenance; HOA includes maintenance of structure, sewer, trash, water, common areas, elevator, and reserve funds
Exterior
- Parking: Open guest parking; 1 open parking space
- Utilities: Cable available
- Home design: Condominium; 3-story building; Second floor entry; Faces south
- Construction: CBS construction; Flat roof
- Exterior features: Non-waterfront property; Second-floor entry
Interior
- Kitchen: Electric range; Microwave; Refrigerator
- Bedrooms: 2 bedrooms on the main level
- Flooring: Tile flooring
- Bathrooms: 2 full bathrooms
- Heating & cooling: Central electric heating; Central air conditioning; Ceiling fans
- Interior features: Blinds on windows
Neighborhood map
What this means for you Summary
Snapshot
- This is a 2-bed/2.0-bath condo listed at $130k.
Deal economics
- At list price, monthly cash flow is $63 ($760/yr) — positive.
- The deal already cash-flows at list — no discount required.
- Meets the 1% rule at list price ($2k rent vs $130k).
- Recommended offer: $118k (9.0% below list) — sets the bar for market timing.
- Cap rate 6.9% vs local median 3.9% in Tamarac — top-decile yield for the area; either an underpriced asset or a hidden risk that comps aren't pricing in. Stress-test before assuming the spread holds.
Location & tenants
- Location reads 76/100 on livability (#239 in FL, #3,785 nationally) — a middle-class / working-renter tenant base. Strengths: housing A+, health & safety A+, cost of living A-; Watch: employment C-, amenities F, commute F.
- Broward (suburban): math 42% / reading 53% proficiency, ranked #46 of 73 in FL (top 63%) — families likely to look elsewhere, expect single-tenant / working-renter base with shorter leases.
- Zoned schools: Challenger Elementary School (math 37% / reading 53%, grade D-, #1,271 of 2,144 statewide, top 60%, 909 students, 62% FRL); J. P. Taravella High School (math 19% / reading 45%, grade F, #415 of 667 statewide, top 63%, 2,586 students, 54% FRL).
- Market conditions: Rents soft (-1.9%/yr); 588 active listings in the ZIP; 40 comparable units currently listed for rent nearby; rentals at typical pace (median 18d on market — plan ~3-4 weeks tenant-placement turnaround); 2,111 units permitted in Broward County in 2024 (1,265 in 5+ unit buildings).
- This rent runs 39% of the median local income ($62k/yr) — at the standard rent-burdened threshold; future hikes will face affordability resistance.
Forward outlook
- Local home prices are declining (-3.0%/yr); year-one equity from $899 of loan paydown is wiped out by about $4k of value loss. Plan a longer hold.
- Broward County population projected at +34% by 2050 — long-run rental-demand tailwind backs the buy-and-hold thesis.
Negotiation context
- It's been on market 99 days — a 9% lower offer ($118k) is reasonable based on typical stale-listing flexibility.
- 2 sale attempts with the ask held roughly flat each time — persistent listings suggest the price (not the market) is what's stuck; bring a comps-based counter.
- Current owner paid $62k; list at $130k implies a 108% gain — meaningful room to come down on a strong offer.
Risks & watch-outs
- Watch-outs: property tax is 2.8% of price; HOA is 24% of rent.
Questions for the listing agent
- It's been on market 99 days. Have you received any prior offers? Is the seller open to a 9% concession, seller financing, or rate buy-down credit?
- Property tax is high relative to price — has the assessment been appealed recently, and will the sale trigger a re-assessment?
- What does the HOA fee cover, when was the last increase, and are there any pending special assessments or reserve-fund shortfalls?
- Any open or pending special assessments — roof, HVAC, plumbing, elevator, façade? What's the per-unit balance and payoff schedule, and is the seller paying it off at close or rolling it to the buyer?
- Why hasn't it sold? Are there any deal-killer items the seller is aware of (foundation, flood, title, zoning, code violations)?
- Is there a deadline driving the sale (1031 exchange, divorce, estate, relocation)? That informs how much negotiation room exists.
- Schools are B-rated — typically a magnet for longer-tenancy family renters. What's the average tenant stay here, and is there a school-zone premium baked into asking?
- What's the average days-on-market for RENTAL listings here right now (not sales)? A rising rental-DOM trend means longer vacancies and softer asking-rent achievability than the comps imply.
- What's the recent tenant-quality profile in this submarket — average credit score on applications, eviction rate, late-payment / NSF rate, and stable-employment percentage? A property-management company in the area should have these aggregated.
- How much new apartment / multifamily construction is in the pipeline within 1–3 miles? Heavy new supply (>2% of stock underway) typically softens rents 12–24 months out; light construction supports rent growth.
Investment metrics
- 1% rule
- 1.54% ✓
- Cap rate
- 6.88%
- Cash-on-cash
- 2.09%
- DSCR
- 1.09
- GRM
- 5.4
CMA / ARV
No comps found within radius.
Projected returns pro-forma
-3.0% appreciation · 0.0% rent growth · sell at horizon
- IRR
- -18.4%
- Equity multiple
- 0.38×
- Total profit
- $-22,497
- Equity at exit
- $19,383
- IRR
- -26.7%
- Equity multiple
- 0.03×
- Total profit
- $-35,441
- Equity at exit
- $11,240
Cash invested: $36,400 (down + closing). Projections, not guarantees.
Landlord ↔ Tenant lean methodology
- Overall (STATE)
- 87 Strongly Landlord-Friendly
- State Florida
- 87 Strongly Landlord-Friendly · R+3
- County
- — inherits STATE
- City
- — inherits STATE
ZIP-level market 33321
- Home prices YoY
- -30.4%
- Rents YoY
- -1.9%
- Active inventory
- 588
- Price-to-rent
- 5.4×
Monthly cashflow live
- Estimated rent
- $2,007 high interval (Pro) →
- Mortgage (P&I)
- −$682
- Tax from tax record
- −$301 /mo · $3,613/yr
- Insurance
- −$54
- HOA
- −$485
- Vacancy / Maint / Mgmt
- −$421
- Net cashflow
- $63
Break-even live
Sensitivity live
| Price | -10% $137 | -5% $100 | +0% $63 | +5% $27 | +10% $-10 |
|---|---|---|---|---|---|
| Rent | -10% $-95 | -5% $-16 | +0% $63 | +5% $143 | +10% $222 |
| Rate | -1.0pp $129 | -0.5pp $96 | base $63 | +0.5pp $30 | +1.0pp $-5 |
UW: 25.0% down · 7.5% · 30yr · 1.5% tax · 5.0% vac · 8.0% maint · 8.0% mgmt
Financing live
Cash to close
- Down payment
- $32,500
- Closing costs
- $3,900
- Reserves months
- —
- Total cash needed
- —
Loan-product check · same deal, 3 products live
Conventional
25% down · 7.5% · 30yr
- Down + closing
- —
- Monthly P&I
- —
- Monthly cashflow
- —
- DSCR
- —
- Eligible?
- —
Personal DTI + credit; lowest rate.
DSCR
20% down · 8.5% · 30yr
- Down + closing
- —
- Monthly P&I
- —
- Monthly cashflow
- —
- DSCR
- —
- Eligible?
- —
No personal income docs; deal must DSCR.
Hard money
10% down · 12.0% · 12mo
- Down + closing
- —
- Monthly P&I
- —
- Monthly cashflow
- —
- DSCR
- —
- Eligible?
- —
Short-term bridge; refi at stabilization.
Rent comps 40 comps
| Address | Beds | Baths | Sqft | Rent | $/sqft | DOM | Units | Dist |
|---|---|---|---|---|---|---|---|---|
| 7950 W McNab Rd #214 Tamarac, FL | 2.0 | 2.0 | 1040 | $1,950 | $1.88 | 4d | 1 | 0.01mi |
| 8050 W McNab Rd #206 Tamarac, FL | 2.0 | 2.0 | 1040 | $1,890 | $1.82 | 8d | 1 | 0.09mi |
| 8050 W McNab Rd #206 Tamarac, FL | 2.0 | 2.0 | 1040 | $1,890 | $1.82 | 15d | 1 | 0.09mi |
| 8002 Lagos de Campo Blvd Unit 101B Tamarac, FL | 2.0 | 2.0 | 1078 | $2,200 | $2.04 | 25d | 1 | 0.13mi |
| 8000 Lagos De Campo Blvd Unit A-307 Tamarac, FL | 2.0 | 2.0 | 1078 | $2,250 | $2.09 | 21d | 1 | 0.13mi |
| 8000 Lagos De Campo Blvd Unit A-303 Tamarac, FL | 1.0 | 1.5 | 746 | $1,775 | $2.38 | 25d | 1 | 0.13mi |
| 8033 NW 71st Ct #8033 Tamarac, FL | 3.0 | 3.0 | 1417 | $3,100 | $2.19 | 25d | 1 | 0.17mi |
| 7831 Colony Cir N #201 Tamarac, FL | 2.0 | 2.0 | 949 | $2,000 | $2.11 | 14d | 1 | 0.18mi |
| 8060 Colony Cir N #208 Tamarac, FL | 1.0 | 1.5 | 750 | $1,700 | $2.27 | 16d | 1 | 0.21mi |
| 8060 Colony Cir N Tamarac, FL | 1.0 | 1.5 | 750 | $1,600 | $2.13 | 18d | 2 | 0.21mi |
| 7650 W McNab Rd #204 Tamarac, FL | 2.0 | 2.0 | 865 | $1,695 | $1.96 | 15d | 1 | 0.21mi |
| 7650 W McNab Rd #204 Tamarac, FL | 2.0 | 2.0 | 865 | $1,695 | $1.96 | 11d | 1 | 0.21mi |
| 6751 N University Dr #320 Tamarac, FL | 2.0 | 2.0 | 1040 | $2,000 | $1.92 | 25d | 1 | 0.25mi |
| 8040 Colony Cir N #207 Tamarac, FL | 1.0 | 1.5 | 750 | $1,475 | $1.97 | 25d | 1 | 0.27mi |
| 7960 Colony Cir N #206 Tamarac, FL | 2.0 | 2.0 | 949 | $1,800 | $1.90 | 25d | 1 | 0.27mi |
| 8051 Colony Cir S #205 Tamarac, FL | 2.0 | 2.0 | 949 | $1,650 | $1.74 | 14d | 1 | 0.27mi |
| 8027 Lagos de Campo Blvd Unit A4 Tamarac, FL | 3.0 | 2.5 | 1230 | $3,000 | $2.44 | 25d | 1 | 0.29mi |
| 7820 Colony Cir S #109 Tamarac, FL | 2.0 | 2.0 | 949 | $1,725 | $1.82 | 21d | 1 | 0.30mi |
| 7910 Colony Cir N #308 Tamarac, FL | 1.0 | 1.5 | 750 | $1,600 | $2.13 | 25d | 1 | 0.30mi |
| 7900 Colony Cir S #303 Tamarac, FL | 1.0 | 1.5 | 750 | $1,680 | $2.24 | 25d | 1 | 0.30mi |
| 8000 Colony Cir S Tamarac, FL | 2.0 | 2.0 | 949 | $1,875 | $1.98 | 20d | 2 | 0.31mi |
| 8000 S Colony Cir Apt S305 Tamarac, FL | 2.0 | 2.0 | 949 | $1,800 | $1.90 | 6d | 1 | 0.31mi |
| 8000 Colony Cir S #309 Tamarac, FL | 2.0 | 2.0 | 949 | $1,950 | $2.05 | 25d | 1 | 0.31mi |
| 8000 Colony Cir S #305 Tamarac, FL | 2.0 | 2.0 | 949 | $1,800 | $1.90 | 8d | 1 | 0.31mi |
| 8051 S Colony Cir Apt S205 Tamarac, FL | 2.0 | 2.0 | 949 | $1,650 | $1.74 | 4d | 1 | 0.31mi |
| 8001 Fairview Dr #106 Tamarac, FL | 2.0 | 2.0 | 949 | $1,900 | $2.00 | 25d | 1 | 0.38mi |
| 8301 Sands Point Blvd Unit 306S Tamarac, FL | 1.0 | 1.5 | 850 | $1,650 | $1.94 | 18d | 1 | 0.40mi |
| 8311 Sands Point Blvd Unit 106 Tamarac, FL | 1.0 | 1.5 | 825 | $1,750 | $2.12 | 8d | 1 | 0.40mi |
| 7900 Fairview Dr Tamarac, FL | 2.0 | 2.0 | 949 | $2,050 | $2.16 | 3d | 1 | 0.42mi |
| 7900 Fairview Dr #105 Tamarac, FL | 2.0 | 2.0 | 949 | $2,050 | $2.16 | 6d | 1 | 0.42mi |
| 6301 N University Dr Tamarac, FL | 2.0 | 2.0 | 865 | $1,925 | $2.23 | 25d | 1 | 0.51mi |
| 8205 NW 61st St Unit B202 Tamarac, FL | 2.0 | 2.0 | 1100 | $2,000 | $1.82 | 25d | 1 | 0.51mi |
| 8310 Sands Point Blvd Unit L305 Tamarac, FL | 1.0 | 1.5 | 825 | $1,600 | $1.94 | 8d | 1 | 0.52mi |
| 6361 Landings Ter #6361 Tamarac, FL | 3.0 | 2.5 | 1417 | $2,650 | $1.87 | 25d | 1 | 0.53mi |
| 6716 Cypress Walk Ter Unit 6716 Tamarac, FL | 3.0 | 2.5 | 1272 | $2,550 | $2.00 | 25d | 1 | 0.55mi |
| 8405 NW 61st St Unit D305 Tamarac, FL | 2.0 | 2.0 | 1040 | $1,770 | $1.70 | 8d | 1 | 0.57mi |
| 7107 NW 66th St Tamarac, FL | 3.0 | 2.0 | 1485 | $3,080 | $2.07 | 8d | 1 | 0.58mi |
| 5908 NW 81st Ave Tamarac, FL | 2.0 | 1.0 | 1062 | $2,100 | $1.98 | 19d | 1 | 0.59mi |
| 8601 W McNab Rd Tamarac, FL | 3.0 | 1.0–2.0 | 993 | $2,586 | $2.60 | 4d | 11 | 0.59mi |
| 6301 Landings Ter Tamarac, FL | 3.0 | 2.5 | 1417 | $2,800 | $1.98 | 17d | 1 | 0.60mi |
HOA detail condo
- Monthly dues
- $485 · $5,820/yr
- Likely covers
- watercablepool
- Assessments
- None detected in remarks — confirm with the listing agent.
Listing history 18 events
-
2026-06-18days on market $129,999 Active 99 DOM
-
2026-06-17days on market $129,999 Active 98 DOM
-
2026-06-16days on market $129,999 Active 97 DOM
-
2026-06-15days on market $129,999 Active 96 DOM
-
2026-06-13days on market $129,999 Active 94 DOM
-
2026-06-09days on market $129,999 Active 90 DOM
-
2026-06-07days on market $129,999 Active 88 DOM
-
2026-06-04days on market $129,999 Active 85 DOM
-
2026-06-03days on market $129,999 Active 84 DOM
-
2026-06-02days on market $129,999 Active 83 DOM
-
2026-06-01days on market $129,999 Active 82 DOM
-
2026-05-31days on market $129,999 Active 81 DOM
-
2026-05-17status Active
-
2026-05-04historical Active Under Contract
-
2026-04-10price $129,999
-
2025-12-16$135,000 Active
-
2002-01-16soldstatus $62,500
-
1995-03-27soldstatus $46,000
ⓘ Source: listings_history table (triggers on properties + properties_extension) + one-shot
backfill from property_details.listing_events for pre-trigger history.
Tax reassessment forecast FL · Resets to sale price
- Current annual tax
- $3,613 · $301/mo
- Projected year-2 tax
- $3,613 · $301/mo
- Expected delta
- $0/yr ($0/mo · 0.0%)
ⓘ Screening estimate from a state-policy table — verify with the county assessor before closing.
Nearby sold comps map
Loading sold comps map…
Walkable amenities ~0.75 mi
Loading nearby amenities…
Taxation est. · year 1
- Rental income
- $24,082
- − Mortgage interest
- −$7,282
- − Property taxes
- −$3,613
- − Insurance
- −$650
- − Repairs & maintenance
- −$1,927
- − Management
- −$1,927
- − HOA
- −$5,820
- − Depreciation
- −$3,782
- Taxable loss
- −$918
- Est. tax savings @ 24.0%
- +$220
- After-tax cash flow
- $981/yr
For passive investors: Depreciation is non-cash, so a rental often shows a tax loss while cash-flowing — sheltering income. Rental losses are passive: they offset passive income freely, and up to $25,000/yr can offset ordinary (W-2) income if you actively participate and your MAGI is under $100k (phasing out to $0 by $150k); unused losses carry forward. On sale, claimed depreciation is recaptured at up to 25%, and gains may owe capital-gains tax (a 1031 exchange can defer both). Figures are a year-1 estimate at your 24.0% rate — not tax advice; consult a CPA.
Schools (NCES district)
- District
- Broward
- NCES district ID
- 1200180
- Math proficiency
- 42% ▼ -18.00%
- Reading proficiency
- 53% ▼ -5.00%
- Median HH income
- $52,139
- Composite
- 40.88/100
- National rank
- #3621
- State rank
- #46 of 73 in FL
Livability — Tamarac
- Score
- 76/100
- State rank
- #239
- US rank
- #3785
Category grades
Schools grade is shown separately in the Schools card above.
Census & demographics
- Census place
- Tamarac, FL
- County
- Broward County · 1,963,430 people
- City population
- 105,666
- Metro
- Miami-Fort Lauderdale-Pompano Beach, FL
- Population (ZIP)
- 51,216
- Household income
- $62,066
- Rent vs Own
- Severe rent burden
- 1394.0
Population outlook (Broward County) Hauer SSP2
- Today (2025)
- 2,207,033 people
- By 2030
- 2,360,704 · +7.0%
- By 2040
- 2,661,208 · +20.6%
- By 2050
- 2,946,698 · +33.5%
- By 2075
- 3,602,273 · +63.2%
- By 2100
- 3,970,984 · +79.9%
Race, ethnicity, and origin ACS 2023
- Neighborhood character
- Highly diverse neighborhood (Simpson 0.70)
- Race & ethnicity
- Hispanic / Latino 34% White 33% Black 27% Two or more races 20% Asian 3%
- Hispanic origin (detail)
- Mexican 2% Puerto Rican 5% Cuban 5% Dominican 3%
- Common ancestry
- Romanian 3% Hispanic 3% Scotch-Irish 2%
- Foreign-born
- 38% · Canada, Jamaica, Dominican Republic
- Languages at home
- 63% English-only · Spanish 29% French/Haitian/Cajun 4% Other Indo-European 1%
Political lean MEDSL · Broward
- 2024 margin
- D (+17.0) · D 58.0% · R 41.0%
- 2008→2024 swing
- -17.8pp toward R · 2008: 34.7pp · 2024: 17.0pp
- All cycles
- 2024: D+17.0 2020: D+29.8 2016: D+35.0 2012: D+34.9 2008: D+34.7
Not yet ingested
- Civics
- —
Market trends
- HPI YoY
- ▼ -158.63%
- Current HPI
- 362.2989
- Rent YoY
- ▼ -1.86%
- Metro
- Miami-Fort Lauderdale-Pompano Beach, FL
- State GDP YoY
- ▲ 3.28%
- F500 in state
- 36
Industry mix (Fortune 500 HQ in FL)
| Industry | F500 HQs | Revenue |
|---|---|---|
| Industrial Technology | 2 | $29B |
|
||
| Insurance | 2 | $17B |
|
||
| Retail | 1 | $60B |
|
||
| Technology Distribution | 1 | $58B |
|
||
| Homebuilding | 1 | $35B |
|
||
| Technology Manufacturing | 1 | $35B |
|
||
Price history
+182.6% since first listed6 events — show timeline
- 2026-05-17 Relisted — Beaches MLS
- 2026-05-04 Contingent — Beaches MLS
- 2026-04-10 Price Changed $129,999 Beaches MLS
- 2025-12-16 Listed $135,000 Beaches MLS
- 2002-01-16 Sold (Public Records) $62,500 Public Records
- 1995-03-27 Sold (Public Records) $46,000 Public Records
Property tax history
+10.1%/yrLatest (2025): $3,613 · +6.0% YoY. Source: county tax records.
Cash-flow waterfall
monthlySold comps — $/sqft
last 12 mo · ≤1 miLoading sold comps…