3 Hedgerow Cmn · Weston, CT
Flood risk 1/10 · Minimal
- FEMA flood zone
- X (unshaded)
- Chance of flooding over 30 yrs
- 0.0%
- Est. flood insurance / yr
- $473 – $860
Fire risk 1/10 · Minimal
- Est. fire insurance / yr
- $829 – $1,539
Heat risk 5/10 · Moderate
- Hot days now (above 99°F)
- 7 days/yr
- Hot days in 30 yrs
- 15 days/yr
Wind risk 6/10 · Moderate
- Chance of severe wind over 30 yrs
- 27.0%
Air-quality risk 4/10 · Minor
- Unhealthy air days now
- 3 days/yr
- Unhealthy air days in 30 yrs
- 5 days/yr
Risk factors via First Street. Map © Google.
Why this score? — see what drove the D+ grade
The composite is a weighted blend of 9 inputs, each scored 0–100. Each bar is that input's sub-score; the figure is the points it added to the 100-point composite (weight × sub-score).
- Cash flow +14.4/30.0
- ARV discount +11.3/15.0
- Schools +7.5/10.0
- DSCR +4.4/10.0
- 1% rule +3.9/10.0
- Rent growth +2.5/5.0
- Livability +2.5/5.0
- Condition / age +2.5/5.0
- Appreciation +0.0/10.0
$2,000,000
🖨 Deal sheet 📄 Offer letter ✓ Due diligence
Listing remarks
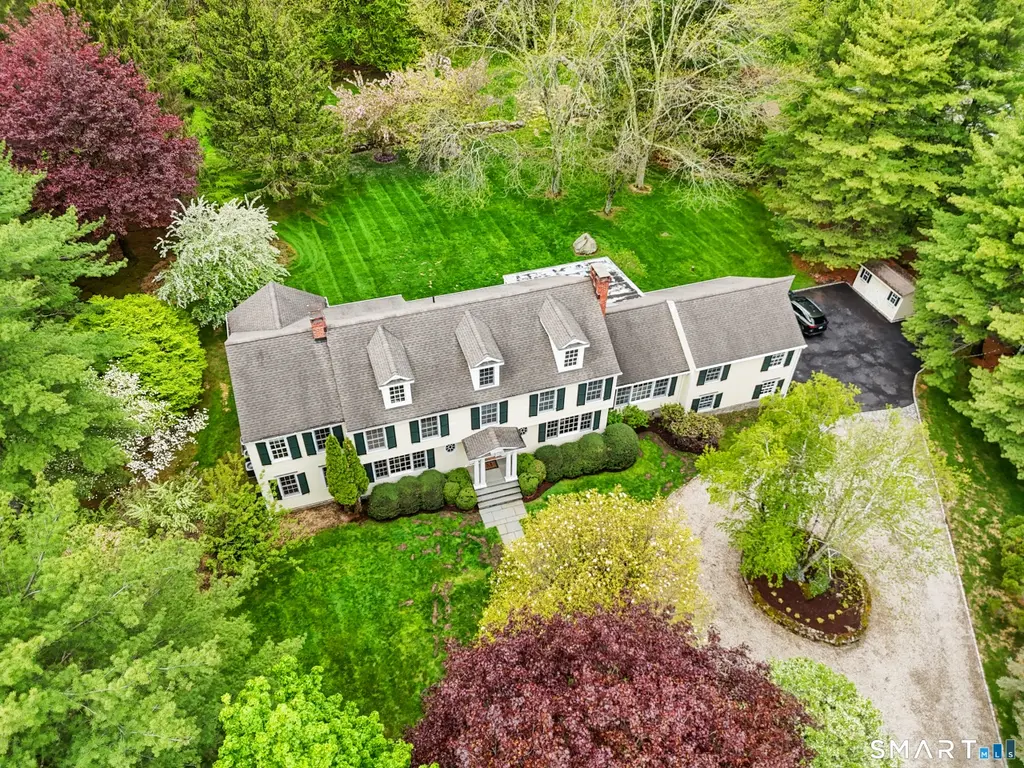
* * THANK YOU FOR YOUR INTEREST, SELLER REQUESTS HIGHEST/BEST OFFERS BY 4PM MONDAY 5/11/26 * * Set on picture-perfect, park-like property near the end of one of Lower Weston's most treasured cul-de-sacs, this expanded & beautifully remodeled Colonial offers every feature for a gracious, comfortable lifestyle, within walking distance of the school campus, library, town center, & minutes to the Merritt Parkway and Westport's vibrant shopping & dining. A circular drive, specimen landscaping and architectural details create exceptional curb appeal. The large foyer opens to a front-to-back LR w/ the first of five fireplaces and French doors framing serene views. The stunning
Key facts
- 2 acre lot
- 2 garage spots
- Built 1976
Property features AI
Exterior
- Parking: Attached garage; Two-car garage
- Utilities: Private well water; Septic sewage system; Domestic hot water (oil)
- Home design: Single family home; Cream-colored exterior
- Construction: Frame construction; Asphalt shingle roof; Concrete foundation
- Exterior features: Porch; Deck; Gutters; Exterior lighting; Stone wall; French doors; Level lot on a cul-de-sac; Professionally landscaped; Beach rights
Interior
- Kitchen: Gas cooktop; Wall oven; Microwave; Refrigerator; Freezer; Sub-Zero refrigerator; Icemaker; Dishwasher
- Bedrooms: Six bedrooms
- Bathrooms: Four full bathrooms; One half bathroom
- Heating & cooling: Central air with zoned cooling; Hot water heat (zoned) fueled by oil; Oil tank located in basement; Thermopane windows for energy efficiency
- Interior features: Auto garage door opener; Cable available; Security system; Possible in-law apartment with over-garage access; Five fireplaces; Has attic with storage space and pull-down stairs; Basement is full, partially finished, heated, provides storage, interior and garage access, and includes livable space
- Laundry & utility: Washer and dryer included; Laundry room on lower level
Neighborhood map
What this means for you Summary
Snapshot
- This is a 6-bed/4.5-bath single-family listed at $2.00M.
Deal economics
- At list price, monthly cash flow is $418 ($5k/yr) — positive.
- The deal already cash-flows at list — no discount required.
- To meet the 1% rule (rent ≥ 1% of price), the offer needs to be $1.78M (11.0% below list).
- Recommended offer: $1.78M (11.0% below list) — sets the bar for 1% rule.
- Cap rate 6.5% vs local median 3.1% in Weston — top-decile yield for the area; either an underpriced asset or a hidden risk that comps aren't pricing in. Stress-test before assuming the spread holds.
Location & tenants
- Location reads: area grade D — affects rentability + tenant quality, not the cash-flow math above.
- Weston School District (suburban): math 68% / reading 77% proficiency, ranked #4 of 153 in CT (top 3%) — strong family-tenant draw, lease renewals of 3-5y typical; only 1% free/reduced lunch — higher-income household profile.
- Zoned schools: Hurlbutt Elementary School (473 students, 1% FRL); Weston High School (math 82% / reading 87%, grade A, #1 of 194 statewide, top 1%, 722 students, 1% FRL) — zoned schools at 1% FRL track the district average.
- Zoned-school proficiency averages 84% at this address vs 72% district-wide (+12 pts) — the actual schools serving this property are materially stronger than the Weston School District average implies; a family-tenant draw the district grade alone would hide.
- Market conditions: 73 active listings in the ZIP; 2 comparable units currently listed for rent nearby; 1,151 units permitted in Western Connecticut Planning Region in 2024 (714 in 5+ unit buildings).
Forward outlook
- Local home prices are declining (-3.0%/yr); year-one equity from $14k of loan paydown is wiped out by about $60k of value loss. Plan a longer hold.
Negotiation context
- Only 14 days on market — expect competitive offers; lowballing is unlikely to land.
- Current owner paid $999k; list at $2.00M implies a 100% gain — meaningful room to come down on a strong offer.
Risks & watch-outs
- Climate carrying-cost: major wind risk, 27% chance of damaging wind over 30y; extreme-heat days projected 7→15/yr by 2055 (HVAC capex compounding) — expect insurance premiums to compound above CPI over the hold.
Questions for the listing agent
- Built in 1976 — when were the roof, HVAC, electrical panel, plumbing, and water heater last replaced?
- Is there a deadline driving the sale (1031 exchange, divorce, estate, relocation)? That informs how much negotiation room exists.
- The area grade is low — what's the realistic commute time and amenity access for the typical tenant pool here? Any planned neighborhood developments (good or bad) we should know about?
- What's the average days-on-market for RENTAL listings here right now (not sales)? A rising rental-DOM trend means longer vacancies and softer asking-rent achievability than the comps imply.
- What's the recent tenant-quality profile in this submarket — average credit score on applications, eviction rate, late-payment / NSF rate, and stable-employment percentage? A property-management company in the area should have these aggregated.
- How much new for-sale + rental construction is in the pipeline within 1–3 miles? Heavy new supply typically softens prices + rents 12–24 months out; constrained supply supports both.
Investment metrics
- 1% rule
- 0.89% ✗
- Cap rate
- 6.54%
- Cash-on-cash
- 0.90%
- DSCR
- 1.04
- GRM
- 9.4
CMA / ARV
- ARV (median comp)
- $2,183,884
- List price
- $2,000,000
- Delta
- -8.42%
- Verdict
- FAIR
- Comps
- 20 within 1.0 mi
Show comp detail 4 sales within ~0.75 mi
| Address | Dist | Beds/Ba | Sqft | Sold | Price | $/sf | Match |
|---|---|---|---|---|---|---|---|
| 4 Hedgerow Cmn | 0.14mi | 5/4.5 (-1) | 4,738 (+2%) | 12mo | $2,000,000 | $422 | 76 |
| 83 Kettle Creek Rd | 0.66mi | 5/4.5 (-1) | 4,447 (-5%) | 12mo | $2,150,000 | $483 | 47 |
| 4 Deer Path Rd | 0.38mi | 5/3.5 (-1) | 4,106 (-12%) | 23mo | $2,000,000 | $487 | 34 |
| 97 Kettle Creek Rd | 0.52mi | 5/4.5 (-1) | 5,156 (+11%) | 24mo | $2,200,000 | $427 | 33 |
Match score weights: distance 35% · size 25% · config 20% · recency 20%. Top-matched comps best support the ARV.
Projected returns pro-forma
-3.0% appreciation · 3.0% rent growth · sell at horizon
- IRR
- -14.9%
- Equity multiple
- 0.47×
- Total profit
- $-297,278
- Equity at exit
- $298,207
- IRR
- -6.2%
- Equity multiple
- 0.60×
- Total profit
- $-223,900
- Equity at exit
- $172,923
Cash invested: $560,000 (down + closing). Projections, not guarantees.
Landlord ↔ Tenant lean methodology
- Overall (STATE)
- 27 Tenant-Leaning
- State Connecticut
- 27 Tenant-Leaning · D+7
- County
- — inherits STATE
- City
- — inherits STATE
ZIP-level market 06883
- Active inventory
- 73
- Price-to-rent
- 9.4×
Monthly cashflow live
- Estimated rent
- $17,803 medium interval (Pro) →
- Mortgage (P&I)
- −$10,488
- Tax from tax record
- −$2,324 /mo · $27,890/yr
- Insurance
- −$833
- HOA
- −$0
- Vacancy / Maint / Mgmt
- −$3,739
- Net cashflow
- $418
Break-even live
UW: 25.0% down · 7.5% · 30yr · 1.5% tax · 5.0% vac · 8.0% maint · 8.0% mgmt
Financing live
Cash to close
- Down payment
- $500,000
- Closing costs
- $60,000
- Reserves months
- —
- Total cash needed
- —
Loan-product check · same deal, 3 products live
Conventional
25% down · 7.5% · 30yr
- Down + closing
- —
- Monthly P&I
- —
- Monthly cashflow
- —
- DSCR
- —
- Eligible?
- —
Personal DTI + credit; lowest rate.
DSCR
20% down · 8.5% · 30yr
- Down + closing
- —
- Monthly P&I
- —
- Monthly cashflow
- —
- DSCR
- —
- Eligible?
- —
No personal income docs; deal must DSCR.
Hard money
10% down · 12.0% · 12mo
- Down + closing
- —
- Monthly P&I
- —
- Monthly cashflow
- —
- DSCR
- —
- Eligible?
- —
Short-term bridge; refi at stabilization.
Rent comps 2 comps
| Address | Beds | Baths | Sqft | Rent | $/sqft | DOM | Units | Dist |
|---|---|---|---|---|---|---|---|---|
| 7 Joanne Ln Weston, CT | 5.0 | 4.5 | 3263 | $8,500 | $2.60 | 43d | 1 | 0.53mi |
| 37 Beaverbrook Rd Weston, CT | 5.0 | 4.5 | 6734 | $35,000 | $5.20 | 43d | 1 | 0.97mi |
Listing history 5 events
-
2026-05-14historical Under Contract - Continue to Show 1530-char remark
-
2026-05-07$2,000,000 Active 1530-char remark
-
2026-05-06historical $2,000,000 1530-char remark
-
2001-08-01soldstatus $999,250
-
1991-08-01soldstatus $522,000
ⓘ Source: listings_history table (triggers on properties + properties_extension) + one-shot
backfill from property_details.listing_events for pre-trigger history.
Tax reassessment forecast CT · Partial reset (capped growth)
- Current annual tax
- $27,890 · $2,324/mo
- Projected year-2 tax
- $35,345 · $2,945/mo
- Expected delta
- +$7,455/yr (+$621/mo · 26.7%)
ⓘ Screening estimate from a state-policy table — verify with the county assessor before closing.
Climate risk First Street
- Flood 1/10 Low FEMA zone X (unshaded) · 0% chance over 30 yrs
- Wildfire 1/10 Low
- Heat 5/10 Major 7 d/yr ≥99°F today · 15 d/yr by 30 yrs out
- Wind 6/10 Major 27% chance of damaging wind over 30 yrs
- Air quality 4/10 Moderate 3 unhealthy d/yr today · 5 by 30 yrs out
Nearby sold comps map
Loading sold comps map…
Walkable amenities ~0.75 mi
Loading nearby amenities…
Taxation est. · year 1
- Rental income
- $213,632
- − Mortgage interest
- −$112,031
- − Property taxes
- −$27,890
- − Insurance
- −$10,000
- − Repairs & maintenance
- −$17,091
- − Management
- −$17,091
- − Depreciation
- −$58,182
- Taxable loss
- −$28,652
- Est. tax savings @ 24.0%
- +$6,877
- After-tax cash flow
- $11,897/yr
For passive investors: Depreciation is non-cash, so a rental often shows a tax loss while cash-flowing — sheltering income. Rental losses are passive: they offset passive income freely, and up to $25,000/yr can offset ordinary (W-2) income if you actively participate and your MAGI is under $100k (phasing out to $0 by $150k); unused losses carry forward. On sale, claimed depreciation is recaptured at up to 25%, and gains may owe capital-gains tax (a 1031 exchange can defer both). Figures are a year-1 estimate at your 24.0% rate — not tax advice; consult a CPA.
Schools (NCES district)
- District
- Weston School District
- NCES district ID
- 0905010
- Math proficiency
- 68% ▼ -6.00%
- Reading proficiency
- 77% ▼ -1.00%
- Median HH income
- $194,414
- Composite
- 75.21/100
- National rank
- #137
- State rank
- #4 of 153 in CT
Livability — Weston
No livability data for this city. (Only ~50 U.S. cities are tracked.)
Census & demographics
- Census place
- Weston, CT
- Population (ZIP)
- 10,335
Population outlook (Western Connecticut County) Hauer SSP2
- By 2040
- 685,031
Race, ethnicity, and origin ACS 2023
- Neighborhood character
- Predominantly White (78%)
- Race & ethnicity
- White 78% Two or more races 10% Hispanic / Latino 9% Asian 5% Black 3%
- Hispanic origin (detail)
- Mexican 1% Puerto Rican 2% Dominican 1% Salvadoran 2%
- Common ancestry
- Romanian 7% Scotch-Irish 5% Italian 5%
- Foreign-born
- 16% · Canada, China, Dominican Republic
- Languages at home
- 83% English-only · Spanish 5% Chinese 3% Other Indo-European 3%
Political lean MEDSL · Western Connecticut
- 2024 margin
- D (+19.1) · D 58.8% · R 39.7% · Other 1.6%
- All cycles
- 2024: D+19.1
Not yet ingested
- Civics
- —
Market trends
- HPI YoY
- ▼ -316.44%
- Current HPI
- 208.835
- Rent YoY
- —
- Metro
- —
- State GDP YoY
- ▲ 1.06%
- F500 in state
- 38
Industry mix (Fortune 500 HQ in CT)
| Industry | F500 HQs | Revenue |
|---|---|---|
| Industrial Machinery | 4 | $38B |
|
||
| Insurance | 3 | $71B |
|
||
| Financial Services | 2 | $25B |
|
||
| Transportation / Logistics | 2 | $18B |
|
||
| Healthcare | 1 | $247B |
|
||
| Telecommunications | 1 | $55B |
|
||
Price history
+283.1% since first listed6 events — show timeline
- 2026-05-21 Pending — Smart MLS
- 2026-05-14 Contingent — Smart MLS
- 2026-05-07 Listed $2,000,000 Smart MLS
- 2026-05-06 Coming Soon $2,000,000 Smart MLS
- 2001-08-01 Sold (Public Records) $999,250 Public Records
- 1991-08-01 Sold (Public Records) $522,000 Public Records
Property tax history
+1.7%/yrLatest (2023): $27,890 · +0.3% YoY. Source: county tax records.
Cash-flow waterfall
monthlySold comps — $/sqft
last 12 mo · ≤1 miLoading sold comps…