5610 Netherland Ave Unit 1A · New York, NY
Flood risk 1/10 · Minimal
- FEMA flood zone
- X (unshaded)
- Chance of flooding over 30 yrs
- 0.0%
- Est. flood insurance / yr
- $507 – $1,088
Fire risk 1/10 · Minimal
- Est. fire insurance / yr
- $691 – $1,283
Heat risk 6/10 · Moderate
- Hot days now (above 99°F)
- 7 days/yr
- Hot days in 30 yrs
- 15 days/yr
Wind risk 6/10 · Moderate
- Chance of severe wind over 30 yrs
- 27.0%
Air-quality risk 3/10 · Minor
- Unhealthy air days now
- 3 days/yr
- Unhealthy air days in 30 yrs
- 4 days/yr
Risk factors via First Street. Map © Google.
Why this score? — see what drove the C- grade
The composite is a weighted blend of 9 inputs, each scored 0–100. Each bar is that input's sub-score; the figure is the points it added to the 100-point composite (weight × sub-score).
- Cash flow +18.3/30.0
- ARV discount +7.5/15.0
- DSCR +5.8/10.0
- Schools +5.0/10.0
- 1% rule +4.9/10.0
- Livability +3.8/5.0
- Condition / age +3.8/5.0
- Rent growth +2.5/5.0
- Appreciation +0.0/10.0
$262,000
🖨 Deal sheet 📄 Offer letter ✓ Due diligence
Listing remarks
Experience the perfect blend of elegance and convenience in this beautiful 2-bedroom corner unit on the 1st floor of the sought-after NETHERLAND GARDENS community!!!!!!!!!!This apartment offers a comfortable layout with spacious living area and ample closet storage. The kitchen provides functional workspace and cabinet storage, while the bedroom offers generous proportions. This a very well-run Co-op with impeccably cared-for and landscape grounds!!!!!!!!!!!!There is a private children playground and beautiful community room available to rent with kitchen. Storage also available in each building!!!!!!!Convenient to local/express buses, plenty of shopping and restaurants and Metro North for
Key facts
- Cabinet storage
- Ample closet storage
- Spacious living area
Tags
Property features AI
Exterior
- Parking: Garage parking (1 space); Parking fee applies
- Utilities: Public sewer; Electricity connected; Natural gas connected
- Home design: Stock cooperative
- Construction: Brick construction
- Exterior features: Brick construction; Not waterfront
Interior
- Kitchen: Gas range; Refrigerator
- Bedrooms: Includes a first-floor bedroom
- Bathrooms: 1 full bathroom
- Heating & cooling: Natural gas heating; Wall/window air conditioning units
- Interior features: First-floor bedroom; First-floor full bathroom; Granite countertops; Unfinished basement
- Laundry & utility: Basement space (unfinished) — utility/laundry potential
Neighborhood map
What this means for you Summary
Snapshot
- This is a 2-bed/1.0-bath condo listed at $262k. Condition is rated good.
Deal economics
- At list price, monthly cash flow is $241 ($3k/yr) — positive.
- The deal already cash-flows at list — no discount required.
- To meet the 1% rule (rent ≥ 1% of price), the offer needs to be $260k (0.9% below list).
- Recommended offer: $260k (0.9% below list) — sets the bar for 1% rule.
- Cap rate 7.4% vs local median 2.6% in New York — top-decile yield for the area; either an underpriced asset or a hidden risk that comps aren't pricing in. Stress-test before assuming the spread holds.
Location & tenants
- Location reads 75/100 on livability (#268 in NY, #4,188 nationally) — a middle-class / working-renter tenant base. Strengths: amenities A+, commute A+, health & safety A; Watch: crime F, cost of living F.
- Market conditions: 200 active listings in the ZIP; 10 comparable units currently listed for rent nearby; rentals at typical pace (median 19d on market — plan ~3-4 weeks tenant-placement turnaround); solid renter incomes; 6,929 units permitted in Bronx County in 2024 (6,829 in 5+ unit buildings).
- This rent runs 30% of the median local income ($103k/yr) — at the standard rent-burdened threshold; future hikes will face affordability resistance.
Forward outlook
- Local home prices are declining (-3.0%/yr); year-one equity from $2k of loan paydown is wiped out by about $8k of value loss. Plan a longer hold.
- Bronx County population projected at +21% by 2050 — long-run rental-demand tailwind backs the buy-and-hold thesis.
Negotiation context
- Only 7 days on market — expect competitive offers; lowballing is unlikely to land.
Risks & watch-outs
- Watch-outs: built in 1949 — expect roof / HVAC / electrical / plumbing capex.
- Climate carrying-cost: major wind risk, 27% chance of damaging wind over 30y; extreme-heat days projected 7→15/yr by 2055 (HVAC capex compounding) — expect insurance premiums to compound above CPI over the hold.
Questions for the listing agent
- Built in 1949 — when were the roof, HVAC, electrical panel, plumbing, and water heater last replaced?
- Any open or pending special assessments — roof, HVAC, plumbing, elevator, façade? What's the per-unit balance and payoff schedule, and is the seller paying it off at close or rolling it to the buyer?
- Is there a deadline driving the sale (1031 exchange, divorce, estate, relocation)? That informs how much negotiation room exists.
- Schools are B-rated — typically a magnet for longer-tenancy family renters. What's the average tenant stay here, and is there a school-zone premium baked into asking?
- Crime grade is F in this area — have there been break-ins, vandalism, or insurance claims at this property in the last 3 years? What carrier currently insures it and at what premium?
- What's the average days-on-market for RENTAL listings here right now (not sales)? A rising rental-DOM trend means longer vacancies and softer asking-rent achievability than the comps imply.
- What's the recent tenant-quality profile in this submarket — average credit score on applications, eviction rate, late-payment / NSF rate, and stable-employment percentage? A property-management company in the area should have these aggregated.
- How much new apartment / multifamily construction is in the pipeline within 1–3 miles? Heavy new supply (>2% of stock underway) typically softens rents 12–24 months out; light construction supports rent growth.
Investment metrics
- 1% rule
- 0.99% ✗
- Cap rate
- 7.40%
- Cash-on-cash
- 3.94%
- DSCR
- 1.18
- GRM
- 8.4
CMA / ARV
No comps found within radius.
Projected returns pro-forma
-3.0% appreciation · 3.0% rent growth · sell at horizon
- IRR
- -10.1%
- Equity multiple
- 0.63×
- Total profit
- $-27,059
- Equity at exit
- $39,065
- IRR
- -0.7%
- Equity multiple
- 0.95×
- Total profit
- $-3,628
- Equity at exit
- $22,653
Cash invested: $73,360 (down + closing). Projections, not guarantees.
Landlord ↔ Tenant lean methodology
- Overall (CITY)
- 0 Strongly Tenant-Friendly
- State New York
- 15 Strongly Tenant-Friendly · D+10
- County
- — inherits STATE
- City New York
- 0 Strongly Tenant-Friendly · D+34
ZIP-level market 10471
- Active inventory
- 200
- Price-to-rent
- 8.4×
Monthly cashflow live
- Estimated rent
- $2,597 high interval (Pro) →
- Mortgage (P&I)
- −$1,374
- Tax est. 1.5%
- −$328 /mo · $3,930/yr
- Insurance
- −$109
- HOA
- −$0
- Vacancy / Maint / Mgmt
- −$545
- Net cashflow
- $241
Break-even live
UW: 25.0% down · 7.5% · 30yr · 1.5% tax · 5.0% vac · 8.0% maint · 8.0% mgmt
Financing live
Cash to close
- Down payment
- $65,500
- Closing costs
- $7,860
- Reserves months
- —
- Total cash needed
- —
Loan-product check · same deal, 3 products live
Conventional
25% down · 7.5% · 30yr
- Down + closing
- —
- Monthly P&I
- —
- Monthly cashflow
- —
- DSCR
- —
- Eligible?
- —
Personal DTI + credit; lowest rate.
DSCR
20% down · 8.5% · 30yr
- Down + closing
- —
- Monthly P&I
- —
- Monthly cashflow
- —
- DSCR
- —
- Eligible?
- —
No personal income docs; deal must DSCR.
Hard money
10% down · 12.0% · 12mo
- Down + closing
- —
- Monthly P&I
- —
- Monthly cashflow
- —
- DSCR
- —
- Eligible?
- —
Short-term bridge; refi at stabilization.
Rent comps 10 comps
| Address | Beds | Baths | Sqft | Rent | $/sqft | DOM | Units | Dist |
|---|---|---|---|---|---|---|---|---|
| 249 McLean Ave Unit 1B Yonkers, NY | 1.0 | 1.0 | 700 | $2,500 | $3.57 | 17d | 1 | 0.95mi |
| 36 Bruce Ave Yonkers, NY | 1.0 | 1.0 | 625 | $1,785 | $2.86 | 43d | 1 | 0.97mi |
| 106 McLean Ave Yonkers, NY | 3.0 | 1.0 | 1000 | $3,200 | $3.20 | 43d | 1 | 1.15mi |
| 117 Morris St Yonkers, NY | 1.0 | 1.0 | 700 | $2,000 | $2.86 | 5d | 1 | 1.22mi |
| 280 Hawthorne Ave Yonkers, NY | 1.0 | 1.0 | 700 | $2,100 | $3.00 | 7d | 2 | 1.24mi |
| 57 Putnam Ave Yonkers, NY | 2.0 | 1.0 | 900 | $3,000 | $3.33 | 21d | 1 | 1.24mi |
| 57 Putnam Ave Yonkers, NY | 2.0 | 1.0 | 900 | $3,000 | $3.33 | 11d | 1 | 1.24mi |
| 16 Pier St Yonkers, NY | 3.0 | 1.0 | 1000 | $3,200 | $3.20 | 15d | 1 | 1.27mi |
| 130 Harrison Ave Yonkers, NY | 1.0 | 1.0 | 650 | $1,900 | $2.92 | 43d | 1 | 1.42mi |
| 14 Highland Ave Unit 2A Yonkers, NY | 1.0 | 1.0 | 1000 | $1,500 | $1.50 | 18d | 1 | 1.43mi |
HOA detail condo
- Monthly dues
- $0 · $0/yr
- Likely covers
- landscaping
- Assessments
- None detected in remarks — confirm with the listing agent.
Listing history 5 events
-
2026-06-18days on market $262,000 Active 7 DOM
-
2026-06-17days on market $262,000 Active 6 DOM
-
2026-06-16days on market $262,000 Active 5 DOM
-
2026-06-15remarks 699-char remark
-
2026-06-15$262,000 Active 4 DOM
ⓘ Source: listings_history table (triggers on properties + properties_extension) + one-shot
backfill from property_details.listing_events for pre-trigger history.
Climate risk First Street
- Flood 1/10 Low FEMA zone X (unshaded) · 0% chance over 30 yrs
- Wildfire 1/10 Low
- Heat 6/10 Major 7 d/yr ≥99°F today · 15 d/yr by 30 yrs out
- Wind 6/10 Major 27% chance of damaging wind over 30 yrs
- Air quality 3/10 Moderate 3 unhealthy d/yr today · 4 by 30 yrs out
Nearby sold comps map
Loading sold comps map…
Walkable amenities ~0.75 mi
Loading nearby amenities…
Taxation est. · year 1
- Rental income
- $31,166
- − Mortgage interest
- −$14,676
- − Property taxes
- −$3,930
- − Insurance
- −$1,310
- − Repairs & maintenance
- −$2,493
- − Management
- −$2,493
- − Depreciation
- −$7,622
- Taxable loss
- −$1,359
- Est. tax savings @ 24.0%
- +$326
- After-tax cash flow
- $3,220/yr
For passive investors: Depreciation is non-cash, so a rental often shows a tax loss while cash-flowing — sheltering income. Rental losses are passive: they offset passive income freely, and up to $25,000/yr can offset ordinary (W-2) income if you actively participate and your MAGI is under $100k (phasing out to $0 by $150k); unused losses carry forward. On sale, claimed depreciation is recaptured at up to 25%, and gains may owe capital-gains tax (a 1031 exchange can defer both). Figures are a year-1 estimate at your 24.0% rate — not tax advice; consult a CPA.
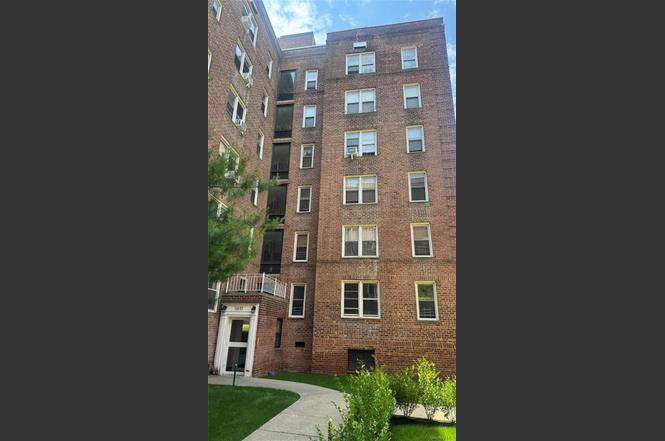
Condition & rehab AI · 1 photo
This 2-bedroom corner unit in Netherland Gardens is in good condition with a well-maintained exterior and interior. A fresh coat of paint and some minor updates would significantly enhance its resale and rental value.
Value-add opportunities
- Both Paint exterior — Enhances curb appeal and resale value
- Both Replace windows — Improves energy efficiency and resale value
- Both Upgrade HVAC system — Enhances comfort and reduces utility costs
Renovation cost estimate screening
Value-add ROI direction
- Both Paint exterior — Enhances curb appeal and resale value ↑
- Both Replace windows — Improves energy efficiency and resale value ↑
- Both Upgrade HVAC system — Enhances comfort and reduces utility costs ↑
ⓘ Cost ranges are severity-bucket heuristics (US national rule-of-thumb). Get contractor quotes + a written scope before underwriting a rehab budget.
Schools (NCES district)
No district data.
Livability — New York
- Score
- 75/100
- State rank
- #268
- US rank
- #4188
Category grades
Schools grade is shown separately in the Schools card above.
Census & demographics
- Census place
- New York, NY
- County
- Bronx County · 1,197,324 people
- City population
- 7,731,280
- Metro
- New York-Newark-Jersey City, NY-NJ-PA
- Population (ZIP)
- 23,798
- Household income
- $103,046
- Rent vs Own
- Severe rent burden
- 553.0
Population outlook (Bronx County) Hauer SSP2
- Today (2025)
- 1,607,353 people
- By 2030
- 1,681,852 · +4.6%
- By 2040
- 1,824,421 · +13.5%
- By 2050
- 1,945,470 · +21.0%
- By 2075
- 2,187,887 · +36.1%
- By 2100
- 2,244,136 · +39.6%
Race, ethnicity, and origin ACS 2023
- Neighborhood character
- Diverse neighborhood (Simpson 0.62)
- Race & ethnicity
- White 53% Hispanic / Latino 31% Two or more races 16% Black 7% Asian 4%
- Hispanic origin (detail)
- Mexican 1% Puerto Rican 8% Dominican 11%
- Common ancestry
- Scotch-Irish 4% Romanian 3% Italian 2%
- Foreign-born
- 20% · Canada, Jamaica, China
- Languages at home
- 65% English-only · Spanish 21% Russian/Polish/Slavic 4% Other Indo-European 3%
Political lean MEDSL · Bronx
- 2024 margin
- Solid D (+45.4) · D 72.7% · R 27.3%
- 2008→2024 swing
- -32.3pp toward R · 2008: 77.8pp · 2024: 45.4pp
- All cycles
- 2024: D+45.4 2020: D+67.6 2016: D+79.1 2012: D+82.9 2008: D+77.8
Not yet ingested
- Civics
- —
Market trends
- HPI YoY
- ▼ -114.80%
- Current HPI
- 197.2006
- Rent YoY
- —
- Metro
- New York-Newark-Jersey City, NY-NJ-PA
- State GDP YoY
- ▲ 2.60%
- F500 in state
- 92
Industry mix (Fortune 500 HQ in NY)
| Industry | F500 HQs | Revenue |
|---|---|---|
| Financial Services | 10 | $950B |
|
||
| Consumer Goods | 9 | $162B |
|
||
| Insurance | 4 | $225B |
|
||
| Telecommunications | 2 | $144B |
|
||
| Pharmaceuticals | 2 | $112B |
|
||
| Media / Entertainment | 2 | $69B |
|
||
Price history
1 event — show timeline
- 2026-06-11 Listed $262,000 OneKey® MLS as Distributed by MLS Grid
Cash-flow waterfall
monthlySold comps — $/sqft
last 12 mo · ≤1 miLoading sold comps…