1087 Circle Dr · Idamay, WV
Flood risk 1/10 · Minimal
- FEMA flood zone
- X (unshaded)
- Chance of flooding over 30 yrs
- 0.0%
- Est. flood insurance / yr
- $473 – $860
Fire risk 3/10 · Minor
- Est. fire insurance / yr
- $787 – $1,461
Heat risk 4/10 · Minor
- Hot days now (above 97°F)
- 7 days/yr
- Hot days in 30 yrs
- 20 days/yr
Wind risk 1/10 · Minimal
- Chance of severe wind over 30 yrs
- 1.0%
Air-quality risk 2/10 · Minimal
- Unhealthy air days now
- 0 days/yr
- Unhealthy air days in 30 yrs
- 1 days/yr
Risk factors via First Street. Map © Google.
Why this score? — see what drove the C- grade
The composite is a weighted blend of 9 inputs, each scored 0–100. Each bar is that input's sub-score; the figure is the points it added to the 100-point composite (weight × sub-score).
- Cash flow +15.0/30.0
- ARV discount +7.5/15.0
- Appreciation +6.5/10.0
- 1% rule +5.0/10.0
- DSCR +5.0/10.0
- Livability +3.5/5.0
- Schools +3.1/10.0
- Rent growth +2.5/5.0
- Condition / age +2.5/5.0
$17,900
🖨 Deal sheet 📄 Offer letter ✓ Due diligence
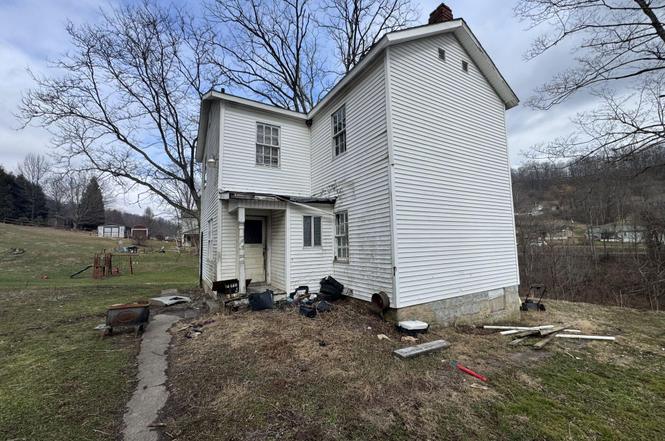
Listing remarks
Idamay home on Circle Drive. 1,566 sq ft, 1979 built. Wood siding, stone foundation, shingled roof. Hardwood and tile flooring, laminate and wood countertops. 0.57 acres.
Key facts
- Built 1979
- Listed 104 days
Property features AI
Exterior
- Home design: Residential property
- Construction: Stone foundation; Built with wood (roof listed as wood); Shingle roof
- Exterior features: Wood and shingle roof
Interior
- Flooring: Ceramic tile; Hardwood; Laminate
- Bathrooms: 1 full bathroom
- Heating & cooling: No heating; No cooling
- Interior features: Laminate counters; Ceramic tile flooring; Hardwood flooring; Laminate flooring; 6 total rooms
Neighborhood map
What this means for you Summary
Snapshot
- This is a 3-bed/1.0-bath single-family listed at $18k.
Deal economics
- At list price, monthly cash flow is $592 ($7k/yr) — positive.
- The deal already cash-flows at list — no discount required.
- Meets the 1% rule at list price ($906 rent vs $18k).
- Recommended offer: $16k (9.0% below list) — sets the bar for market timing.
Location & tenants
- Location reads 70/100 on livability (#61 in WV) — a middle-class / working-renter tenant base. Strengths: employment A+, cost of living A+, housing A+; Watch: health & safety C-, schools F, amenities F.
- Marion County Schools (town): math 30% / reading 43% proficiency, ranked #11 of 55 in WV (top 20%) — families likely to look elsewhere, expect single-tenant / working-renter base with shorter leases.
- Market conditions: 1 active listings in the ZIP; 3 units permitted in Marion County in 2024 (0 in 5+ unit buildings).
Forward outlook
- In year one you build about $659 of equity ($124 loan paydown + $535 appreciation (3.0% local appreciation)).
- At projected returns (3.0% appreciation + 3.0% rent growth), your $5k cash investment doubles in ~1 year — after that, you're playing with house money.
Negotiation context
- It's been on market 105 days — a 9% lower offer ($16k) is reasonable based on typical stale-listing flexibility.
Questions for the listing agent
- It's been on market 105 days. Have you received any prior offers? Is the seller open to a 9% concession, seller financing, or rate buy-down credit?
- Built in 1979 — when were the roof, HVAC, electrical panel, plumbing, and water heater last replaced?
- Why hasn't it sold? Are there any deal-killer items the seller is aware of (foundation, flood, title, zoning, code violations)?
- Is there a deadline driving the sale (1031 exchange, divorce, estate, relocation)? That informs how much negotiation room exists.
- Schools are F-rated, which usually means shorter tenancies and higher turnover. Who's the typical renter profile here, and what's been the actual vacancy rate?
- What's the average days-on-market for RENTAL listings here right now (not sales)? A rising rental-DOM trend means longer vacancies and softer asking-rent achievability than the comps imply.
- What's the recent tenant-quality profile in this submarket — average credit score on applications, eviction rate, late-payment / NSF rate, and stable-employment percentage? A property-management company in the area should have these aggregated.
- How much new for-sale + rental construction is in the pipeline within 1–3 miles? Heavy new supply typically softens prices + rents 12–24 months out; constrained supply supports both.
Investment metrics
- 1% rule
- 5.06% ✓
- Cap rate
- 45.97%
- Cash-on-cash
- 141.69%
- DSCR
- 7.30
- GRM
- 1.6
CMA / ARV
No comps found within radius.
Projected returns pro-forma
2.99% appreciation · 3.0% rent growth · sell at horizon
- IRR
- —
- Equity multiple
- 8.95×
- Total profit
- $39,851
- Equity at exit
- $8,038
- IRR
- —
- Equity multiple
- 18.77×
- Total profit
- $89,077
- Equity at exit
- $12,379
Cash invested: $5,012 (down + closing). Projections, not guarantees.
Landlord ↔ Tenant lean methodology
- Overall (STATE)
- 83 Strongly Landlord-Friendly
- State West Virginia
- 83 Strongly Landlord-Friendly · R+22
- County
- — inherits STATE
- City
- — inherits STATE
ZIP-level market 26576
- Home prices YoY
- 2.1%
- Active inventory
- 1
- Price-to-rent
- 1.6×
Monthly cashflow live
- Estimated rent
- $906 medium interval (Pro) →
- Mortgage (P&I)
- −$94
- Tax est. 1.5%
- −$22 /mo · $268/yr
- Insurance
- −$7
- HOA
- −$0
- Vacancy / Maint / Mgmt
- −$190
- Net cashflow
- $592
Break-even live
UW: 25.0% down · 7.5% · 30yr · 1.5% tax · 5.0% vac · 8.0% maint · 8.0% mgmt
Financing live
Cash to close
- Down payment
- $4,475
- Closing costs
- $537
- Reserves months
- —
- Total cash needed
- —
Loan-product check · same deal, 3 products live
Conventional
25% down · 7.5% · 30yr
- Down + closing
- —
- Monthly P&I
- —
- Monthly cashflow
- —
- DSCR
- —
- Eligible?
- —
Personal DTI + credit; lowest rate.
DSCR
20% down · 8.5% · 30yr
- Down + closing
- —
- Monthly P&I
- —
- Monthly cashflow
- —
- DSCR
- —
- Eligible?
- —
No personal income docs; deal must DSCR.
Hard money
10% down · 12.0% · 12mo
- Down + closing
- —
- Monthly P&I
- —
- Monthly cashflow
- —
- DSCR
- —
- Eligible?
- —
Short-term bridge; refi at stabilization.
Listing history 18 events
-
2026-06-19days on market $17,900 Active 105 DOM
-
2026-06-18days on market $17,900 Active 104 DOM
-
2026-06-17days on market $17,900 Active 103 DOM
-
2026-06-16days on market $17,900 Active 102 DOM
-
2026-06-15days on market $17,900 Active 101 DOM
-
2026-06-14days on market $17,900 Active 99 DOM
-
2026-06-13days on market $17,900 Active 98 DOM
-
2026-06-10days on market $17,900 Active 96 DOM
-
2026-06-09days on market $17,900 Active 95 DOM
-
2026-06-08days on market $17,900 Active 94 DOM
-
2026-06-07days on market $17,900 Active 93 DOM
-
2026-06-02days on market $17,900 Active 88 DOM
-
2026-06-01days on market $17,900 Active 87 DOM
-
2026-05-31days on market $17,900 Active 86 DOM
-
2026-05-30days on market $17,900 Active 85 DOM
-
2026-04-30price $17,900
-
2026-03-22price $19,900
-
2026-03-06$24,900 Active
ⓘ Source: listings_history table (triggers on properties + properties_extension) + one-shot
backfill from property_details.listing_events for pre-trigger history.
Climate risk First Street
- Flood 1/10 Low FEMA zone X (unshaded) · 0% chance over 30 yrs
- Wildfire 3/10 Moderate
- Heat 4/10 Moderate 7 d/yr ≥97°F today · 20 d/yr by 30 yrs out
- Wind 1/10 Low 100% chance of damaging wind over 30 yrs
- Air quality 2/10 Low 0 unhealthy d/yr today · 1 by 30 yrs out
Nearby sold comps map
Loading sold comps map…
Walkable amenities ~0.75 mi
Loading nearby amenities…
Taxation est. · year 1
- Rental income
- $10,868
- − Mortgage interest
- −$1,003
- − Property taxes
- −$268
- − Insurance
- −$90
- − Repairs & maintenance
- −$869
- − Management
- −$869
- − Depreciation
- −$521
- Taxable income
- $7,248
- Est. tax owed @ 24.0%
- −$1,739
- After-tax cash flow
- $5,362/yr
For passive investors: Depreciation is non-cash, so a rental often shows a tax loss while cash-flowing — sheltering income. Rental losses are passive: they offset passive income freely, and up to $25,000/yr can offset ordinary (W-2) income if you actively participate and your MAGI is under $100k (phasing out to $0 by $150k); unused losses carry forward. On sale, claimed depreciation is recaptured at up to 25%, and gains may owe capital-gains tax (a 1031 exchange can defer both). Figures are a year-1 estimate at your 24.0% rate — not tax advice; consult a CPA.
Schools (NCES district)
- District
- Marion County Schools
- NCES district ID
- 5400720
- Math proficiency
- 30% ▼ -14.00%
- Reading proficiency
- 43% ▼ -8.00%
- Median HH income
- $42,195
- Composite
- 30.8/100
- National rank
- #6145
- State rank
- #11 of 55 in WV
Livability — Idamay
- Score
- 70/100
- State rank
- #61
- US rank
- #7457
Category grades
Schools grade is shown separately in the Schools card above.
Census & demographics
- Census place
- Idamay, WV
- City population
- 712
- Population (ZIP)
- 712
Population outlook (Marion County) Hauer SSP2
- Today (2025)
- 56,923 people
- By 2030
- 56,850 · -0.1%
- By 2040
- 56,469 · -0.8%
- By 2050
- 56,027 · -1.6%
- By 2075
- 55,509 · -2.5%
- By 2100
- 51,082 · -10.3%
Race, ethnicity, and origin ACS 2023
- Neighborhood character
- Predominantly White (86%)
- Race & ethnicity
- White 86% Two or more races 11% Hispanic / Latino 3%
- Common ancestry
- Iranian 5%
Political lean MEDSL · Marion
- 2024 margin
- Solid R (+31.2) · D 33.2% · R 64.5% · Other 2.3%
- 2008→2024 swing
- -31.7pp toward R · 2008: 0.5pp · 2024: -31.2pp
- All cycles
- 2024: R+31.2 2020: R+28.7 2016: R+33.5 2012: R+14.4 2008: D+0.5
Not yet ingested
- Civics
- —
Market trends
- HPI YoY
- ▲ 2.99%
- Current HPI
- 145.8389
- Rent YoY
- —
- Metro
- —
- State GDP YoY
- —
- F500 in state
- 0
Price history
-28.1% since first listed3 events — show timeline
- 2026-04-30 Price Changed $17,900 GVBOR
- 2026-03-22 Price Changed $19,900 GVBOR
- 2026-03-06 Listed $24,900 GVBOR
Cash-flow waterfall
monthlySold comps — $/sqft
last 12 mo · ≤1 miLoading sold comps…