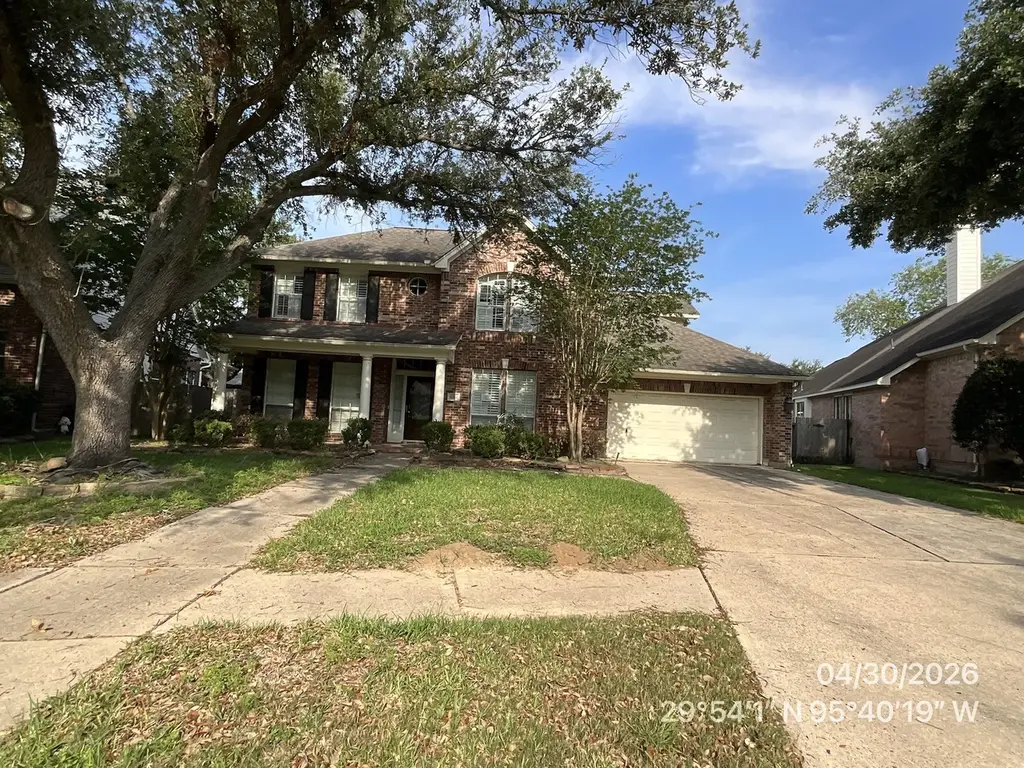
8322 Castle Pond Ct · Houston, TX
Flood risk 1/10 · Minimal
- FEMA flood zone
- X (unshaded)
- Chance of flooding over 30 yrs
- 0.0%
- Est. flood insurance / yr
- $507 – $1,088
Fire risk 1/10 · Minimal
- Est. fire insurance / yr
- $1,222 – $2,270
Heat risk 9/10 · Severe
- Hot days now (above 110°F)
- 7 days/yr
- Hot days in 30 yrs
- 23 days/yr
Wind risk 8/10 · Major
- Chance of severe wind over 30 yrs
- 99.0%
Air-quality risk 2/10 · Minimal
- Unhealthy air days now
- 2 days/yr
- Unhealthy air days in 30 yrs
- 2 days/yr
Risk factors via First Street. Map © Google.
Why this score? — see what drove the D- grade
The composite is a weighted blend of 9 inputs, each scored 0–100. Each bar is that input's sub-score; the figure is the points it added to the 100-point composite (weight × sub-score).
- ARV discount +15.0/15.0
- Appreciation +4.5/10.0
- Cash flow +4.4/30.0
- Schools +4.4/10.0
- Livability +3.7/5.0
- Rent growth +3.0/5.0
- Condition / age +2.5/5.0
- 1% rule +2.3/10.0
- DSCR +0.0/10.0
$325,000
🖨 Deal sheet 📄 Offer letter ✓ Due diligence
Listing remarks MLS
Fantastic Weekley home on culdesac in a great neighborhood...beautiful pool with a rock slide and a stone-trimmed spa. And a nice veranda on the east side of the home, with ceiling fans and an outdoor kitchen. And wait until you see the kitchen and the master bath...you need to hurry in for this one.
Key facts
- Formal dining room
- Kitchen island
- Breakfast bar
Tags
Property features AI
Finance
- HOA & community: Member of Copper Lakes HOA with an annual fee of $1,150
Exterior
- Parking: Attached 2-car garage
- Utilities: Public water; Public sewer
- Home design: Residential property; Built in 1996; Slab foundation; Composition roof
- Construction: Brick construction
- Exterior features: Private in-ground pool; Located in a subdivision
Interior
- Bedrooms: Up to 4 bedrooms
- Bathrooms: 2 full bathrooms; 1 half bathroom
- Heating & cooling: Central heating (gas); Central electric air conditioning
- Interior features: One fireplace; Seven total rooms
Neighborhood map
What this means for you Summary
Snapshot
- This is a 4-bed/2.5-bath single-family listed at $325k.
Deal economics
- At list price, monthly cash flow is $-849 ($-10k/yr) — negative.
- To cash-flow at today's rent, offer at most $188k (42.1% below list).
- To meet the 1% rule (rent ≥ 1% of price), the offer needs to be $237k (27.1% below list).
- Recommended offer: $188k (42.1% below list) — sets the bar for cash-flow.
Location & tenants
- Location reads 74/100 on livability (#184 in TX, #4,771 nationally) — a middle-class / working-renter tenant base. Strengths: amenities A+, cost of living A+, housing A+; Watch: crime F.
- Cypress-Fairbanks ISD (suburban): math 45% / reading 52% proficiency, ranked #161 of 826 in TX (top 20%) — families likely to look elsewhere, expect single-tenant / working-renter base with shorter leases.
- Zoned schools: Aragon Middle (math 55% / reading 58%, grade B, #226 of 1,662 statewide, top 14%, 1,534 students, 47% FRL); Langham Creek H S (math 56% / reading 65%, grade C+, #268 of 1,632 statewide, top 17%, 2,781 students, 56% FRL).
- Market conditions: Rents rising (+2.1%/yr); 330 active listings in the ZIP; 7 comparable units currently listed for rent nearby; rentals leasing fast (median 8d on market — plan ~1-2 weeks tenant-placement turnaround); solid renter incomes; 29,883 units permitted in Harris County in 2024 (8,621 in 5+ unit buildings).
- This rent runs 31% of the median local income ($92k/yr) — at the standard rent-burdened threshold; future hikes will face affordability resistance.
Forward outlook
- Local home prices are declining (-0.9%/yr); year-one equity from $2k of loan paydown is wiped out by about $3k of value loss. Plan a longer hold.
- Harris County population projected at +47% by 2050 — long-run rental-demand tailwind backs the buy-and-hold thesis.
Negotiation context
- It's been on market 49 days — a 3% lower offer ($315k) is reasonable based on typical stale-listing flexibility.
- 4 sale attempts since 7y ago with the ask held roughly flat each time — persistent listings suggest the price (not the market) is what's stuck; bring a comps-based counter.
- Current owner paid $150k; list at $325k implies a 116% gain — meaningful room to come down on a strong offer.
Risks & watch-outs
- Watch-outs: property tax is 2.9% of price.
- Climate carrying-cost: severe wind risk, 99% chance of damaging wind over 30y; extreme-heat days projected 7→23/yr by 2055 (HVAC capex compounding) — expect insurance premiums to compound above CPI over the hold.
Questions for the listing agent
- What do current leases actually rent for vs. the listed asking? Can we see a recent rent roll and the last 12 months of T-12 income?
- It's been on market 49 days. Have you received any prior offers? Is the seller open to a 42% concession, seller financing, or rate buy-down credit?
- Property tax is high relative to price — has the assessment been appealed recently, and will the sale trigger a re-assessment?
- What does the HOA fee cover, when was the last increase, and are there any pending special assessments or reserve-fund shortfalls?
- Is there a deadline driving the sale (1031 exchange, divorce, estate, relocation)? That informs how much negotiation room exists.
- Schools are D-rated, which usually means shorter tenancies and higher turnover. Who's the typical renter profile here, and what's been the actual vacancy rate?
- Crime grade is F in this area — have there been break-ins, vandalism, or insurance claims at this property in the last 3 years? What carrier currently insures it and at what premium?
- The area grade is low — what's the realistic commute time and amenity access for the typical tenant pool here? Any planned neighborhood developments (good or bad) we should know about?
- What's the average days-on-market for RENTAL listings here right now (not sales)? A rising rental-DOM trend means longer vacancies and softer asking-rent achievability than the comps imply.
- What's the recent tenant-quality profile in this submarket — average credit score on applications, eviction rate, late-payment / NSF rate, and stable-employment percentage? A property-management company in the area should have these aggregated.
- How much new for-sale + rental construction is in the pipeline within 1–3 miles? Heavy new supply typically softens prices + rents 12–24 months out; constrained supply supports both.
Investment metrics
- 1% rule
- 0.73% ✗
- Cap rate
- 3.16%
- Cash-on-cash
- -11.19%
- DSCR
- 0.50
- GRM
- 11.4
CMA / ARV
- ARV (median comp)
- $408,813
- List price
- $325,000
- Delta
- -20.50%
- Verdict
- UNDERPRICED
- Comps
- 20 within 1.0 mi
Show comp detail 12 sales within ~0.75 mi
| Address | Dist | Beds/Ba | Sqft | Sold | Price | $/sf | Match |
|---|---|---|---|---|---|---|---|
| 16818 Sandestine Dr | 0.11mi | 4/3.5 | 3,293 (+4%) | 2mo | $375,000 | $114 | 84 |
| 8306 Corey Woods Ct | 0.40mi | 4/2.5 | 3,142 (-1%) | 0mo | $439,999 | $140 | 79 |
| 17007 Calm Lagoon Ct | 0.30mi | 5/3.5 (+1) | 3,046 (-4%) | 0mo | $515,000 | $169 | 70 |
| 17718 Cypress Laurel St | 0.69mi | 4/2.5 | 3,147 (-1%) | 1mo | $430,000 | $137 | 65 |
| 17411 Pinecreek Hollow Ln | 0.37mi | 4/3.5 | 2,842 (-11%) | 2mo | $449,900 | $158 | 59 |
| 8731 Birch Springs Drive Dr | 0.70mi | 4/3.0 | 3,047 (-4%) | 2mo | $425,000 | $139 | 57 |
| 17707 Retreat Ridge Ln | 0.65mi | 4/3.5 | 2,960 (-7%) | 1mo | $469,000 | $158 | 54 |
| 16510 Wellers Way | 0.67mi | 4/2.5 | 2,895 (-9%) | 1mo | $319,900 | $111 | 53 |
| 8107 Cranbrook Hollow Ln | 0.57mi | 4/3.5 | 3,491 (+10%) | 1mo | $618,000 | $177 | 53 |
| 17710 Noble Oak Ct | 0.64mi | 4/3.5 | 3,623 (+14%) | 3mo | $425,000 | $117 | 41 |
| 9007 Gable Glen Ln | 0.70mi | 4/3.5 | 3,612 (+14%) | 3mo | $525,000 | $145 | 38 |
| 8311 Brighton Lake Ln | 0.73mi | 5/3.5 (+1) | 3,629 (+14%) | 3mo | $449,900 | $124 | 31 |
Match score weights: distance 35% · size 25% · config 20% · recency 20%. Top-matched comps best support the ARV.
Projected returns pro-forma
-0.94% appreciation · 2.1% rent growth · sell at horizon
- IRR
- -20.8%
- Equity multiple
- 0.13×
- Total profit
- $-79,537
- Equity at exit
- $79,303
- IRR
- -15.2%
- Equity multiple
- -0.31×
- Total profit
- $-118,818
- Equity at exit
- $84,001
Cash invested: $91,000 (down + closing). Projections, not guarantees.
Landlord ↔ Tenant lean methodology
- Overall (STATE)
- 87 Strongly Landlord-Friendly
- State Texas
- 87 Strongly Landlord-Friendly · R+5
- County
- — inherits STATE
- City
- — inherits STATE
ZIP-level market 77095
- Home prices YoY
- -0.4%
- Rents YoY
- 2.1%
- Active inventory
- 330
- Price-to-rent
- 11.4×
Monthly cashflow live
- Estimated rent
- $2,368 high interval (Pro) →
- Mortgage (P&I)
- −$1,704
- Tax from tax record
- −$784 /mo · $9,411/yr
- Insurance
- −$135
- HOA
- −$96
- Vacancy / Maint / Mgmt
- −$497
- Net cashflow
- $-849
Break-even live
UW: 25.0% down · 7.5% · 30yr · 1.5% tax · 5.0% vac · 8.0% maint · 8.0% mgmt
Financing live
Cash to close
- Down payment
- $81,250
- Closing costs
- $9,750
- Reserves months
- —
- Total cash needed
- —
Loan-product check · same deal, 3 products live
Conventional
25% down · 7.5% · 30yr
- Down + closing
- —
- Monthly P&I
- —
- Monthly cashflow
- —
- DSCR
- —
- Eligible?
- —
Personal DTI + credit; lowest rate.
DSCR
20% down · 8.5% · 30yr
- Down + closing
- —
- Monthly P&I
- —
- Monthly cashflow
- —
- DSCR
- —
- Eligible?
- —
No personal income docs; deal must DSCR.
Hard money
10% down · 12.0% · 12mo
- Down + closing
- —
- Monthly P&I
- —
- Monthly cashflow
- —
- DSCR
- —
- Eligible?
- —
Short-term bridge; refi at stabilization.
Rent comps 7 comps
| Address | Beds | Baths | Sqft | Rent | $/sqft | DOM | Units | Dist |
|---|---|---|---|---|---|---|---|---|
| 17111 Cradle Cove Ct Houston, TX | 4.0 | 2.0 | 2445 | $2,375 | $0.97 | 7d | 1 | 0.10mi |
| 17903 Timber Crossing Ln Cypress, TX | 4.0 | 2.5 | 2532 | $2,500 | $0.99 | 7d | 1 | 0.90mi |
| 17114 Kirkland Oaks Ln Houston, TX | 4.0 | 2.5 | 2536 | $2,600 | $1.03 | 44d | 1 | 1.15mi |
| 7218 Broadelm Dr Houston, TX | 4.0 | 3.0 | 3158 | $2,400 | $0.76 | 44d | 1 | 1.15mi |
| 16303 Hickory Point Rd Houston, TX | 4.0 | 2.5 | 2556 | $2,400 | $0.94 | 3d | 1 | 1.37mi |
| 18511 Cypress Steppe Ln Cypress, TX | 4.0 | 2.0 | 2135 | $2,400 | $1.12 | 24d | 1 | 1.45mi |
| 7750 Shavano Ln Cypress, TX | 3.0 | 2.5 | 2152 | $2,065 | $0.96 | 3d | 1 | 1.46mi |
HOA detail
- Monthly dues
- $96 · $1,152/yr
- Likely covers
- pool
Listing history 29 events
-
2026-06-18days on market $325,000 Active 49 DOM
-
2026-06-17days on market $325,000 Active 48 DOM
-
2026-06-16days on market $325,000 Active 47 DOM
-
2026-06-15days on market $325,000 Active 46 DOM
-
2026-06-13days on market $325,000 Active 44 DOM
-
2026-06-13days on market $325,000 Active 43 DOM
-
2026-06-09days on market $325,000 Active 40 DOM
-
2026-06-08days on market $325,000 Active 39 DOM
-
2026-06-07pricedays on market $325,000 Active 38 DOM
-
2026-06-04days on market $342,000 Active 35 DOM
-
2026-06-03days on market $342,000 Active 34 DOM
-
2026-06-02days on market $342,000 Active 33 DOM
-
2026-06-02days on market $342,000 Active 32 DOM
-
2026-05-31days on market $342,000 Active 31 DOM
-
2026-04-30$342,000 Active 986-char remark
-
2025-12-02historical
-
2025-10-29price $460,000
-
2025-07-30$475,000 Active
-
2021-12-20soldstatus
-
2021-12-17soldstatus Sold
Show marketing remark (301 chars)
Fantastic Weekley home on culdesac in a great neighborhood...beautiful pool with a rock slide and a stone-trimmed spa. And a nice veranda on the east side of the home, with ceiling fans and an outdoor kitchen. And wait until you see the kitchen and the master bath...you need to hurry in for this one.
-
2021-11-20status Pending
Show marketing remark (301 chars)
Fantastic Weekley home on culdesac in a great neighborhood...beautiful pool with a rock slide and a stone-trimmed spa. And a nice veranda on the east side of the home, with ceiling fans and an outdoor kitchen. And wait until you see the kitchen and the master bath...you need to hurry in for this one.
-
2021-11-11status Option Pending
Show marketing remark (301 chars)
Fantastic Weekley home on culdesac in a great neighborhood...beautiful pool with a rock slide and a stone-trimmed spa. And a nice veranda on the east side of the home, with ceiling fans and an outdoor kitchen. And wait until you see the kitchen and the master bath...you need to hurry in for this one.
-
2021-10-27$425,000 Active
Show marketing remark (301 chars)
Fantastic Weekley home on culdesac in a great neighborhood...beautiful pool with a rock slide and a stone-trimmed spa. And a nice veranda on the east side of the home, with ceiling fans and an outdoor kitchen. And wait until you see the kitchen and the master bath...you need to hurry in for this one.
-
2019-06-28soldstatus
-
2019-06-27soldstatus Sold
-
2019-06-06status Pending
-
2019-05-28status Option Pending
-
2019-05-15$329,000 Active
-
1996-12-05soldstatus $150,310
ⓘ Source: listings_history table (triggers on properties + properties_extension) + one-shot
backfill from property_details.listing_events for pre-trigger history.
Tax reassessment forecast TX · Resets to sale price
- Current annual tax
- $9,411 · $784/mo
- Projected year-2 tax
- $9,411 · $784/mo
- Expected delta
- $0/yr ($0/mo · 0.0%)
ⓘ Screening estimate from a state-policy table — verify with the county assessor before closing.
Climate risk First Street
- Flood 1/10 Low FEMA zone X (unshaded) · 0% chance over 30 yrs
- Wildfire 1/10 Low
- Heat 9/10 Extreme 7 d/yr ≥110°F today · 23 d/yr by 30 yrs out
- Wind 8/10 Severe 99% chance of damaging wind over 30 yrs
- Air quality 2/10 Low 2 unhealthy d/yr today · 2 by 30 yrs out
Nearby sold comps map
Loading sold comps map…
Walkable amenities ~0.75 mi
Loading nearby amenities…
Taxation est. · year 1
- Rental income
- $28,421
- − Mortgage interest
- −$18,205
- − Property taxes
- −$9,411
- − Insurance
- −$1,625
- − Repairs & maintenance
- −$2,274
- − Management
- −$2,274
- − HOA
- −$1,152
- − Depreciation
- −$9,455
- Taxable loss
- −$15,973
- Est. tax savings @ 24.0%
- +$3,834
- After-tax cash flow
- $-6,353/yr
For passive investors: Depreciation is non-cash, so a rental often shows a tax loss while cash-flowing — sheltering income. Rental losses are passive: they offset passive income freely, and up to $25,000/yr can offset ordinary (W-2) income if you actively participate and your MAGI is under $100k (phasing out to $0 by $150k); unused losses carry forward. On sale, claimed depreciation is recaptured at up to 25%, and gains may owe capital-gains tax (a 1031 exchange can defer both). Figures are a year-1 estimate at your 24.0% rate — not tax advice; consult a CPA.
Schools (NCES district)
- District
- Cypress-Fairbanks ISD
- NCES district ID
- 4816110
- Math proficiency
- 45% ▼ -12.00%
- Reading proficiency
- 52% ▼ -2.00%
- Median HH income
- $72,025
- Composite
- 43.63/100
- National rank
- #2968
- State rank
- #161 of 826 in TX
Livability — Houston
- Score
- 74/100
- State rank
- #184
- US rank
- #4771
Category grades
Schools grade is shown separately in the Schools card above.
Census & demographics
- County
- Harris County · 4,702,590 people
- City population
- 3,226,434
- Metro
- Houston-The Woodlands-Sugar Land, TX
- Population (ZIP)
- 69,767
- Household income
- $91,594
- Rent vs Own
- Severe rent burden
- 1870.0
Population outlook (Harris County) Hauer SSP2
- Today (2025)
- 5,571,493 people
- By 2030
- 6,089,821 · +9.3%
- By 2040
- 7,142,806 · +28.2%
- By 2050
- 8,185,864 · +46.9%
- By 2075
- 10,574,329 · +89.8%
- By 2100
- 12,109,958 · +117.4%
Race, ethnicity, and origin ACS 2023
- Neighborhood character
- Highly diverse neighborhood (Simpson 0.73)
- Race & ethnicity
- White 39% Hispanic / Latino 28% Two or more races 18% Black 16% Asian 12%
- Hispanic origin (detail)
- Mexican 16% Cuban 2%
- Common ancestry
- Italian 2% Romanian 2% Lithuanian 1%
- Foreign-born
- 25% · Canada, Vietnam, Jamaica
- Languages at home
- 66% English-only · Spanish 19% Vietnamese 5% Arabic 3%
Political lean MEDSL · Harris
- 2024 margin
- Lean D (+5.5) · D 52.0% · R 46.4% · Other 1.6%
- 2008→2024 swing
- +3.9pp toward D · 2008: 1.6pp · 2024: 5.5pp
- All cycles
- 2024: D+5.5 2020: D+13.3 2016: D+12.4 2012: D+0.1 2008: D+1.6
Not yet ingested
- Civics
- —
Market trends
- HPI YoY
- ▼ -0.94%
- Current HPI
- 236.0249
- Rent YoY
- ▲ 2.10%
- Metro
- Houston-The Woodlands-Sugar Land, TX
- State GDP YoY
- ▲ 3.95%
- F500 in state
- 110
Industry mix (Fortune 500 HQ in TX)
| Industry | F500 HQs | Revenue |
|---|---|---|
| Energy | 16 | $1,198B |
|
||
| Technology | 5 | $198B |
|
||
| Engineering / Construction | 4 | $72B |
|
||
| Energy Services | 3 | $60B |
|
||
| Utilities | 3 | $41B |
|
||
| Healthcare | 2 | $330B |
|
||
Price history
+116.2% since first listed16 events — show timeline
- 2026-06-05 Price Changed $325,000 HARMLS
- 2026-04-30 Listed $342,000 HARMLS
- 2025-12-02 Listing Removed — HARMLS
- 2025-10-29 Price Changed $460,000 HARMLS
- 2025-07-30 Listed $475,000 HARMLS
- 2021-12-20 Sold (Public Records) — Public Records
- 2021-12-17 Sold (MLS) — HARMLS
- 2021-11-20 Pending — HARMLS
- 2021-11-11 Pending — HARMLS
- 2021-10-27 Listed $425,000 HARMLS
- 2019-06-28 Sold (Public Records) — Public Records
- 2019-06-27 Sold (MLS) — HARMLS
- 2019-06-06 Pending — HARMLS
- 2019-05-28 Pending — HARMLS
- 2019-05-15 Listed $329,000 HARMLS
- 1996-12-05 Sold (Public Records) $150,310 Public Records
Property tax history
+7.0%/yrLatest (2025): $9,411 · -1.8% YoY. Source: county tax records.
Cash-flow waterfall
monthlySold comps — $/sqft
last 12 mo · ≤1 miLoading sold comps…