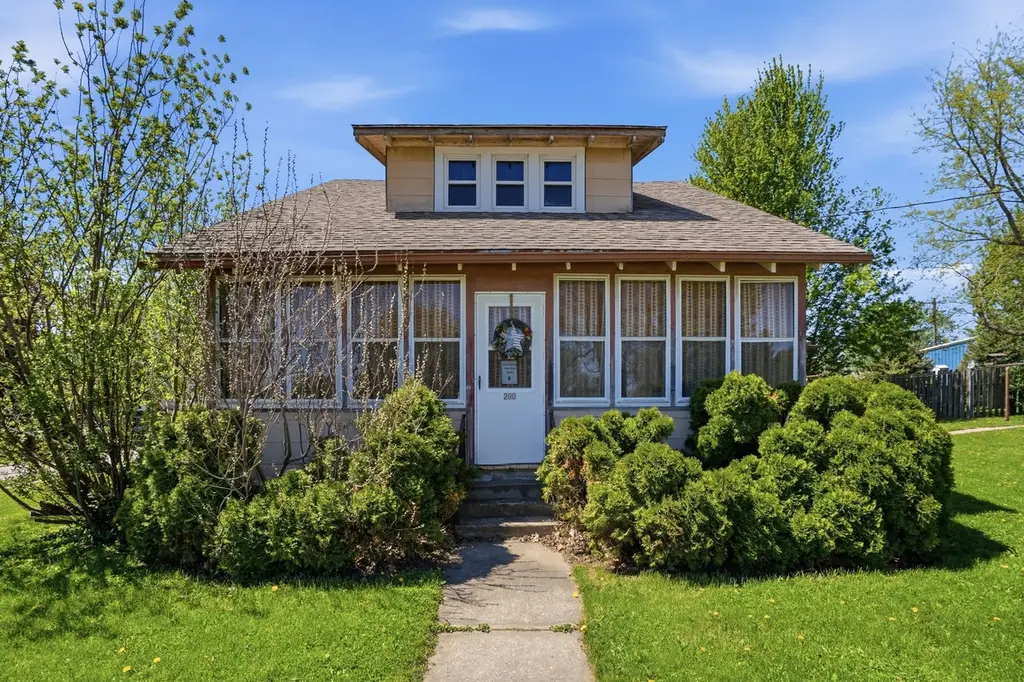
200 Sycamore Ave · Garrison, IA
Flood risk 1/10 · Minimal
- FEMA flood zone
- X (unshaded)
- Chance of flooding over 30 yrs
- 0.0%
- Est. flood insurance / yr
- $473 – $860
Fire risk 2/10 · Minimal
- Est. fire insurance / yr
- $902 – $1,676
Heat risk 3/10 · Minor
- Hot days now (above 103°F)
- 7 days/yr
- Hot days in 30 yrs
- 15 days/yr
Wind risk 2/10 · Minimal
- Chance of severe wind over 30 yrs
- —
Air-quality risk 2/10 · Minimal
- Unhealthy air days now
- 0 days/yr
- Unhealthy air days in 30 yrs
- 1 days/yr
Risk factors via First Street. Map © Google.
Why this score? — see what drove the C+ grade
The composite is a weighted blend of 9 inputs, each scored 0–100. Each bar is that input's sub-score; the figure is the points it added to the 100-point composite (weight × sub-score).
- Cash flow +26.5/30.0
- DSCR +9.1/10.0
- Appreciation +8.1/10.0
- Schools +6.6/10.0
- 1% rule +6.1/10.0
- Livability +3.0/5.0
- Rent growth +2.5/5.0
- Condition / age +2.5/5.0
- ARV discount +0.0/15.0
$94,000
🖨 Deal sheet 📄 Offer letter ✓ Due diligence
Listing remarks
Here’s your chance to get into a move-in ready home with room to make it your own over time. You’re welcomed in through a fully enclosed front porch—perfect for morning coffee or just dropping your stuff before heading inside. From there, you step into a spacious living room filled with natural light, giving you plenty of room to spread out and actually enjoy the space. The dining room flows right into the kitchen, making everyday living and entertaining easy. Upstairs, you’ll find an updated full bathroom with tile, along with comfortable bedrooms that don’t feel like an afterthought. The basement is dry and offers solid storage space—always a win. And i
Key facts
- Great yard
- Spacious living room
- Dry basement
Tags
Property features AI
Exterior
- Parking: Detached one-car garage
- Utilities: Public water; Public sewer
- Home design: 2-story property; Residential zoning
- Construction: Asbestos construction material; Asphalt shingle roof; Block foundation
- Exterior features: Concrete road surface; Storage; Enclosed porch; Screened porch
Interior
- Flooring: Carpet; Tile
- Bathrooms: 1 full bathroom; 1 half bathroom
- Heating & cooling: Gas heating (natural gas)
- Interior features: Dining area; Enclosed porch; Screened porch; Storage
Neighborhood map
What this means for you Summary
Snapshot
- This is a 2-bed/1.5-bath single-family listed at $94k.
Deal economics
- At list price, monthly cash flow is $250 ($3k/yr) — positive.
- The deal already cash-flows at list — no discount required.
- Meets the 1% rule at list price ($1k rent vs $94k).
- Recommended offer: $91k (3.0% below list) — sets the bar for market timing.
Location & tenants
- Location reads 60/100 on livability (#818 in IA) — a middle-class / working-renter tenant base. Strengths: cost of living A+, housing A+; Watch: crime C-, employment D+, schools F.
- Vinton-Shellsburg Community School District (rural): math 79% / reading 77% proficiency, ranked #43 of 289 in IA (top 15%) — strong family-tenant draw, lease renewals of 3-5y typical.
- Market conditions: 5 active listings in the ZIP; 34 units permitted in Benton County in 2024 (0 in 5+ unit buildings).
Forward outlook
- In year one you build about $7k of equity ($650 loan paydown + $6k appreciation (6.2% local appreciation)).
- Benton County population projected at -13% by 2050 — secular population decline; favor cash flow + early exit over multi-decade hold.
- At projected returns (6.2% appreciation + 3.0% rent growth), your $26k cash investment doubles in ~3 years — after that, you're playing with house money.
- By year 6, paydown + projected appreciation supports a ~$36k cash-out refi (75% LTV) — recoverable capital for the next deal without selling this one.
Negotiation context
- It's been on market 48 days — a 3% lower offer ($91k) is reasonable based on typical stale-listing flexibility.
- 4 sale attempts since 13y ago; this cycle's ask has dropped $11k (10%) from the opening price — seller is motivated, your offer sets the floor, not the list.
- Current owner paid $75k; 25% above their basis — modest negotiation headroom, anchor on the comps not their cost.
Risks & watch-outs
- Watch-outs: built in 1940 — expect roof / HVAC / electrical / plumbing capex.
Questions for the listing agent
- It's been on market 48 days. Have you received any prior offers? Is the seller open to a 3% concession, seller financing, or rate buy-down credit?
- Built in 1940 — when were the roof, HVAC, electrical panel, plumbing, and water heater last replaced?
- Is there a deadline driving the sale (1031 exchange, divorce, estate, relocation)? That informs how much negotiation room exists.
- Schools are F-rated, which usually means shorter tenancies and higher turnover. Who's the typical renter profile here, and what's been the actual vacancy rate?
- What's the average days-on-market for RENTAL listings here right now (not sales)? A rising rental-DOM trend means longer vacancies and softer asking-rent achievability than the comps imply.
- What's the recent tenant-quality profile in this submarket — average credit score on applications, eviction rate, late-payment / NSF rate, and stable-employment percentage? A property-management company in the area should have these aggregated.
- How much new for-sale + rental construction is in the pipeline within 1–3 miles? Heavy new supply typically softens prices + rents 12–24 months out; constrained supply supports both.
Investment metrics
- 1% rule
- 1.11% ✓
- Cap rate
- 9.48%
- Cash-on-cash
- 11.39%
- DSCR
- 1.51
- GRM
- 7.5
CMA / ARV
- ARV (median comp)
- $72,863
- List price
- $94,000
- Delta
- 29.01%
- Verdict
- OVERPRICED
- Comps
- 9 within 1.0 mi
Show comp detail 3 sales within ~0.75 mi
| Address | Dist | Beds/Ba | Sqft | Sold | Price | $/sf | Match |
|---|---|---|---|---|---|---|---|
| 301 S Walnut Ave | 0.32mi | 3/2.0 (+1) | 1,183 (-5%) | 2mo | $79,000 | $67 | 68 |
| 207 W Maple St | 0.10mi | 3/1.0 (+1) | 1,066 (-14%) | 20mo | $70,000 | $66 | 48 |
| 1803 61st St St | 0.51mi | 3/2.0 (+1) | 1,404 (+13%) | 17mo | $210,000 | $150 | 34 |
Match score weights: distance 35% · size 25% · config 20% · recency 20%. Top-matched comps best support the ARV.
Projected returns pro-forma
6.24% appreciation · 3.0% rent growth · sell at horizon
- IRR
- 25.3%
- Equity multiple
- 2.69×
- Total profit
- $44,371
- Equity at exit
- $60,524
- IRR
- 23.6%
- Equity multiple
- 5.47×
- Total profit
- $117,651
- Equity at exit
- $111,014
Cash invested: $26,320 (down + closing). Projections, not guarantees.
Landlord ↔ Tenant lean methodology
- Overall (STATE)
- 83 Strongly Landlord-Friendly
- State Iowa
- 83 Strongly Landlord-Friendly · R+6
- County
- — inherits STATE
- City
- — inherits STATE
ZIP-level market 52229
- Home prices YoY
- 5.0%
- Active inventory
- 5
- Price-to-rent
- 7.5×
Monthly cashflow live
- Estimated rent
- $1,042 medium interval (Pro) →
- Mortgage (P&I)
- −$493
- Tax from tax record
- −$41 /mo · $490/yr
- Insurance
- −$39
- HOA
- −$0
- Vacancy / Maint / Mgmt
- −$219
- Net cashflow
- $250
Break-even live
UW: 25.0% down · 7.5% · 30yr · 1.5% tax · 5.0% vac · 8.0% maint · 8.0% mgmt
Financing live
Cash to close
- Down payment
- $23,500
- Closing costs
- $2,820
- Reserves months
- —
- Total cash needed
- —
Loan-product check · same deal, 3 products live
Conventional
25% down · 7.5% · 30yr
- Down + closing
- —
- Monthly P&I
- —
- Monthly cashflow
- —
- DSCR
- —
- Eligible?
- —
Personal DTI + credit; lowest rate.
DSCR
20% down · 8.5% · 30yr
- Down + closing
- —
- Monthly P&I
- —
- Monthly cashflow
- —
- DSCR
- —
- Eligible?
- —
No personal income docs; deal must DSCR.
Hard money
10% down · 12.0% · 12mo
- Down + closing
- —
- Monthly P&I
- —
- Monthly cashflow
- —
- DSCR
- —
- Eligible?
- —
Short-term bridge; refi at stabilization.
Listing history 26 events
-
2026-06-18days on market $94,000 Active 48 DOM
-
2026-06-17price $94,000 Active 47 DOM
-
2026-06-17days on market $96,500 Active 47 DOM
-
2026-06-16days on market $96,500 Active 46 DOM
-
2026-06-15days on market $96,500 Active 45 DOM
-
2026-06-13days on market $96,500 Active 43 DOM
-
2026-06-12pricedays on market $96,500 Active 42 DOM
-
2026-06-09days on market $98,000 Active 39 DOM
-
2026-06-08days on market $98,000 Active 38 DOM
-
2026-06-07days on market $98,000 Active 37 DOM
-
2026-06-07days on market $98,000 Active 36 DOM
-
2026-06-04days on market $98,000 Active 33 DOM
-
2026-06-03price $98,000 Active 32 DOM
-
2026-06-02days on market $101,000 Active 32 DOM
-
2026-06-01days on market $101,000 Active 31 DOM
-
2026-05-31days on market $101,000 Active 30 DOM
-
2026-05-31days on market $101,000 Active 29 DOM
-
2026-05-14price $103,000 1016-char remark
-
2026-05-10historical $850
-
2026-05-01$105,000 Active 1016-char remark
-
2026-04-29$850
-
2024-06-18historical $850
-
2024-06-11$850
-
2013-11-06$42,900
-
2006-11-14soldstatus $75,000
-
2001-06-11soldstatus $42,500
ⓘ Source: listings_history table (triggers on properties + properties_extension) + one-shot
backfill from property_details.listing_events for pre-trigger history.
Tax reassessment forecast IA · Partial reset (capped growth)
- Current annual tax
- $490 · $41/mo
- Projected year-2 tax
- $983 · $82/mo
- Expected delta
- +$493/yr (+$41/mo · 100.6%)
ⓘ Screening estimate from a state-policy table — verify with the county assessor before closing.
Climate risk First Street
- Flood 1/10 Low FEMA zone X (unshaded) · 0% chance over 30 yrs
- Wildfire 2/10 Low
- Heat 3/10 Moderate 7 d/yr ≥103°F today · 15 d/yr by 30 yrs out
- Wind 2/10 Low
- Air quality 2/10 Low 0 unhealthy d/yr today · 1 by 30 yrs out
Nearby sold comps map
Loading sold comps map…
Walkable amenities ~0.75 mi
Loading nearby amenities…
Taxation est. · year 1
- Rental income
- $12,499
- − Mortgage interest
- −$5,265
- − Property taxes
- −$490
- − Insurance
- −$470
- − Repairs & maintenance
- −$1,000
- − Management
- −$1,000
- − Depreciation
- −$2,735
- Taxable income
- $1,539
- Est. tax owed @ 24.0%
- −$369
- After-tax cash flow
- $2,630/yr
For passive investors: Depreciation is non-cash, so a rental often shows a tax loss while cash-flowing — sheltering income. Rental losses are passive: they offset passive income freely, and up to $25,000/yr can offset ordinary (W-2) income if you actively participate and your MAGI is under $100k (phasing out to $0 by $150k); unused losses carry forward. On sale, claimed depreciation is recaptured at up to 25%, and gains may owe capital-gains tax (a 1031 exchange can defer both). Figures are a year-1 estimate at your 24.0% rate — not tax advice; consult a CPA.
Schools (NCES district)
- District
- Vinton-Shellsburg Community School District
- NCES district ID
- 1929310
- Math proficiency
- 79% ▼ -6.00%
- Reading proficiency
- 77% ▼ -1.00%
- Median HH income
- $52,023
- Composite
- 66.21/100
- National rank
- #430
- State rank
- #43 of 289 in IA
Livability — Garrison
- Score
- 60/100
- State rank
- #818
- US rank
- #18839
Category grades
Schools grade is shown separately in the Schools card above.
Census & demographics
- Census place
- Garrison, IA
- Population (ZIP)
- 841
Population outlook (Benton County) Hauer SSP2
- Today (2025)
- 25,078 people
- By 2030
- 24,606 · -1.9%
- By 2040
- 23,425 · -6.6%
- By 2050
- 21,891 · -12.7%
- By 2075
- 19,482 · -22.3%
- By 2100
- 17,139 · -31.7%
Race, ethnicity, and origin ACS 2023
- Neighborhood character
- Predominantly White (92%)
- Race & ethnicity
- White 92% Two or more races 7%
- Common ancestry
- Portuguese 5% Lithuanian 2% Italian 1%
- Foreign-born
- 0%
Political lean MEDSL · Benton
- 2024 margin
- Solid R (+33.2) · D 32.8% · R 66.0% · Other 1.3%
- 2008→2024 swing
- -37.7pp toward R · 2008: 4.5pp · 2024: -33.2pp
- All cycles
- 2024: R+33.2 2020: R+27.5 2016: R+26.0 2012: R+0.6 2008: D+4.5
Not yet ingested
- Civics
- —
Market trends
- HPI YoY
- ▲ 6.24%
- Current HPI
- 131.0495
- Rent YoY
- —
- Metro
- —
- State GDP YoY
- ▲ 2.48%
- F500 in state
- 4
Industry mix (Fortune 500 HQ in IA)
| Industry | F500 HQs | Revenue |
|---|---|---|
| Financial Services | 1 | $16B |
|
||
| Retail / Convenience | 1 | $15B |
|
||
Price history
+121.2% since first listed13 events — show timeline
- 2026-06-17 Price Changed $94,000 DMMLS
- 2026-06-10 Price Changed $96,500 DMMLS
- 2026-06-02 Price Changed $98,000 DMMLS
- 2026-05-21 Price Changed $101,000 DMMLS
- 2026-05-14 Price Changed $103,000 DMMLS
- 2026-05-10 Rental Removed $850 TURBOTENANT
- 2026-05-01 Listed $105,000 DMMLS
- 2026-04-29 Listed for Rent $850 TURBOTENANT
- 2024-06-18 Rental Removed $850 TURBOTENANT
- 2024-06-11 Listed for Rent $850 TURBOTENANT
- 2013-11-06 Listed $42,900 CRAAR, CDRMLS
- 2006-11-14 Sold (Public Records) $75,000 Public Records
- 2001-06-11 Sold (Public Records) $42,500 Public Records
Property tax history
-5.0%/yrLatest (2025): $490 · -18.3% YoY. Source: county tax records.
Cash-flow waterfall
monthlySold comps — $/sqft
last 12 mo · ≤1 miLoading sold comps…