3005 Beulah St · Houston, TX
Flood risk 1/10 · Minimal
- FEMA flood zone
- X (unshaded)
- Chance of flooding over 30 yrs
- 0.0%
- Est. flood insurance / yr
- $507 – $1,088
Fire risk 1/10 · Minimal
- Est. fire insurance / yr
- $1,222 – $2,270
Heat risk 9/10 · Severe
- Hot days now (above 109°F)
- 7 days/yr
- Hot days in 30 yrs
- 24 days/yr
Wind risk 9/10 · Severe
- Chance of severe wind over 30 yrs
- 99.0%
Air-quality risk 2/10 · Minimal
- Unhealthy air days now
- 2 days/yr
- Unhealthy air days in 30 yrs
- 2 days/yr
Risk factors via First Street. Map © Google.
Why this score? — see what drove the C grade
The composite is a weighted blend of 9 inputs, each scored 0–100. Each bar is that input's sub-score; the figure is the points it added to the 100-point composite (weight × sub-score).
- Cash flow +19.1/30.0
- ARV discount +15.0/15.0
- DSCR +6.0/10.0
- 1% rule +4.2/10.0
- Livability +3.7/5.0
- Schools +2.7/10.0
- Condition / age +2.5/5.0
- Rent growth +2.4/5.0
- Appreciation +0.0/10.0
$247,500
🖨 Deal sheet (PDF) 📄 Offer letter ✓ Due diligence
Listing remarks MLS
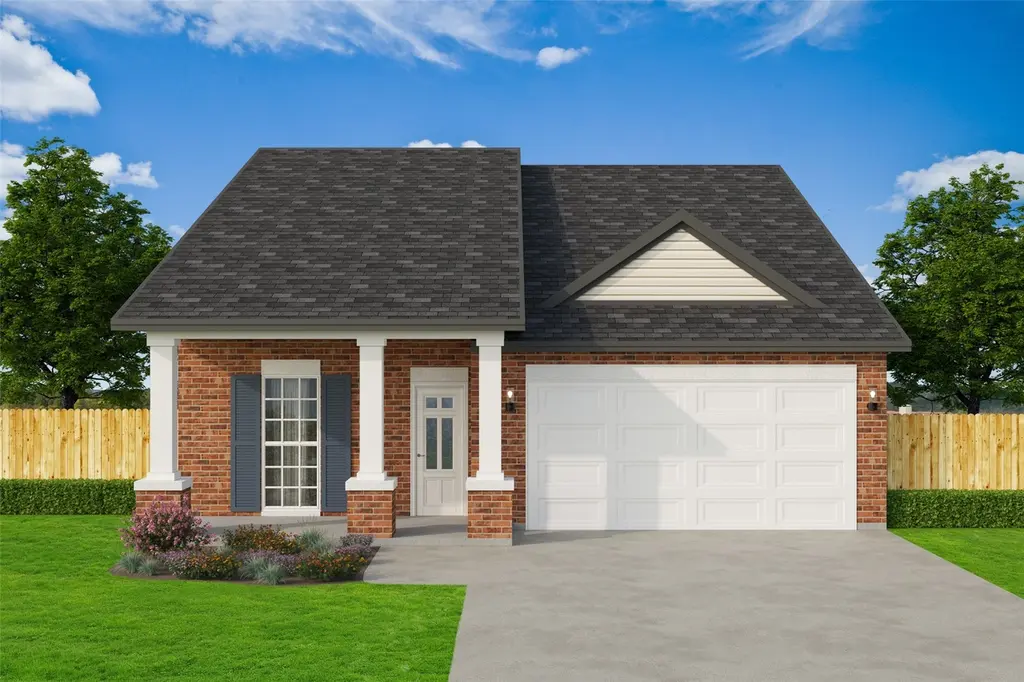
Welcome to an affordable single family one story home with a modern floor plan. This all brick beautiful home offers a functional 3 bedroom, 2 full bath with a 2 car garage. Enjoy the open concept with modern finishes throughout. This home also includes kitchen stainless steel appliances. The covered patio provides the ideal setting for outdoor gatherings and everyday enjoyment. This home is part of the Midtown Redevelopment Program, CCPPI and City of Houston to provide affordable home opportunities.
Key facts
- Modern floor plan
- Covered patio
- 5,000 sq ft lot
Tags
Neighborhood map
What this means for you Summary
Snapshot
- This is a 3-bed/2.0-bath single-family listed at $248k.
Deal economics
- At list price, monthly cash flow is $262 ($3k/yr) — positive.
- The deal already cash-flows at list — no discount required.
- To meet the 1% rule (rent ≥ 1% of price), the offer needs to be $229k (7.6% below list).
- Recommended offer: $229k (7.6% below list) — sets the bar for 1% rule.
- Cap rate 7.6% vs local median 3.1% in Houston — top-decile yield for the area; either an underpriced asset or a hidden risk that comps aren't pricing in. Stress-test before assuming the spread holds.
Location & tenants
- Location reads 74/100 on livability (#184 in TX, #4,771 nationally) — a middle-class / working-renter tenant base. Strengths: amenities A+, cost of living A+, housing A+; Watch: schools D, crime F.
- Houston ISD (urban): math 27% / reading 35% proficiency, ranked #593 of 826 in TX (top 72%) — families likely to look elsewhere, expect single-tenant / working-renter base with shorter leases; 71% free/reduced lunch — lower-income household profile, screen leases tightly.
- Market conditions: Rents soft (-0.3%/yr); 581 active listings in the ZIP; 40 comparable units currently listed for rent nearby; rentals at typical pace (median 23d on market — plan ~3-4 weeks tenant-placement turnaround); 29,883 units permitted in Harris County in 2024 (8,621 in 5+ unit buildings).
- This rent runs 39% of the median local income ($71k/yr) — at the standard rent-burdened threshold; future hikes will face affordability resistance.
Forward outlook
- Local home prices are declining (-3.0%/yr); year-one equity from $2k of loan paydown is wiped out by about $7k of value loss. Plan a longer hold.
- Harris County population projected at +47% by 2050 — long-run rental-demand tailwind backs the buy-and-hold thesis.
Negotiation context
- It's been on market 80 days — a 6% lower offer ($233k) is reasonable based on typical stale-listing flexibility.
Risks & watch-outs
- Climate carrying-cost: severe wind risk, 99% chance of damaging wind over 30y; extreme-heat days projected 7→24/yr by 2055 (HVAC capex compounding) — expect insurance premiums to compound above CPI over the hold.
Questions for the listing agent
- It's been on market 80 days. Have you received any prior offers? Is the seller open to a 8% concession, seller financing, or rate buy-down credit?
- Why hasn't it sold? Are there any deal-killer items the seller is aware of (foundation, flood, title, zoning, code violations)?
- Is there a deadline driving the sale (1031 exchange, divorce, estate, relocation)? That informs how much negotiation room exists.
- Schools are D-rated, which usually means shorter tenancies and higher turnover. Who's the typical renter profile here, and what's been the actual vacancy rate?
- Crime grade is F in this area — have there been break-ins, vandalism, or insurance claims at this property in the last 3 years? What carrier currently insures it and at what premium?
- What's the average days-on-market for RENTAL listings here right now (not sales)? A rising rental-DOM trend means longer vacancies and softer asking-rent achievability than the comps imply.
- What's the recent tenant-quality profile in this submarket — average credit score on applications, eviction rate, late-payment / NSF rate, and stable-employment percentage? A property-management company in the area should have these aggregated.
- How much new for-sale + rental construction is in the pipeline within 1–3 miles? Heavy new supply typically softens prices + rents 12–24 months out; constrained supply supports both.
Investment metrics
- 1% rule
- 0.92% ✗
- Cap rate
- 7.56%
- Cash-on-cash
- 4.54%
- DSCR
- 1.20
- GRM
- 9.0
CMA / ARV
- ARV (median comp)
- $395,565
- List price
- $247,500
- Delta
- -37.43%
- Verdict
- UNDERPRICED
- Comps
- 20 within 1.0 mi
Show comp detail 12 sales within ~0.75 mi
| Address | Dist | Beds/Ba | Sqft | Sold | Price | $/sf | Match |
|---|---|---|---|---|---|---|---|
| 2306 Hadley St | 0.60mi | 3/2.5 | 1,582 (-1%) | 3mo | $339,000 | $214 | 66 |
| 2512 Cleburne St | 0.62mi | 3/2.5 | 1,597 (-0%) | 4mo | $300,000 | $188 | 65 |
| 3508 Sauer St | 0.23mi | 3/3.5 | 1,737 (+9%) | 7mo | $375,000 | $216 | 63 |
| 2409 Webster St | 0.62mi | 3/2.5 | 1,647 (+3%) | 2mo | $397,500 | $241 | 63 |
| 3417 Tuam St | 0.45mi | 3/2.5 | 1,732 (+8%) | 7mo | $349,900 | $202 | 58 |
| 3419 Tuam St | 0.45mi | 3/2.5 | 1,732 (+8%) | 7mo | $349,000 | $202 | 58 |
| 2528 Live Oak St | 0.40mi | 3/3.5 | 1,790 (+12%) | 3mo | $382,500 | $214 | 53 |
| 1762 Aden Mist Dr | 0.70mi | 2/2.5 (-1) | 1,540 (-4%) | 2mo | $282,000 | $183 | 52 |
| 2210 Berry St | 0.58mi | 3/2.5 | 1,758 (+10%) | 5mo | $410,000 | $233 | 51 |
| 1768 Aden Dr | 0.74mi | 2/2.0 (-1) | 1,688 (+6%) | 1mo | $309,500 | $183 | 50 |
| 2524 Live Oak St | 0.41mi | 3/3.5 | 1,790 (+12%) | 7mo | $389,900 | $218 | 49 |
| 3522 Dennis St | 0.65mi | 4/2.0 (+1) | 1,778 (+11%) | 3mo | $295,000 | $166 | 44 |
Match score weights: distance 35% · size 25% · config 20% · recency 20%. Top-matched comps best support the ARV.
Projected returns pro-forma
-3.0% appreciation · 0.0% rent growth · sell at horizon
- IRR
- -12.4%
- Equity multiple
- 0.56×
- Total profit
- $-30,188
- Equity at exit
- $36,903
- IRR
- -8.1%
- Equity multiple
- 0.55×
- Total profit
- $-30,976
- Equity at exit
- $21,399
Cash invested: $69,300 (down + closing). Projections, not guarantees.
Landlord ↔ Tenant lean methodology
- Overall (STATE)
- 87 Strongly Landlord-Friendly
- State Texas
- 87 Strongly Landlord-Friendly · R+5
- County
- — inherits STATE
- City
- — inherits STATE
ZIP-level market 77004
- Rents YoY
- -0.3%
- Active inventory
- 581
- Price-to-rent
- 9.0×
Monthly cashflow live
- Estimated rent
- $2,287 high interval (Pro) →
- Mortgage (P&I)
- −$1,298
- Tax from tax record
- −$144 /mo · $1,726/yr
- Insurance
- −$103
- HOA
- −$0
- Vacancy / Maint / Mgmt
- −$480
- Net cashflow
- $262
Break-even live
Sensitivity live
| Price | -10% $402 | -5% $332 | +0% $262 | +5% $192 | +10% $122 |
|---|---|---|---|---|---|
| Rent | -10% $81 | -5% $172 | +0% $262 | +5% $352 | +10% $443 |
| Rate | -1.0pp $387 | -0.5pp $325 | base $262 | +0.5pp $198 | +1.0pp $133 |
UW: 25.0% down · 7.5% · 30yr · 1.5% tax · 5.0% vac · 8.0% maint · 8.0% mgmt
Financing live
Cash to close
- Down payment
- $61,875
- Closing costs
- $7,425
- Reserves months
- —
- Total cash needed
- —
Loan-product check · same deal, 3 products live
Conventional
25% down · 7.5% · 30yr
- Down + closing
- —
- Monthly P&I
- —
- Monthly cashflow
- —
- DSCR
- —
- Eligible?
- —
Personal DTI + credit; lowest rate.
DSCR
20% down · 8.5% · 30yr
- Down + closing
- —
- Monthly P&I
- —
- Monthly cashflow
- —
- DSCR
- —
- Eligible?
- —
No personal income docs; deal must DSCR.
Hard money
10% down · 12.0% · 12mo
- Down + closing
- —
- Monthly P&I
- —
- Monthly cashflow
- —
- DSCR
- —
- Eligible?
- —
Short-term bridge; refi at stabilization.
Rent comps 40 comps
| Address | Beds | Baths | Sqft | Rent | $/sqft | DOM | Units | Dist |
|---|---|---|---|---|---|---|---|---|
| 3229 Holman St Houston, TX | 4.0 | 4.0 | 1632 | $1,200 | $0.74 | 44d | 1 | 0.28mi |
| 3012 Live Oak St Unit A Houston, TX | 3.0 | 2.0 | 1188 | $1,395 | $1.17 | 21d | 1 | 0.28mi |
| 3015 Isabella St Houston, TX | 3.0 | 1.0 | 1452 | $1,399 | $0.96 | 0d | 1 | 0.47mi |
| 3034 Gray St Houston, TX | 3.0 | 3.0 | 2081 | $3,000 | $1.44 | 44d | 1 | 0.52mi |
| 3213 Saint Emanuel St Houston, TX | 4.0 | 3.5 | 2100 | $3,300 | $1.57 | 17d | 1 | 0.57mi |
| 3309 Webster St Unit 1472545P Houston, TX | 3.0 | 2.0 | 1334 | $3,335 | $2.50 | 0d | 1 | 0.57mi |
| 3507 Canfield St Houston, TX | 3.0 | 2.5 | 2200 | $2,350 | $1.07 | 25d | 1 | 0.60mi |
| 2209 Alabama St Unit B Houston, TX | 3.0 | 2.5 | 2074 | $2,350 | $1.13 | 44d | 1 | 0.61mi |
| 4306 Ennis St Houston, TX | 3.0 | 3.0 | 1989 | $2,500 | $1.26 | 44d | 1 | 0.66mi |
| 2401 Eagle St Houston, TX | 4.0 | 4.0 | 1700 | $2,800 | $1.65 | 44d | 1 | 0.69mi |
| 3517 McIlhenny St Houston, TX | 3.0 | 3.5 | 2000 | $3,200 | $1.60 | 4d | 1 | 0.72mi |
| 2311 Eagle St Houston, TX | 3.0 | 4.0 | 1783 | $2,500 | $1.40 | 44d | 1 | 0.72mi |
| 3719 Elgin St Houston, TX | 1.0–5.0 | 1.0–5.0 | 1241 | $1,374 | $1.11 | 25d | 14 | 0.74mi |
| 3448 Coyle St Unit 510 Houston, TX | 3.0 | 2.0 | 1151 | $1,215 | $1.06 | 16d | 1 | 0.76mi |
| 3448 Coyle St Unit 3174 Houston, TX | 3.0 | 2.0 | 1151 | $1,245 | $1.08 | 0d | 1 | 0.76mi |
| 2102 Gray St Unit Na Houston, TX | 3.0 | 1.0 | 1267 | $2,200 | $1.74 | 22d | 1 | 0.76mi |
| 3603 Chenevert St Houston, TX | 1.0–2.0 | 1.0–2.0 | 1020 | $2,129 | $2.09 | 14d | 8 | 0.81mi |
| 3609 Chenevert St Houston, TX | 2.0 | 2.0 | 1168 | $1,749 | $1.50 | 22d | 1 | 0.84mi |
| 3609 Chenevert St Houston, TX | 2.0 | 2.0 | 1168 | $1,749 | $1.50 | 20d | 1 | 0.84mi |
| 2319 Rosewood St Unit A Houston, TX | 3.0 | 1.0 | 1333 | $1,515 | $1.14 | 25d | 1 | 0.85mi |
| 2703 Blodgett St Unit 1047952P Houston, TX | 1.0–5.0 | 1.5–5.5 | 2497 | $11,718 | $4.69 | 2d | 2 | 0.86mi |
| 2809 Crawford St Houston, TX | 2.0 | 2.0 | 1928 | $2,600 | $1.35 | 44d | 1 | 0.88mi |
| 2357 Jackson St Houston, TX | 3.0 | 2.5 | 1908 | $2,500 | $1.31 | 22d | 1 | 0.89mi |
| 2216 Chenevert St Houston, TX | 1.0–2.0 | 1.5–2.5 | 1380 | $2,800 | $2.03 | 25d | 3 | 0.89mi |
| 3131 Leeland St Houston, TX | 3.0 | 3.5 | 1966 | $2,850 | $1.45 | 25d | 1 | 0.89mi |
| 1920 Hamilton St Houston, TX | 2.0 | 2.0 | 1117 | $2,160 | $1.93 | 44d | 1 | 0.96mi |
| 1800 Saint Joseph Pkwy Unit 2187 Houston, TX | 2.0 | 2.0 | 1117 | $1,780 | $1.59 | 5d | 1 | 0.97mi |
| 1800 Saint Joseph Pkwy Unit 2165 Houston, TX | 2.0 | 2.0 | 1117 | $1,775 | $1.59 | 0d | 1 | 0.97mi |
| 1800 Saint Joseph Pkwy Unit 1837 Houston, TX | 2.0 | 2.0 | 1117 | $1,769 | $1.58 | 11d | 1 | 0.97mi |
| 1800 St Joseph Pkwy Houston, TX | 1.0–2.0 | 1.0–2.0 | 950 | $1,900 | $2.00 | 8d | 3 | 0.97mi |
| 2615 Arbor St Unit 1047947P Houston, TX | 2.0 | 2.0 | 1194 | $2,346 | $1.96 | 0d | 1 | 0.97mi |
| 2615 Arbor St Unit 1047942P Houston, TX | 2.0 | 2.0 | 1194 | $2,742 | $2.30 | 22d | 1 | 0.97mi |
| 2425 Bell St Houston, TX | 2.0 | 1.0–2.0 | 860 | $2,806 | $3.26 | 0d | 72 | 0.99mi |
| 2511 Arbor St Houston, TX | 2.0 | 1.0 | 1368 | $2,450 | $1.79 | 11d | 1 | 1.00mi |
| 2307 Arbor St Houston, TX | 2.0 | 1.0 | 1325 | $2,295 | $1.73 | 44d | 1 | 1.05mi |
| 1310 Anita St Houston, TX | 2.0 | 2.0 | 1760 | $2,695 | $1.53 | 44d | 1 | 1.06mi |
| 2340 Polk St Unit EEL1 Houston, TX | 2.0 | 2.0 | 1053 | $1,775 | $1.69 | 44d | 1 | 1.11mi |
| 2111 Austin St Houston, TX | 3.0 | 1.0–2.0 | 985 | $3,095 | $3.14 | 6d | 25 | 1.13mi |
| 3000 San Jacinto St Houston, TX | 2.0 | 2.0 | 1215 | $1,826 | $1.50 | 19d | 1 | 1.14mi |
| 4704 Chenevert St Unit B Houston, TX | 2.0 | 1.0 | 1200 | $1,700 | $1.42 | 44d | 1 | 1.17mi |
Listing history 16 events
-
2026-06-18days on market $247,500 Active 80 DOM
-
2026-06-17days on market $247,500 Active 79 DOM
-
2026-06-16days on market $247,500 Active 78 DOM
-
2026-06-15days on market $247,500 Active 77 DOM
-
2026-06-13days on market $247,500 Active 75 DOM
-
2026-06-10days on market $247,500 Active 71 DOM
-
2026-06-08days on market $247,500 Active 70 DOM
-
2026-06-07days on market $247,500 Active 69 DOM
-
2026-06-04days on market $247,500 Active 66 DOM
-
2026-06-01days on market $247,500 Active 63 DOM
-
2026-05-31days on market $247,500 Active 62 DOM
-
2026-03-11$247,500 Active 505-char remark
Show marketing remark (505 chars)
Welcome to an affordable single family one story home with a modern floor plan. This all brick beautiful home offers a functional 3 bedroom, 2 full bath with a 2 car garage. Enjoy the open concept with modern finishes throughout. This home also includes kitchen stainless steel appliances. The covered patio provides the ideal setting for outdoor gatherings and everyday enjoyment. This home is part of the Midtown Redevelopment Program, CCPPI and City of Houston to provide affordable home opportunities.
-
2017-07-28soldstatus
-
2014-01-13soldstatus
-
1999-07-27soldstatus
-
1998-12-18soldstatus
ⓘ Source: listings_history table (triggers on properties + properties_extension) + one-shot
backfill from property_details.listing_events for pre-trigger history.
Tax reassessment forecast TX · Resets to sale price
- Current annual tax
- $1,726 · $144/mo
- Projected year-2 tax
- $4,529 · $377/mo
- Expected delta
- +$2,803/yr (+$234/mo · 162.4%)
ⓘ Screening estimate from a state-policy table — verify with the county assessor before closing.
Climate risk First Street
- Flood 1/10 Low FEMA zone X (unshaded) · 0% chance over 30 yrs
- Wildfire 1/10 Low
- Heat 9/10 Extreme 7 d/yr ≥109°F today · 24 d/yr by 30 yrs out
- Wind 9/10 Extreme 99% chance of damaging wind over 30 yrs
- Air quality 2/10 Low 2 unhealthy d/yr today · 2 by 30 yrs out
Nearby sold comps map
Loading sold comps map…
Walkable amenities ~0.75 mi
Loading nearby amenities…
Taxation est. · year 1
- Rental income
- $27,446
- − Mortgage interest
- −$13,864
- − Property taxes
- −$1,726
- − Insurance
- −$1,238
- − Repairs & maintenance
- −$2,196
- − Management
- −$2,196
- − Depreciation
- −$7,200
- Taxable loss
- −$972
- Est. tax savings @ 24.0%
- +$233
- After-tax cash flow
- $3,377/yr
For passive investors: Depreciation is non-cash, so a rental often shows a tax loss while cash-flowing — sheltering income. Rental losses are passive: they offset passive income freely, and up to $25,000/yr can offset ordinary (W-2) income if you actively participate and your MAGI is under $100k (phasing out to $0 by $150k); unused losses carry forward. On sale, claimed depreciation is recaptured at up to 25%, and gains may owe capital-gains tax (a 1031 exchange can defer both). Figures are a year-1 estimate at your 24.0% rate — not tax advice; consult a CPA.
Schools (NCES district)
- District
- Houston ISD
- NCES district ID
- 4823640
- Math proficiency
- 27% ▼ -18.00%
- Reading proficiency
- 35% ▼ -6.00%
- Median HH income
- $46,054
- Composite
- 26.63/100
- National rank
- #7173
- State rank
- #593 of 826 in TX
Livability — Houston
- Score
- 74/100
- State rank
- #184
- US rank
- #4771
Category grades
Schools grade is shown separately in the Schools card above.
Census & demographics
- Census place
- Houston, TX
- County
- Harris County · 4,702,590 people
- City population
- 3,226,434
- Metro
- Houston-The Woodlands-Sugar Land, TX
- Population (ZIP)
- 35,997
- Household income
- $71,199
- Rent vs Own
- Severe rent burden
- 3072.0
Population outlook (Harris County) Hauer SSP2
- Today (2025)
- 5,571,493 people
- By 2030
- 6,089,821 · +9.3%
- By 2040
- 7,142,806 · +28.2%
- By 2050
- 8,185,864 · +46.9%
- By 2075
- 10,574,329 · +89.8%
- By 2100
- 12,109,958 · +117.4%
Race, ethnicity, and origin ACS 2023
- Neighborhood character
- Diverse neighborhood (Simpson 0.68)
- Race & ethnicity
- Black 48% White 27% Hispanic / Latino 13% Two or more races 11% Asian 8%
- Hispanic origin (detail)
- Mexican 9%
- Common ancestry
- Lithuanian 1% Romanian 1% Italian 1%
- Foreign-born
- 14% · Canada, China, South Korea
- Languages at home
- 82% English-only · Spanish 10% Chinese 2% Other Indo-European 2%
Political lean MEDSL · Harris
- 2024 margin
- Lean D (+5.5) · D 52.0% · R 46.4% · Other 1.6%
- 2008→2024 swing
- +3.9pp toward D · 2008: 1.6pp · 2024: 5.5pp
- All cycles
- 2024: D+5.5 2020: D+13.3 2016: D+12.4 2012: D+0.1 2008: D+1.6
Not yet ingested
- Civics
- —
Market trends
- HPI YoY
- ▼ -139.34%
- Current HPI
- 199.6066
- Rent YoY
- ▼ -0.32%
- Metro
- Houston-The Woodlands-Sugar Land, TX
- State GDP YoY
- ▲ 3.95%
- F500 in state
- 110
Industry mix (Fortune 500 HQ in TX)
| Industry | F500 HQs | Revenue |
|---|---|---|
| Energy | 16 | $1,198B |
|
||
| Technology | 5 | $198B |
|
||
| Engineering / Construction | 4 | $72B |
|
||
| Energy Services | 3 | $60B |
|
||
| Utilities | 3 | $41B |
|
||
| Healthcare | 2 | $330B |
|
||
Price history
5 events — show timeline
- 2026-03-11 Listed $247,500 HARMLS
- 2017-07-28 Sold (Public Records) — Public Records
- 2014-01-13 Sold (Public Records) — Public Records
- 1999-07-27 Sold (Public Records) — Public Records
- 1998-12-18 Sold (Public Records) — Public Records
Property tax history
+2.5%/yrLatest (2017): $1,726 · +48.8% YoY. Source: county tax records.
Cash-flow waterfall
monthlySold comps — $/sqft
last 12 mo · ≤1 miLoading sold comps…