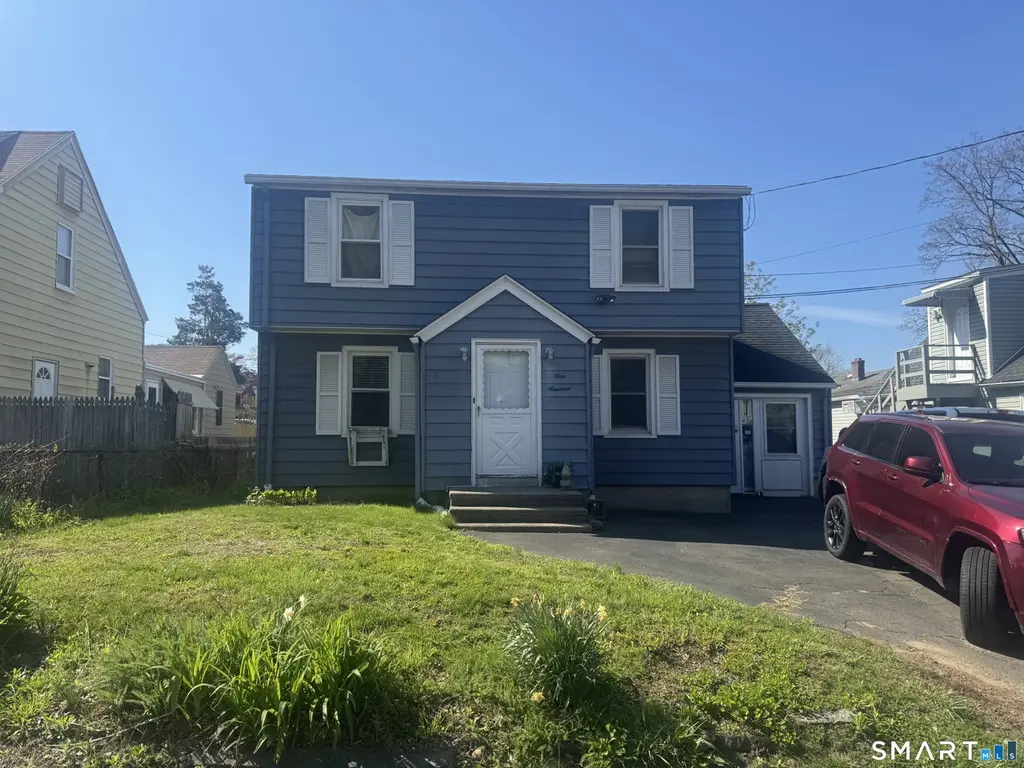
100 Winfield St · Norwalk, CT
Flood risk 1/10 · Minimal
- FEMA flood zone
- X (unshaded)
- Chance of flooding over 30 yrs
- 0.0%
- Est. flood insurance / yr
- $473 – $860
Fire risk 1/10 · Minimal
- Est. fire insurance / yr
- $829 – $1,539
Heat risk 6/10 · Moderate
- Hot days now (above 98°F)
- 7 days/yr
- Hot days in 30 yrs
- 16 days/yr
Wind risk 6/10 · Moderate
- Chance of severe wind over 30 yrs
- 75.0%
Air-quality risk 8/10 · Major
- Unhealthy air days now
- 13 days/yr
- Unhealthy air days in 30 yrs
- 18 days/yr
Risk factors via First Street. Map © Google.
Why this score? — see what drove the C- grade
The composite is a weighted blend of 9 inputs, each scored 0–100. Each bar is that input's sub-score; the figure is the points it added to the 100-point composite (weight × sub-score).
- Cash flow +16.8/30.0
- ARV discount +15.0/15.0
- DSCR +5.2/10.0
- 1% rule +4.1/10.0
- Livability +3.9/5.0
- Schools +3.4/10.0
- Condition / age +2.5/5.0
- Rent growth +2.3/5.0
- Appreciation +0.0/10.0
$549,000
🖨 Deal sheet 📄 Offer letter ✓ Due diligence
Listing remarks
Welcome to 100 Winfield Street, a charming Cape Cod-style home in the highly coveted East Norwalk area, ideally located near the Westport line and close to top local amenities. This home offers a rare layout for a Cape, featuring three bedrooms on the upper level-a setup that lives more like a Colonial and is ideal for those who prefer all bedrooms together. With two full bathrooms, one upstairs and one on the main level, the home offers comfort and convenience. Fueled by natural gas, the property provides efficient heating for New England winters. The location is a standout. Enjoy a 10-minute walk to the East Norwalk train station for an easy NYC commute. You are just 7 minutes to Calf Pas
Key facts
- Efficient heating
- Cape cod style home
- Rare layout
Tags
Property features AI
Exterior
- Parking: Paved off-street parking; 4 total parking spaces
- Utilities: Public water connected; Public sewer connected; Natural gas hot water (50-gallon tank); Thermopane windows
- Home design: Single-family home
- Construction: Frame construction; Concrete foundation; Asphalt shingle roof; Aluminum siding; Built living area recorded at 1776 sq ft
- Exterior features: Level, dry lot
Interior
- Kitchen: Gas range; Microwave; Refrigerator; Dishwasher
- Bedrooms: 3 bedrooms
- Bathrooms: 2 full bathrooms
- Heating & cooling: Baseboard heating (natural gas); Window air conditioning unit(s)
- Interior features: 9 total rooms; Possible in-law apartment with lower-level access; Full basement with hatchway; One fireplace
- Laundry & utility: Washer and dryer included; Laundry on the first/main level
Neighborhood map
What this means for you Summary
Snapshot
- This is a 3-bed/2.0-bath single-family listed at $549k.
Deal economics
- At list price, monthly cash flow is $356 ($4k/yr) — positive.
- The deal already cash-flows at list — no discount required.
- To meet the 1% rule (rent ≥ 1% of price), the offer needs to be $501k (8.7% below list).
- Recommended offer: $501k (8.7% below list) — sets the bar for 1% rule.
- Cap rate 7.1% vs local median 3.4% in Norwalk — top-decile yield for the area; either an underpriced asset or a hidden risk that comps aren't pricing in. Stress-test before assuming the spread holds.
Location & tenants
- Location reads 77/100 on livability (#41 in CT, #2,966 nationally) — a middle-class / working-renter tenant base. Strengths: employment A+, health & safety A+, crime A; Watch: amenities C-, cost of living F.
- Norwalk School District (urban): math 29% / reading 44% proficiency, ranked #104 of 153 in CT (top 68%) — families likely to look elsewhere, expect single-tenant / working-renter base with shorter leases.
- Market conditions: Rents soft (-1.0%/yr); 40 active listings in the ZIP; 23 comparable units currently listed for rent nearby; rentals at typical pace (median 15d on market — plan ~3-4 weeks tenant-placement turnaround); solid renter incomes; 1,151 units permitted in Western Connecticut Planning Region in 2024 (714 in 5+ unit buildings).
- At $5,014/mo this rent would consume 57% of the median local household income ($106k/yr) (locally 462% of renters already pay >50% of income on rent) — very limited rent-growth headroom before tenants either downsize or default.
Forward outlook
- Local home prices are declining (-3.0%/yr); year-one equity from $4k of loan paydown is wiped out by about $16k of value loss. Plan a longer hold.
Negotiation context
- It's been on market 19 days — a 2% lower offer ($541k) is reasonable based on typical stale-listing flexibility.
Risks & watch-outs
- Watch-outs: built in 1945 — expect roof / HVAC / electrical / plumbing capex.
- Climate carrying-cost: major wind risk, 75% chance of damaging wind over 30y; extreme-heat days projected 7→16/yr by 2055 (HVAC capex compounding) — expect insurance premiums to compound above CPI over the hold.
Questions for the listing agent
- Built in 1945 — when were the roof, HVAC, electrical panel, plumbing, and water heater last replaced?
- Is there a deadline driving the sale (1031 exchange, divorce, estate, relocation)? That informs how much negotiation room exists.
- What's the average days-on-market for RENTAL listings here right now (not sales)? A rising rental-DOM trend means longer vacancies and softer asking-rent achievability than the comps imply.
- What's the recent tenant-quality profile in this submarket — average credit score on applications, eviction rate, late-payment / NSF rate, and stable-employment percentage? A property-management company in the area should have these aggregated.
- How much new for-sale + rental construction is in the pipeline within 1–3 miles? Heavy new supply typically softens prices + rents 12–24 months out; constrained supply supports both.
Investment metrics
- 1% rule
- 0.91% ✗
- Cap rate
- 7.07%
- Cash-on-cash
- 2.78%
- DSCR
- 1.12
- GRM
- 9.1
CMA / ARV
- ARV (median comp)
- $750,704
- List price
- $549,000
- Delta
- -26.87%
- Verdict
- UNDERPRICED
- Comps
- 20 within 1.0 mi
Show comp detail 12 sales within ~0.75 mi
| Address | Dist | Beds/Ba | Sqft | Sold | Price | $/sf | Match |
|---|---|---|---|---|---|---|---|
| 17 Hayes Ave | 0.08mi | 3/1.5 | 1,654 (-7%) | 9mo | $725,000 | $438 | 75 |
| 42 Winfield St | 0.34mi | 2/1.0 (-1) | 1,768 (-0%) | 7mo | $600,000 | $339 | 68 |
| 11 Olmstead Pl | 0.55mi | 3/1.5 | 1,703 (-4%) | 1mo | $775,000 | $455 | 65 |
| 12 Pine Hill Ave | 0.47mi | 3/1.5 | 1,692 (-5%) | 6mo | $885,000 | $523 | 64 |
| 107 Strawberry Hill Ave | 0.49mi | 4/2.0 (+1) | 1,691 (-5%) | 1mo | $730,000 | $432 | 63 |
| 12 Old Saugatuck Rd | 0.46mi | 3/1.0 | 1,617 (-9%) | 0mo | $832,000 | $515 | 60 |
| 18 Roxbury Rd | 0.30mi | 3/2.5 | 1,987 (+12%) | 5mo | $829,000 | $417 | 60 |
| 25 Dairy Farm Rd | 0.48mi | 3/2.5 | 1,945 (+10%) | 1mo | $685,000 | $352 | 59 |
| 6 Willow St | 0.63mi | 4/2.0 (+1) | 1,936 (+9%) | 5mo | $715,000 | $369 | 46 |
| 118 Strawberry Hill Ave | 0.52mi | 3/1.5 | 2,025 (+14%) | 8mo | $788,930 | $390 | 44 |
| 8 Rolling Ln | 0.65mi | 3/2.0 | 2,030 (+14%) | 8mo | $810,000 | $399 | 40 |
| 20 Eversley Ave | 0.68mi | 4/1.5 (+1) | 1,526 (-14%) | 2mo | $810,000 | $531 | 36 |
Match score weights: distance 35% · size 25% · config 20% · recency 20%. Top-matched comps best support the ARV.
Projected returns pro-forma
-3.0% appreciation · 0.0% rent growth · sell at horizon
- IRR
- -15.2%
- Equity multiple
- 0.47×
- Total profit
- $-81,019
- Equity at exit
- $81,858
- IRR
- -12.4%
- Equity multiple
- 0.36×
- Total profit
- $-98,301
- Equity at exit
- $47,467
Cash invested: $153,720 (down + closing). Projections, not guarantees.
Landlord ↔ Tenant lean methodology
- Overall (STATE)
- 27 Tenant-Leaning
- State Connecticut
- 27 Tenant-Leaning · D+7
- County
- — inherits STATE
- City
- — inherits STATE
ZIP-level market 06855
- Home prices YoY
- -29.4%
- Rents YoY
- -1.0%
- Active inventory
- 40
- Price-to-rent
- 9.1×
Monthly cashflow live
- Estimated rent
- $5,014 high interval (Pro) →
- Mortgage (P&I)
- −$2,879
- Tax from tax record
- −$497 /mo · $5,966/yr
- Insurance
- −$229
- HOA
- −$0
- Vacancy / Maint / Mgmt
- −$1,053
- Net cashflow
- $356
Break-even live
UW: 25.0% down · 7.5% · 30yr · 1.5% tax · 5.0% vac · 8.0% maint · 8.0% mgmt
Financing live
Cash to close
- Down payment
- $137,250
- Closing costs
- $16,470
- Reserves months
- —
- Total cash needed
- —
Loan-product check · same deal, 3 products live
Conventional
25% down · 7.5% · 30yr
- Down + closing
- —
- Monthly P&I
- —
- Monthly cashflow
- —
- DSCR
- —
- Eligible?
- —
Personal DTI + credit; lowest rate.
DSCR
20% down · 8.5% · 30yr
- Down + closing
- —
- Monthly P&I
- —
- Monthly cashflow
- —
- DSCR
- —
- Eligible?
- —
No personal income docs; deal must DSCR.
Hard money
10% down · 12.0% · 12mo
- Down + closing
- —
- Monthly P&I
- —
- Monthly cashflow
- —
- DSCR
- —
- Eligible?
- —
Short-term bridge; refi at stabilization.
Rent comps 23 comps
| Address | Beds | Baths | Sqft | Rent | $/sqft | DOM | Units | Dist |
|---|---|---|---|---|---|---|---|---|
| 33 Emerson St Unit NA Norwalk, CT | 4.0 | 2.0 | 1600 | $4,995 | $3.12 | 3d | 1 | 0.33mi |
| 1 Cemetery St Norwalk, CT | 1.0–3.0 | 1.0–2.0 | 1035 | $5,500 | $5.31 | 2d | 25 | 0.55mi |
| 10 Heron Rd Norwalk, CT | 2.0 | 3.0 | 1938 | $5,200 | $2.68 | 14d | 1 | 0.60mi |
| 8 Norden Pl Norwalk, CT | 1.0–2.0 | 1.0–2.0 | 1010 | $3,786 | $3.75 | 2d | 11 | 0.68mi |
| 67 Osborne Ave Norwalk, CT | 4.0 | 2.0 | 1500 | $4,000 | $2.67 | 19d | 1 | 0.78mi |
| 2 3rd St Unit 1 Norwalk, CT | 4.0 | 3.0 | 1750 | $5,500 | $3.14 | 14d | 1 | 0.81mi |
| 1 Island Dr #9 Norwalk, CT | 2.0 | 2.5 | 2032 | $9,200 | $4.53 | 2d | 1 | 0.87mi |
| 1 Island Dr #9 Norwalk, CT | 2.0 | 2.5 | 2032 | $9,800 | $4.82 | 44d | 1 | 0.87mi |
| 60 Walter Ave Norwalk, CT | 3.0 | 1.5 | 1320 | $4,000 | $3.03 | 44d | 1 | 0.95mi |
| 4 Daskams Ln #309 Norwalk, CT | 2.0 | 2.0 | 1344 | $3,200 | $2.38 | 14d | 1 | 0.95mi |
| 13 Birch St Norwalk, CT | 3.0 | 2.5 | 2230 | $9,500 | $4.26 | 44d | 1 | 0.98mi |
| 104 East Ave Unit 2nd Floor Norwalk, CT | 2.0 | 2.5 | 1584 | $2,800 | $1.77 | 44d | 1 | 0.98mi |
| 515 West Ave Norwalk, CT | 1.0–3.0 | 1.0–2.0 | 1532 | $4,853 | $3.17 | 19d | 48 | 1.17mi |
| 515 West Ave Norwalk, CT | 1.0–3.0 | 1.0–2.0 | 1335 | $4,853 | $3.63 | 2d | 24 | 1.17mi |
| 467 West Ave Norwalk, CT | 3.0 | 1.0–2.0 | 1334 | $6,368 | $4.77 | 10d | 190 | 1.20mi |
| 4 Spriteview Ave Westport, CT | 3.0 | 3.0 | 2404 | $35,000 | $14.56 | 44d | 1 | 1.20mi |
| 370 West Ave Norwalk, CT | 3.0 | 1.0–2.0 | 925 | $4,475 | $4.84 | 3d | 81 | 1.30mi |
| 41 N Main St Norwalk, CT | 3.0 | 2.0 | 2500 | $5,000 | $2.00 | 44d | 1 | 1.34mi |
| 24 Highbrook Rd Norwalk, CT | 3.0 | 2.0 | 1815 | $5,050 | $2.78 | 23d | 1 | 1.36mi |
| 70 N Main St Unit 3D Norwalk, CT | 2.0 | 4.0 | 2000 | $4,500 | $2.25 | 44d | 1 | 1.39mi |
| 33 Strathmore Ln #33 Westport, CT | 2.0 | 2.5 | 1440 | $4,100 | $2.85 | 14d | 1 | 1.45mi |
| 26 Belden Ave Norwalk, CT | 1.0–3.0 | 1.0–2.0 | 1135 | $4,330 | $3.81 | 3d | 20 | 1.45mi |
| 11 Quintard Ave Unit 1 Norwalk, CT | 4.0 | 2.0 | 1235 | $4,500 | $3.64 | 14d | 1 | 1.49mi |
Listing history 2 events
-
2026-05-13status Under Contract 1066-char remark
-
2026-04-24$549,000 Active 1066-char remark
ⓘ Source: listings_history table (triggers on properties + properties_extension) + one-shot
backfill from property_details.listing_events for pre-trigger history.
Tax reassessment forecast CT · Partial reset (capped growth)
- Current annual tax
- $5,966 · $497/mo
- Projected year-2 tax
- $8,857 · $738/mo
- Expected delta
- +$2,891/yr (+$241/mo · 48.5%)
ⓘ Screening estimate from a state-policy table — verify with the county assessor before closing.
Climate risk First Street
- Flood 1/10 Low FEMA zone X (unshaded) · 0% chance over 30 yrs
- Wildfire 1/10 Low
- Heat 6/10 Major 7 d/yr ≥98°F today · 16 d/yr by 30 yrs out
- Wind 6/10 Major 75% chance of damaging wind over 30 yrs
- Air quality 8/10 Severe 13 unhealthy d/yr today · 18 by 30 yrs out
Nearby sold comps map
Loading sold comps map…
Walkable amenities ~0.75 mi
Loading nearby amenities…
Taxation est. · year 1
- Rental income
- $60,167
- − Mortgage interest
- −$30,753
- − Property taxes
- −$5,966
- − Insurance
- −$2,745
- − Repairs & maintenance
- −$4,813
- − Management
- −$4,813
- − Depreciation
- −$15,971
- Taxable loss
- −$4,894
- Est. tax savings @ 24.0%
- +$1,175
- After-tax cash flow
- $5,447/yr
For passive investors: Depreciation is non-cash, so a rental often shows a tax loss while cash-flowing — sheltering income. Rental losses are passive: they offset passive income freely, and up to $25,000/yr can offset ordinary (W-2) income if you actively participate and your MAGI is under $100k (phasing out to $0 by $150k); unused losses carry forward. On sale, claimed depreciation is recaptured at up to 25%, and gains may owe capital-gains tax (a 1031 exchange can defer both). Figures are a year-1 estimate at your 24.0% rate — not tax advice; consult a CPA.
Schools (NCES district)
- District
- Norwalk School District
- NCES district ID
- 0903090
- Math proficiency
- 29% ▼ -11.00%
- Reading proficiency
- 44% ▼ -6.00%
- Median HH income
- $76,540
- Composite
- 34.07/100
- National rank
- #5297
- State rank
- #104 of 153 in CT
Livability — Norwalk
- Score
- 77/100
- State rank
- #41
- US rank
- #2966
Category grades
Schools grade is shown separately in the Schools card above.
Census & demographics
- Census place
- Norwalk, CT
- County
- Fairfield County · 765,532 people
- City population
- 89,026
- Metro
- Bridgeport-Stamford-Norwalk, CT
- Population (ZIP)
- 9,351
- Household income
- $106,439
- Rent vs Own
- Severe rent burden
- 462.0
Population outlook (Western Connecticut County) Hauer SSP2
- By 2040
- 685,031
Race, ethnicity, and origin ACS 2023
- Neighborhood character
- Diverse neighborhood (Simpson 0.63)
- Race & ethnicity
- White 54% Hispanic / Latino 26% Two or more races 14% Black 10% Asian 4%
- Hispanic origin (detail)
- Mexican 5% Puerto Rican 1% Cuban 1%
- Common ancestry
- Romanian 3% Lithuanian 2% Hispanic 2%
- Foreign-born
- 26% · Canada, Jamaica, Guatemala
- Languages at home
- 65% English-only · Spanish 25% Other Indo-European 4% French/Haitian/Cajun 2%
Political lean MEDSL · Western Connecticut
- 2024 margin
- D (+19.1) · D 58.8% · R 39.7% · Other 1.6%
- All cycles
- 2024: D+19.1
Not yet ingested
- Civics
- —
Market trends
- HPI YoY
- ▼ -80.60%
- Current HPI
- 193.6645
- Rent YoY
- ▼ -0.97%
- Metro
- Bridgeport-Stamford-Norwalk, CT
- State GDP YoY
- ▲ 1.06%
- F500 in state
- 38
Industry mix (Fortune 500 HQ in CT)
| Industry | F500 HQs | Revenue |
|---|---|---|
| Industrial Machinery | 4 | $38B |
|
||
| Insurance | 3 | $71B |
|
||
| Financial Services | 2 | $25B |
|
||
| Transportation / Logistics | 2 | $18B |
|
||
| Healthcare | 1 | $247B |
|
||
| Telecommunications | 1 | $55B |
|
||
Price history
2 events — show timeline
- 2026-05-13 Pending — Smart MLS
- 2026-04-24 Listed $549,000 Smart MLS
Property tax history
+1.9%/yrLatest (2023): $5,966 · +2.2% YoY. Source: county tax records.
Cash-flow waterfall
monthlySold comps — $/sqft
last 12 mo · ≤1 miLoading sold comps…