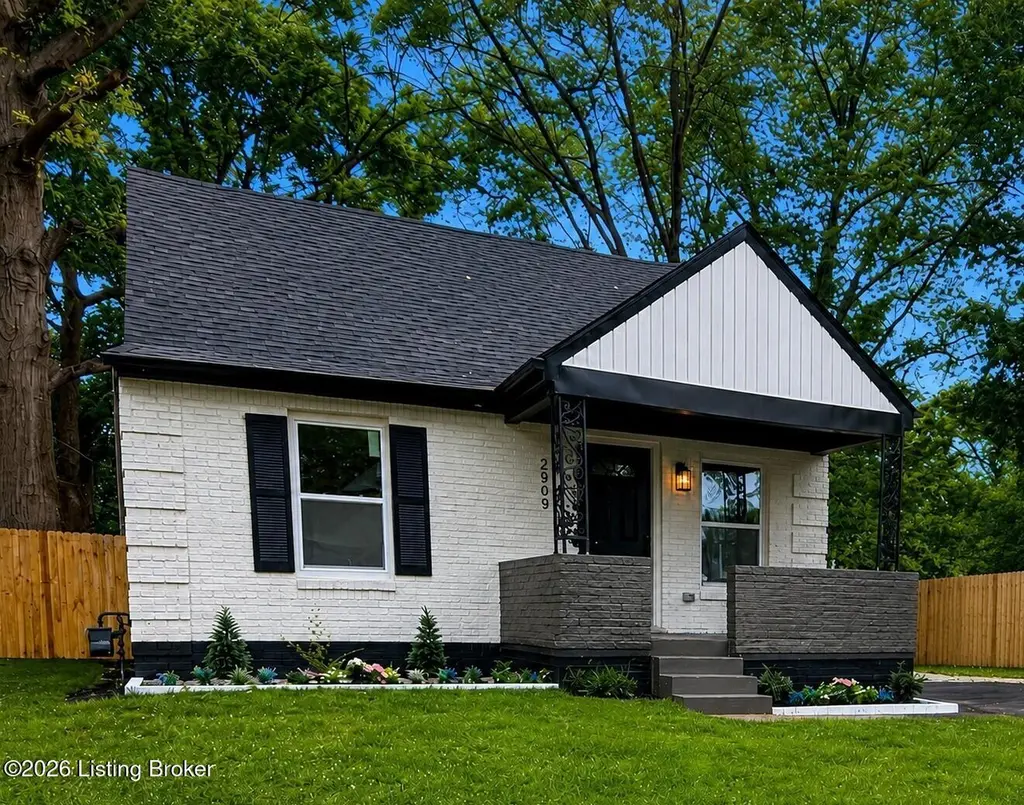
2903 Narragansett Dr · Louisville, KY
Flood risk 1/10 · Minimal
- FEMA flood zone
- X (unshaded)
- Chance of flooding over 30 yrs
- 0.0%
- Est. flood insurance / yr
- $473 – $860
Fire risk 1/10 · Minimal
- Est. fire insurance / yr
- $839 – $1,559
Heat risk 5/10 · Moderate
- Hot days now (above 104°F)
- 7 days/yr
- Hot days in 30 yrs
- 19 days/yr
Wind risk 2/10 · Minimal
- Chance of severe wind over 30 yrs
- 2.0%
Air-quality risk 2/10 · Minimal
- Unhealthy air days now
- 1 days/yr
- Unhealthy air days in 30 yrs
- 3 days/yr
Risk factors via First Street. Map © Google.
Why this score? — see what drove the D- grade
The composite is a weighted blend of 9 inputs, each scored 0–100. Each bar is that input's sub-score; the figure is the points it added to the 100-point composite (weight × sub-score).
- Appreciation +10.0/10.0
- Cash flow +8.7/30.0
- Rent growth +4.5/5.0
- Livability +3.2/5.0
- Condition / age +2.5/5.0
- DSCR +2.4/10.0
- Schools +2.3/10.0
- 1% rule +1.6/10.0
- ARV discount +0.0/15.0
$224,900
🖨 Deal sheet (PDF) 📄 Offer letter ✓ Due diligence
Listing remarks
Fully Renovated 4 Bedroom / 2 Bathroom Home with Modern Finishes! Welcome to a beautifully remodeled home offering style, space, and value. This property features 4 spacious bedrooms, 2 fully updated bathrooms, and living space designed for comfortable modern living. Step inside to discover an open and inviting layout with brand-new flooring, fresh paint, updated lighting, and a stunning contemporary kitchen complete with stainless steel appliances, modern cabinetry, and sleek countertops. The bathrooms have been tastefully renovated with stylish finishes throughout. The exterior has incredible curb appeal with its modern black-and-white design, updated driveway, and spacious yard perfect f
Key facts
- Fully renovated
- Contemporary kitchen
- Modern cabinetry
Tags
Property features AI
Finance
- Other: Located in the ALGONQUIN PLACE subdivision
- HOA & community: No association fee
Exterior
- Parking: No parking listed
- Utilities: Natural gas available
- Home design: Single-family residence; Traditional style; 2 stories; Built in 1947
- Construction: Vinyl siding exterior; Shingle roof; Above-grade finished area included; Below-grade finished area included
- Exterior features: Level lot; Full yard fencing
Interior
- Kitchen: Kitchen on the first floor
- Bedrooms: 4 bedrooms total; Primary bedroom on the second floor; One bedroom in the basement; Two first-floor bedrooms
- Bathrooms: 2 full bathrooms
- Heating & cooling: Forced air heating (natural gas); Central air conditioning
- Interior features: Finished basement; Total of 6 rooms
- Laundry & utility: No first-floor laundry
Neighborhood map
What this means for you Summary
Snapshot
- This is a 4-bed/2.0-bath single-family listed at $225k.
Deal economics
- At list price, monthly cash flow is $-189 ($-2k/yr) — negative.
- To cash-flow at today's rent, offer at most $191k (14.9% below list).
- To meet the 1% rule (rent ≥ 1% of price), the offer needs to be $148k (34.2% below list).
- Recommended offer: $148k (34.2% below list) — sets the bar for 1% rule.
Location & tenants
- Location reads 63/100 on livability (#333 in KY) — a middle-class / working-renter tenant base. Strengths: cost of living A+, housing A+; Watch: employment C-, health & safety D+, crime F.
- Jefferson County (urban): math 19% / reading 35% proficiency, ranked #121 of 165 in KY (top 73%) — low school quality limits family demand, transient renter base, plan for 1-2y turnover.
- Zoned schools: Cane Run Elementary (math 2% / reading 12%, grade F, #662 of 676 statewide, top 99%, 377 students, 80% FRL); Stuart Academy (math 4% / reading 17%, grade F, #216 of 217 statewide, top 100%, 1,105 students, 72% FRL); Valley High (math 17% / reading 22%, grade F, #213 of 254 statewide, top 86%, 964 students, 70% FRL) — zoned schools average 74% FRL vs 56% district-wide (18 pts higher); higher-poverty schools than district average — tighter screening recommended.
- Zoned-school proficiency averages 12% at this address vs 27% district-wide (-15 pts) — the specific schools serving this property underperform the Jefferson County average; the district grade overstates school quality for this exact location.
- Market conditions: Rents rising fast (+8.1%/yr); 93 active listings in the ZIP; 12 comparable units currently listed for rent nearby; rentals at typical pace (median 18d on market — plan ~3-4 weeks tenant-placement turnaround); lower-income renter base — watch delinquency; 2,836 units permitted in Jefferson County in 2024 (1,558 in 5+ unit buildings).
- At $1,479/mo this rent would consume 50% of the median local household income ($35k/yr) (locally 815% of renters already pay >50% of income on rent) — very limited rent-growth headroom before tenants either downsize or default.
Forward outlook
- In year one you build about $24k of equity ($2k loan paydown + $22k appreciation (10.0% local appreciation)).
- Jefferson County population projected at +13% by 2050 — modest demand growth; plan on rents tracking national, not racing it.
- By year 2, paydown + projected appreciation supports a ~$39k cash-out refi (75% LTV) — recoverable capital for the next deal without selling this one.
Negotiation context
- It's been on market 24 days — a 2% lower offer ($222k) is reasonable based on typical stale-listing flexibility.
Risks & watch-outs
- Watch-outs: built in 1947 — expect roof / HVAC / electrical / plumbing capex.
- Climate carrying-cost: extreme-heat days projected 7→19/yr by 2055 (HVAC capex compounding) — expect insurance premiums to compound above CPI over the hold.
Questions for the listing agent
- What do current leases actually rent for vs. the listed asking? Can we see a recent rent roll and the last 12 months of T-12 income?
- Built in 1947 — when were the roof, HVAC, electrical panel, plumbing, and water heater last replaced?
- Is there a deadline driving the sale (1031 exchange, divorce, estate, relocation)? That informs how much negotiation room exists.
- Schools are D-rated, which usually means shorter tenancies and higher turnover. Who's the typical renter profile here, and what's been the actual vacancy rate?
- Crime grade is F in this area — have there been break-ins, vandalism, or insurance claims at this property in the last 3 years? What carrier currently insures it and at what premium?
- The area grade is low — what's the realistic commute time and amenity access for the typical tenant pool here? Any planned neighborhood developments (good or bad) we should know about?
- What's the average days-on-market for RENTAL listings here right now (not sales)? A rising rental-DOM trend means longer vacancies and softer asking-rent achievability than the comps imply.
- What's the recent tenant-quality profile in this submarket — average credit score on applications, eviction rate, late-payment / NSF rate, and stable-employment percentage? A property-management company in the area should have these aggregated.
- How much new for-sale + rental construction is in the pipeline within 1–3 miles? Heavy new supply typically softens prices + rents 12–24 months out; constrained supply supports both.
Investment metrics
- 1% rule
- 0.66% ✗
- Cap rate
- 5.28%
- Cash-on-cash
- -3.60%
- DSCR
- 0.84
- GRM
- 12.7
CMA / ARV
- ARV (on-the-fly)
- $162,000
- Comps found
- 12
Show comp detail 12 sales within ~0.75 mi
| Address | Dist | Beds/Ba | Sqft | Sold | Price | $/sf | Match |
|---|---|---|---|---|---|---|---|
| 1811 Beech St | 0.04mi | 3/2.0 (-1) | 1,872 (+4%) | 2mo | $168,000 | $90 | 85 |
| 2300 Oregon Ave | 0.47mi | 4/2.0 | 1,810 (+1%) | 4mo | $142,500 | $79 | 74 |
| 1533 Beech St | 0.31mi | 4/2.0 | 1,660 (-8%) | 2mo | $120,000 | $72 | 70 |
| 1544 Catalpa St | 0.27mi | 4/2.5 | 1,596 (-11%) | 1mo | $185,000 | $116 | 65 |
| 1852 Cypress St | 0.23mi | 3/2.5 (-1) | 1,900 (+6%) | 10mo | $138,000 | $73 | 65 |
| 1445 Olive St | 0.48mi | 4/1.5 | 1,712 (-5%) | 8mo | $150,000 | $88 | 61 |
| 2307 W Lee St | 0.45mi | 4/2.0 | 1,600 (-11%) | 4mo | $172,000 | $108 | 58 |
| 1365 Cypress St | 0.66mi | 3/1.5 (-1) | 1,764 (-2%) | 4mo | $165,000 | $94 | 55 |
| 2107 Ratcliffe Ave | 0.60mi | 3/2.0 (-1) | 1,706 (-5%) | 5mo | $198,000 | $116 | 54 |
| 1844 Bolling Ave | 0.69mi | 3/1.5 (-1) | 1,726 (-4%) | 6mo | $155,000 | $90 | 49 |
| 2812 Wingfield Ln | 0.47mi | 3/1.5 (-1) | 1,550 (-14%) | 10mo | $224,000 | $145 | 40 |
| 2325 Bolling Ave | 0.55mi | 3/1.5 (-1) | 2,060 (+14%) | 9mo | $117,000 | $57 | 36 |
Match score weights: distance 35% · size 25% · config 20% · recency 20%. Top-matched comps best support the ARV.
Projected returns pro-forma
10.0% appreciation · 8.0% rent growth · sell at horizon
- IRR
- 23.0%
- Equity multiple
- 2.88×
- Total profit
- $118,161
- Equity at exit
- $202,608
- IRR
- 21.6%
- Equity multiple
- 6.98×
- Total profit
- $376,606
- Equity at exit
- $436,931
Cash invested: $62,972 (down + closing). Projections, not guarantees.
Landlord ↔ Tenant lean methodology
- Overall (STATE)
- 83 Strongly Landlord-Friendly
- State Kentucky
- 83 Strongly Landlord-Friendly · R+16
- County
- — inherits STATE
- City
- — inherits STATE
ZIP-level market 40210
- Home prices YoY
- 12.1%
- Rents YoY
- 8.1%
- Active inventory
- 93
- Price-to-rent
- 12.7×
Monthly cashflow live
- Estimated rent
- $1,479 high interval (Pro) →
- Mortgage (P&I)
- −$1,179
- Tax from tax record
- −$85 /mo · $1,015/yr
- Insurance
- −$94
- HOA
- −$0
- Vacancy / Maint / Mgmt
- −$311
- Net cashflow
- $-189
Break-even live
Sensitivity live
| Price | -10% $-62 | -5% $-125 | +0% $-189 | +5% $-253 | +10% $-316 |
|---|---|---|---|---|---|
| Rent | -10% $-306 | -5% $-248 | +0% $-189 | +5% $-131 | +10% $-72 |
| Rate | -1.0pp $-76 | -0.5pp $-132 | base $-189 | +0.5pp $-247 | +1.0pp $-307 |
UW: 25.0% down · 7.5% · 30yr · 1.5% tax · 5.0% vac · 8.0% maint · 8.0% mgmt
Financing live
Cash to close
- Down payment
- $56,225
- Closing costs
- $6,747
- Reserves months
- —
- Total cash needed
- —
Loan-product check · same deal, 3 products live
Conventional
25% down · 7.5% · 30yr
- Down + closing
- —
- Monthly P&I
- —
- Monthly cashflow
- —
- DSCR
- —
- Eligible?
- —
Personal DTI + credit; lowest rate.
DSCR
20% down · 8.5% · 30yr
- Down + closing
- —
- Monthly P&I
- —
- Monthly cashflow
- —
- DSCR
- —
- Eligible?
- —
No personal income docs; deal must DSCR.
Hard money
10% down · 12.0% · 12mo
- Down + closing
- —
- Monthly P&I
- —
- Monthly cashflow
- —
- DSCR
- —
- Eligible?
- —
Short-term bridge; refi at stabilization.
Rent comps 12 comps
| Address | Beds | Baths | Sqft | Rent | $/sqft | DOM | Units | Dist |
|---|---|---|---|---|---|---|---|---|
| 1618 S 30th St Louisville, KY | 3.0 | 1.0 | 1896 | $1,235 | $0.65 | 18d | 1 | 0.25mi |
| 1545 Catalpa St Louisville, KY | 4.0 | 1.5 | 1760 | $1,545 | $0.88 | 5d | 1 | 0.28mi |
| 1774 Bolling Ave Louisville, KY | 3.0 | 2.0 | 1611 | $1,300 | $0.81 | 12d | 1 | 0.88mi |
| 1115 S 32nd St Louisville, KY | 3.0 | 1.0 | 1393 | $1,275 | $0.92 | 25d | 1 | 1.02mi |
| 1115 S 32nd St Louisville, KY | 3.0 | 1.0 | 1393 | $1,275 | $0.92 | 23d | 1 | 1.02mi |
| 2912 Greenwood Ave Louisville, KY | 3.0 | 2.0 | 1362 | $1,150 | $0.84 | 18d | 1 | 1.12mi |
| 2825 Greenwood Ave #4 Louisville, KY | 3.0 | 1.0 | 1440 | $1,250 | $0.87 | 25d | 1 | 1.16mi |
| 3514 Grand Ave Louisville, KY | 3.0 | 1.5 | 1450 | $1,295 | $0.89 | 23d | 1 | 1.17mi |
| 1705 1/2 Hale Ave Louisville, KY | 3.0 | 2.0 | 1257 | $1,400 | $1.11 | 12d | 1 | 1.37mi |
| 820 Hazel St Louisville, KY | 4.0 | 2.0 | 1872 | $1,395 | $0.75 | 5d | 1 | 1.42mi |
| 1505 Homeview Dr Louisville, KY | 5.0 | 2.0 | 1949 | $1,850 | $0.95 | 18d | 1 | 1.47mi |
| 858 S 23rd St Louisville, KY | 5.0 | 1.0 | 2228 | $2,100 | $0.94 | 19d | 1 | 1.49mi |
Listing history 15 events
-
2026-06-21days on market $224,900 Active 24 DOM
-
2026-06-18days on market $224,900 Active 21 DOM
-
2026-06-17days on market $224,900 Active 20 DOM
-
2026-06-16days on market $224,900 Active 19 DOM
-
2026-06-15days on market $224,900 Active 18 DOM
-
2026-06-13days on market $224,900 Active 16 DOM
-
2026-06-10days on market $224,900 Active 13 DOM
-
2026-06-09days on market $224,900 Active 12 DOM
-
2026-06-08days on market $224,900 Active 11 DOM
-
2026-06-07pricedays on market $224,900 Active 10 DOM
-
2026-06-03days on market $229,900 Active 6 DOM
-
2026-06-02days on market $229,900 Active 5 DOM
-
2026-06-01days on market $229,900 Active 4 DOM
-
2026-05-31days on market $229,900 Active 3 DOM
-
2026-05-28$229,900 Active
ⓘ Source: listings_history table (triggers on properties + properties_extension) + one-shot
backfill from property_details.listing_events for pre-trigger history.
Tax reassessment forecast KY · Resets to sale price
- Current annual tax
- $1,015 · $85/mo
- Projected year-2 tax
- $1,934 · $161/mo
- Expected delta
- +$919/yr (+$77/mo · 90.5%)
ⓘ Screening estimate from a state-policy table — verify with the county assessor before closing.
Climate risk First Street
- Flood 1/10 Low FEMA zone X (unshaded) · 0% chance over 30 yrs
- Wildfire 1/10 Low
- Heat 5/10 Major 7 d/yr ≥104°F today · 19 d/yr by 30 yrs out
- Wind 2/10 Low 2% chance of damaging wind over 30 yrs
- Air quality 2/10 Low 1 unhealthy d/yr today · 3 by 30 yrs out
Nearby sold comps map
Loading sold comps map…
Walkable amenities ~0.75 mi
Loading nearby amenities…
Taxation est. · year 1
- Rental income
- $17,751
- − Mortgage interest
- −$12,598
- − Property taxes
- −$1,015
- − Insurance
- −$1,124
- − Repairs & maintenance
- −$1,420
- − Management
- −$1,420
- − Depreciation
- −$6,543
- Taxable loss
- −$6,369
- Est. tax savings @ 24.0%
- +$1,529
- After-tax cash flow
- $-741/yr
For passive investors: Depreciation is non-cash, so a rental often shows a tax loss while cash-flowing — sheltering income. Rental losses are passive: they offset passive income freely, and up to $25,000/yr can offset ordinary (W-2) income if you actively participate and your MAGI is under $100k (phasing out to $0 by $150k); unused losses carry forward. On sale, claimed depreciation is recaptured at up to 25%, and gains may owe capital-gains tax (a 1031 exchange can defer both). Figures are a year-1 estimate at your 24.0% rate — not tax advice; consult a CPA.
Schools (NCES district)
- District
- Jefferson County
- NCES district ID
- 2102990
- Math proficiency
- 19% ▼ -17.00%
- Reading proficiency
- 35% ▼ -11.00%
- Median HH income
- $47,885
- Composite
- 23.45/100
- National rank
- #7884
- State rank
- #121 of 165 in KY
Livability — Louisville
- Score
- 63/100
- State rank
- #333
- US rank
- #15887
Category grades
Schools grade is shown separately in the Schools card above.
Census & demographics
- Census place
- Louisville, KY
- County
- Jefferson County · 790,184 people
- City population
- 769,292
- Metro
- Louisville/Jefferson County, KY-IN
- Population (ZIP)
- 13,518
- Household income
- $35,347
- Rent vs Own
- Severe rent burden
- 815.0
Population outlook (Jefferson County) Hauer SSP2
- Today (2025)
- 823,112 people
- By 2030
- 849,343 · +3.2%
- By 2040
- 895,696 · +8.8%
- By 2050
- 933,630 · +13.4%
- By 2075
- 1,028,262 · +24.9%
- By 2100
- 1,072,675 · +30.3%
Race, ethnicity, and origin ACS 2023
- Neighborhood character
- Predominantly Black (84%)
- Race & ethnicity
- Black 84% White 8% Two or more races 5% Hispanic / Latino 3%
- Common ancestry
- Iranian 1%
- Foreign-born
- 4% · Canada
- Languages at home
- 93% English-only · Spanish 3%
Political lean MEDSL · Jefferson
- 2024 margin
- D (+16.6) · D 57.4% · R 40.9% · Other 1.7%
- 2008→2024 swing
- +4.5pp toward D · 2008: 12.0pp · 2024: 16.6pp
- All cycles
- 2024: D+16.6 2020: D+20.1 2016: D+13.3 2012: D+11.1 2008: D+12.0
Not yet ingested
- Civics
- —
Market trends
- HPI YoY
- ▲ 28.45%
- Current HPI
- 264.0146
- Rent YoY
- ▲ 8.05%
- Metro
- Louisville/Jefferson County, KY-IN
- State GDP YoY
- ▲ 1.81%
- F500 in state
- 4
Industry mix (Fortune 500 HQ in KY)
| Industry | F500 HQs | Revenue |
|---|---|---|
| Healthcare | 1 | $118B |
|
||
| Food / Beverage | 1 | $7B |
|
||
Price history
1 event — show timeline
- 2026-05-28 Listed $229,900 Metro Search MLS
Property tax history
+7.8%/yrLatest (2025): $1,015 · -1.9% YoY. Source: county tax records.
Cash-flow waterfall
monthlySold comps — $/sqft
last 12 mo · ≤1 miLoading sold comps…