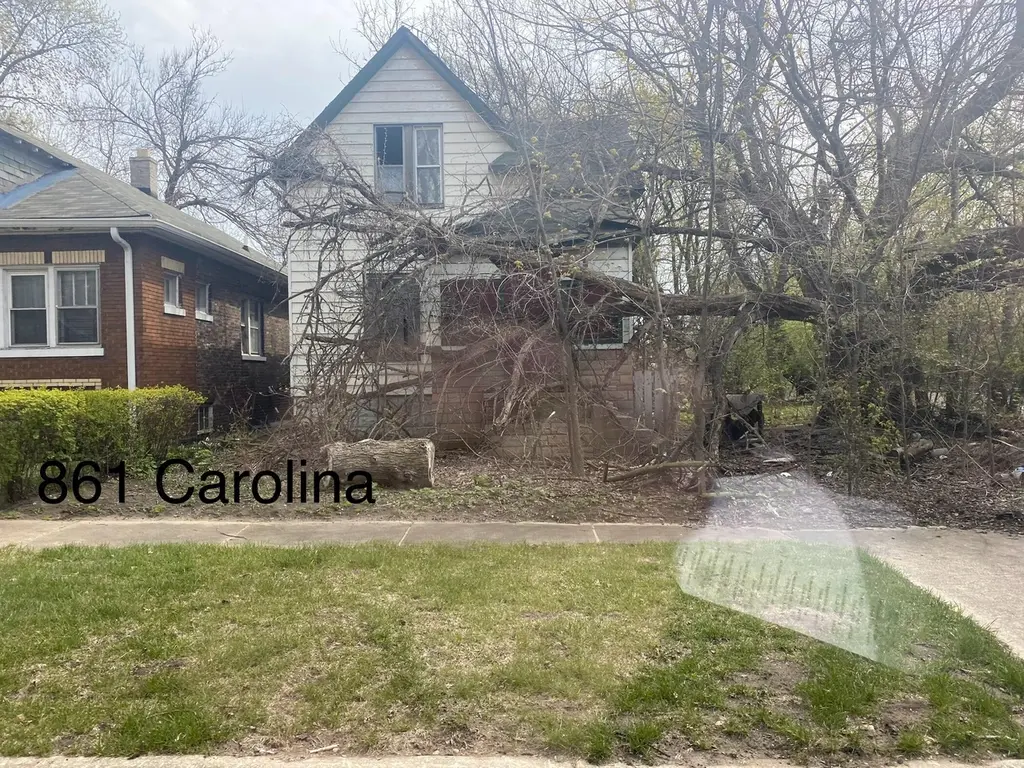
861 Carolina St · Gary, IN
Flood risk 1/10 · Minimal
- FEMA flood zone
- X (unshaded)
- Chance of flooding over 30 yrs
- 0.0%
- Est. flood insurance / yr
- $507 – $1,088
Fire risk 8/10 · Major
- Est. fire insurance / yr
- $717 – $1,331
Heat risk 3/10 · Minor
- Hot days now (above 102°F)
- 7 days/yr
- Hot days in 30 yrs
- 15 days/yr
Wind risk 2/10 · Minimal
- Chance of severe wind over 30 yrs
- 1.0%
Air-quality risk 4/10 · Minor
- Unhealthy air days now
- 6 days/yr
- Unhealthy air days in 30 yrs
- 7 days/yr
Risk factors via First Street. Map © Google.
Why this score? — see what drove the D grade
The composite is a weighted blend of 9 inputs, each scored 0–100. Each bar is that input's sub-score; the figure is the points it added to the 100-point composite (weight × sub-score).
- Cash flow +15.0/30.0
- ARV discount +7.5/15.0
- 1% rule +5.0/10.0
- DSCR +5.0/10.0
- Livability +3.7/5.0
- Rent growth +2.5/5.0
- Condition / age +2.5/5.0
- Appreciation +1.4/10.0
- Schools +0.5/10.0
$19,000
🖨 Deal sheet (PDF) 📄 Offer letter ✓ Due diligence
Listing remarks
Lots of potential with this 2-story fixer upper on a quiet block. Central location would make for a great rental house or primary residence. Handyman's special, being sold AS IS. Make an offer!
Key facts
- 6,098 sq ft lot
- Built 1914
- Listed 16 days
Property features AI
Exterior
- Utilities: Public water; Public sewer; Electric service: Other
- Home design: Two-story home; Built in 1914; Property listed as fixer
- Construction: Unfinished basement (foundation details not provided)
- Exterior features: Neighborhood view
Interior
- Bedrooms: Primary bedroom; Bedroom 2; Bedroom 3; Total of 4 rooms (includes living room and bedrooms)
- Flooring: Hardwood floors
- Bathrooms: 1 full bathroom
- Heating & cooling: No heating; No cooling
- Interior features: No interior features listed; Unfinished basement
Neighborhood map
What this means for you Summary
Snapshot
- This is a 3-bed/1.0-bath single-family listed at $19k.
Deal economics
- At list price, monthly cash flow is $960 ($12k/yr) — positive.
- The deal already cash-flows at list — no discount required.
- Meets the 1% rule at list price ($1k rent vs $19k).
- Recommended offer: $19k (1.5% below list) — sets the bar for market timing.
- Cap rate 66.9% vs local median 9.1% in Gary — top-decile yield for the area; either an underpriced asset or a hidden risk that comps aren't pricing in. Stress-test before assuming the spread holds.
Location & tenants
- Location reads 73/100 on livability (#105 in IN) — a middle-class / working-renter tenant base. Strengths: commute A+, cost of living A+, housing A+; Watch: schools F, crime F, employment F.
- Gary Community School Corporation (urban): math 3% / reading 11% proficiency, ranked #299 of 301 in IN (top 99%) — low school quality limits family demand, transient renter base, plan for 1-2y turnover; 80% free/reduced lunch — lower-income household profile, screen leases tightly.
- Market conditions: 47 active listings in the ZIP; 13 comparable units currently listed for rent nearby; rentals leasing fast (median 0d on market — plan ~1-2 weeks tenant-placement turnaround); lower-income renter base — watch delinquency; 1,642 units permitted in Lake County in 2024 (14 in 5+ unit buildings).
- At $1,384/mo this rent would consume 50% of the median local household income ($34k/yr) (locally 336% of renters already pay >50% of income on rent) — very limited rent-growth headroom before tenants either downsize or default.
Forward outlook
- Local home prices are declining (-3.0%/yr); year-one equity from $131 of loan paydown is wiped out by about $570 of value loss. Plan a longer hold.
- Lake County population projected to shrink 7% by 2050 — rents likely to lag national; underwrite the cash flow, not the appreciation.
- At projected returns (-3.0% appreciation + 3.0% rent growth), your $5k cash investment doubles in ~1 year — after that, you're playing with house money.
Negotiation context
- It's been on market 16 days — a 2% lower offer ($19k) is reasonable based on typical stale-listing flexibility.
Risks & watch-outs
- Watch-outs: built in 1914 — expect roof / HVAC / electrical / plumbing capex.
- Climate carrying-cost: severe wildfire risk — expect insurance premiums to compound above CPI over the hold.
Questions for the listing agent
- Built in 1914 — when were the roof, HVAC, electrical panel, plumbing, and water heater last replaced?
- Is there a deadline driving the sale (1031 exchange, divorce, estate, relocation)? That informs how much negotiation room exists.
- Schools are F-rated, which usually means shorter tenancies and higher turnover. Who's the typical renter profile here, and what's been the actual vacancy rate?
- Crime grade is F in this area — have there been break-ins, vandalism, or insurance claims at this property in the last 3 years? What carrier currently insures it and at what premium?
- The area grade is low — what's the realistic commute time and amenity access for the typical tenant pool here? Any planned neighborhood developments (good or bad) we should know about?
- What's the average days-on-market for RENTAL listings here right now (not sales)? A rising rental-DOM trend means longer vacancies and softer asking-rent achievability than the comps imply.
- What's the recent tenant-quality profile in this submarket — average credit score on applications, eviction rate, late-payment / NSF rate, and stable-employment percentage? A property-management company in the area should have these aggregated.
- How much new for-sale + rental construction is in the pipeline within 1–3 miles? Heavy new supply typically softens prices + rents 12–24 months out; constrained supply supports both.
Investment metrics
- 1% rule
- 7.28% ✓
- Cap rate
- 66.92%
- Cash-on-cash
- 216.51%
- DSCR
- 10.63
- GRM
- 1.1
CMA / ARV
- ARV (on-the-fly)
- $132,048
- Comps found
- 12
Show comp detail 12 sales within ~0.75 mi
| Address | Dist | Beds/Ba | Sqft | Sold | Price | $/sf | Match |
|---|---|---|---|---|---|---|---|
| 721 Vermont St | 0.26mi | 4/1.0 (+1) | 1,550 (-1%) | 14mo | $130,000 | $84 | 69 |
| 852 Kentucky St | 0.23mi | 3/2.0 | 1,454 (-8%) | 8mo | $65,000 | $45 | 66 |
| 555 Kentucky St | 0.46mi | 3/1.0 | 1,728 (+10%) | 1mo | $33,000 | $19 | 61 |
| 640 Kentucky St | 0.36mi | 3/1.0 | 1,392 (-12%) | 8mo | $75,000 | $54 | 57 |
| 864 Ohio St | 0.35mi | 3/3.0 | 1,750 (+11%) | 0mo | $188,000 | $107 | 56 |
| 899 Ohio St | 0.38mi | 3/1.5 | 1,452 (-8%) | 14mo | $149,000 | $103 | 56 |
| 530 Connecticut St | 0.55mi | 3/1.0 | 1,503 (-4%) | 14mo | $43,000 | $29 | 56 |
| 1308 E 6th Ave | 0.52mi | 2/1.0 (-1) | 1,440 (-8%) | 6mo | $80,000 | $56 | 52 |
| 748 Tennessee St | 0.32mi | 3/2.0 | 1,339 (-15%) | 12mo | $155,000 | $116 | 46 |
| 579 Tennessee St | 0.47mi | 2/1.5 (-1) | 1,704 (+8%) | 16mo | $168,000 | $99 | 44 |
| 1632 Georgia St | 0.63mi | 3/1.5 | 1,400 (-11%) | 16mo | $85,000 | $61 | 37 |
| 1640 Georgia St | 0.64mi | 3/2.0 | 1,400 (-11%) | 15mo | $149,900 | $107 | 36 |
Match score weights: distance 35% · size 25% · config 20% · recency 20%. Top-matched comps best support the ARV.
Projected returns pro-forma
-3.0% appreciation · 3.0% rent growth · sell at horizon
- IRR
- —
- Equity multiple
- 11.92×
- Total profit
- $58,078
- Equity at exit
- $2,833
- IRR
- —
- Equity multiple
- 25.32×
- Total profit
- $129,383
- Equity at exit
- $1,643
Cash invested: $5,320 (down + closing). Projections, not guarantees.
Landlord ↔ Tenant lean methodology
- Overall (STATE)
- 90 Strongly Landlord-Friendly
- State Indiana
- 90 Strongly Landlord-Friendly · R+11
- County
- — inherits STATE
- City
- — inherits STATE
ZIP-level market 46402
- Home prices YoY
- -2.8%
- Active inventory
- 47
- Price-to-rent
- 1.1×
Monthly cashflow live
- Estimated rent
- $1,384 high interval (Pro) →
- Mortgage (P&I)
- −$100
- Tax from tax record
- −$26 /mo · $309/yr
- Insurance
- −$8
- HOA
- −$0
- Vacancy / Maint / Mgmt
- −$291
- Net cashflow
- $960
Break-even live
Sensitivity live
| Price | -10% $971 | -5% $965 | +0% $960 | +5% $954 | +10% $949 |
|---|---|---|---|---|---|
| Rent | -10% $851 | -5% $905 | +0% $960 | +5% $1,015 | +10% $1,069 |
| Rate | -1.0pp $969 | -0.5pp $965 | base $960 | +0.5pp $955 | +1.0pp $950 |
UW: 25.0% down · 7.5% · 30yr · 1.5% tax · 5.0% vac · 8.0% maint · 8.0% mgmt
Financing live
Cash to close
- Down payment
- $4,750
- Closing costs
- $570
- Reserves months
- —
- Total cash needed
- —
Loan-product check · same deal, 3 products live
Conventional
25% down · 7.5% · 30yr
- Down + closing
- —
- Monthly P&I
- —
- Monthly cashflow
- —
- DSCR
- —
- Eligible?
- —
Personal DTI + credit; lowest rate.
DSCR
20% down · 8.5% · 30yr
- Down + closing
- —
- Monthly P&I
- —
- Monthly cashflow
- —
- DSCR
- —
- Eligible?
- —
No personal income docs; deal must DSCR.
Hard money
10% down · 12.0% · 12mo
- Down + closing
- —
- Monthly P&I
- —
- Monthly cashflow
- —
- DSCR
- —
- Eligible?
- —
Short-term bridge; refi at stabilization.
Rent comps 13 comps
| Address | Beds | Baths | Sqft | Rent | $/sqft | DOM | Units | Dist |
|---|---|---|---|---|---|---|---|---|
| 1109 Maryland St Gary, IN | 3.0 | 1.0 | 1982 | $1,000 | $0.50 | 0d | 1 | 0.31mi |
| 1109 Maryland St Unit 1 Gary, IN | 3.0 | 1.5 | 1982 | $1,000 | $0.50 | 0d | 1 | 0.31mi |
| 672 Connecticut St Apt 1S Gary, IN | 3.0 | 1.0 | 1247 | $875 | $0.70 | 17d | 1 | 0.43mi |
| 1030 E 6th Ave Gary, IN | 3.0 | 1.5 | 1400 | $1,600 | $1.14 | 0d | 1 | 0.44mi |
| 1329 Delaware St Gary, IN | 2.0 | 1.0 | 1100 | $1,100 | $1.00 | 45d | 1 | 0.44mi |
| 501 Madison St Gary, IN | 1.0–4.0 | 1.0 | 883 | $1,362 | $1.54 | 0d | 11 | 0.85mi |
| 2034 Central Dr Gary, IN | 4.0 | 2.0 | 1615 | $1,700 | $1.05 | 5d | 1 | 1.18mi |
| 803 Pierce St Gary, IN | 4.0 | 2.0 | 1600 | $1,400 | $0.88 | 3d | 1 | 1.24mi |
| 1744 Tyler St Unit 2 Gary, IN | 4.0 | 2.0 | 1600 | $1,700 | $1.06 | 46d | 1 | 1.25mi |
| 1572 Polk St Gary, IN | 3.0 | 1.0 | 1500 | $1,250 | $0.83 | 0d | 1 | 1.25mi |
| 2306 Vermont St Gary, IN | 3.0 | 1.5 | 1200 | $1,300 | $1.08 | 0d | 1 | 1.29mi |
| 2257 Central Dr Gary, IN | 4.0 | 2.0 | 1220 | $1,650 | $1.35 | 45d | 1 | 1.30mi |
| 2425 Prospect St Gary, IN | 3.0 | 1.0 | 1051 | $1,400 | $1.33 | 0d | 1 | 1.42mi |
Listing history 11 events
-
2026-06-21days on market $19,000 Active 16 DOM
-
2026-06-18days on market $19,000 Active 13 DOM
-
2026-06-17days on market $19,000 Active 12 DOM
-
2026-06-16days on market $19,000 Active 11 DOM
-
2026-06-15days on market $19,000 Active 10 DOM
-
2026-06-13days on market $19,000 Active 8 DOM
-
2026-06-13days on market $19,000 Active 7 DOM
-
2026-06-09days on market $19,000 Active 4 DOM
-
2026-06-08days on market $19,000 Active 3 DOM
-
2026-06-07remarks 193-char remark
-
2026-06-07$19,000 Active 2 DOM
ⓘ Source: listings_history table (triggers on properties + properties_extension) + one-shot
backfill from property_details.listing_events for pre-trigger history.
Tax reassessment forecast IN · Partial reset (capped growth)
- Current annual tax
- $309 · $26/mo
- Projected year-2 tax
- $309 · $26/mo
- Expected delta
- $0/yr ($0/mo · 0.0%)
ⓘ Screening estimate from a state-policy table — verify with the county assessor before closing.
Climate risk First Street
- Flood 1/10 Low FEMA zone X (unshaded) · 0% chance over 30 yrs
- Wildfire 8/10 Severe
- Heat 3/10 Moderate 7 d/yr ≥102°F today · 15 d/yr by 30 yrs out
- Wind 2/10 Low 100% chance of damaging wind over 30 yrs
- Air quality 4/10 Moderate 6 unhealthy d/yr today · 7 by 30 yrs out
Nearby sold comps map
Loading sold comps map…
Walkable amenities ~0.75 mi
Loading nearby amenities…
Taxation est. · year 1
- Rental income
- $16,605
- − Mortgage interest
- −$1,064
- − Property taxes
- −$309
- − Insurance
- −$95
- − Repairs & maintenance
- −$1,328
- − Management
- −$1,328
- − Depreciation
- −$553
- Taxable income
- $11,927
- Est. tax owed @ 24.0%
- −$2,863
- After-tax cash flow
- $8,656/yr
For passive investors: Depreciation is non-cash, so a rental often shows a tax loss while cash-flowing — sheltering income. Rental losses are passive: they offset passive income freely, and up to $25,000/yr can offset ordinary (W-2) income if you actively participate and your MAGI is under $100k (phasing out to $0 by $150k); unused losses carry forward. On sale, claimed depreciation is recaptured at up to 25%, and gains may owe capital-gains tax (a 1031 exchange can defer both). Figures are a year-1 estimate at your 24.0% rate — not tax advice; consult a CPA.
Schools (NCES district)
- District
- Gary Community School Corporation
- NCES district ID
- 1803870
- Math proficiency
- 3% ▼ -10.00%
- Reading proficiency
- 11% ▼ -6.00%
- Median HH income
- $27,739
- Composite
- 4.98/100
- National rank
- #10039
- State rank
- #299 of 301 in IN
Livability — Gary
- Score
- 73/100
- State rank
- #105
- US rank
- #5592
Category grades
Schools grade is shown separately in the Schools card above.
Census & demographics
- Census place
- Gary, IN
- County
- Lake County · 422,878 people
- City population
- 63,701
- Metro
- Chicago-Naperville-Elgin, IL-IN-WI
- Population (ZIP)
- 5,836
- Household income
- $33,529
- Rent vs Own
- Severe rent burden
- 336.0
Population outlook (Lake County) Hauer SSP2
- Today (2025)
- 484,026 people
- By 2030
- 478,091 · -1.2%
- By 2040
- 462,974 · -4.3%
- By 2050
- 449,894 · -7.1%
- By 2075
- 436,169 · -9.9%
- By 2100
- 426,607 · -11.9%
Race, ethnicity, and origin ACS 2023
- Neighborhood character
- Predominantly Black (87%)
- Race & ethnicity
- Black 87% Two or more races 5% White 5% Hispanic / Latino 4%
- Common ancestry
- Romanian 1% Ukrainian 1%
- Foreign-born
- 1% · Canada
- Languages at home
- 98% English-only · Spanish 1% Arabic 1%
Political lean MEDSL · Lake
- 2024 margin
- Lean D (+5.6) · D 52.1% · R 46.5% · Other 1.5%
- 2008→2024 swing
- -28.6pp toward R · 2008: 34.3pp · 2024: 5.6pp
- All cycles
- 2024: D+5.6 2020: D+15.1 2016: D+20.6 2012: D+31.0 2008: D+34.3
Not yet ingested
- Civics
- —
Market trends
- HPI YoY
- ▼ -7.21%
- Current HPI
- 250.2464
- Rent YoY
- —
- Metro
- Chicago-Naperville-Elgin, IL-IN-WI
- State GDP YoY
- ▲ 2.90%
- F500 in state
- 18
Industry mix (Fortune 500 HQ in IN)
| Industry | F500 HQs | Revenue |
|---|---|---|
| Industrial Machinery | 2 | $37B |
|
||
| Healthcare | 1 | $177B |
|
||
| Pharmaceuticals | 1 | $45B |
|
||
| Metals / Steel | 1 | $18B |
|
||
| Agriculture | 1 | $17B |
|
||
| Packaging | 1 | $12B |
|
||
Price history
1 event — show timeline
- 2026-06-04 Listed $19,000 NIRA MLS as Distributed by MLS Grid
Property tax history
-8.4%/yrLatest (2024): $309 · +11.2% YoY. Source: county tax records.
Cash-flow waterfall
monthlySold comps — $/sqft
last 12 mo · ≤1 miLoading sold comps…