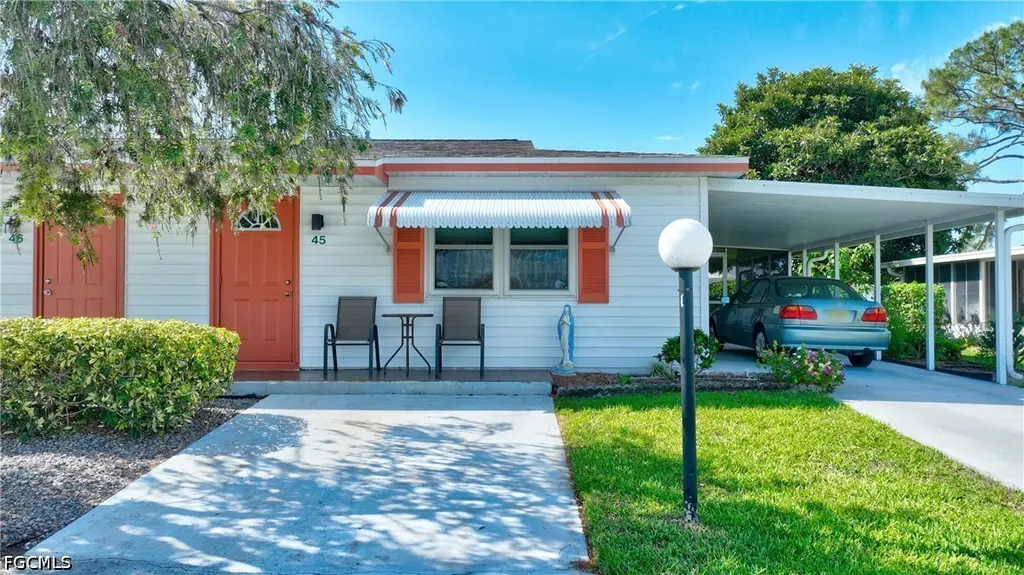
45 Desert Candle Cir · Lehigh Acres, FL
Flood risk 4/10 · Minor
- FEMA flood zone
- X (unshaded)
- Chance of flooding over 30 yrs
- 0.22%
- Est. flood insurance / yr
- $507 – $1,088
Fire risk 2/10 · Minimal
- Est. fire insurance / yr
- $947 – $1,759
Heat risk 10/10 · Severe
- Hot days now (above 108°F)
- 7 days/yr
- Hot days in 30 yrs
- 29 days/yr
Wind risk 10/10 · Severe
- Chance of severe wind over 30 yrs
- 99.0%
Air-quality risk 2/10 · Minimal
- Unhealthy air days now
- 1 days/yr
- Unhealthy air days in 30 yrs
- 2 days/yr
Risk factors via First Street. Map © Google.
Why this score? — see what drove the C grade
The composite is a weighted blend of 9 inputs, each scored 0–100. Each bar is that input's sub-score; the figure is the points it added to the 100-point composite (weight × sub-score).
- Cash flow +22.2/30.0
- 1% rule +8.4/10.0
- ARV discount +7.5/15.0
- DSCR +7.1/10.0
- Schools +4.1/10.0
- Livability +3.0/5.0
- Condition / age +2.5/5.0
- Rent growth +2.3/5.0
- Appreciation +0.0/10.0
$105,000
🖨 Deal sheet (PDF) 📄 Offer letter ✓ Due diligence
Listing remarks
Welcome to Pinewood Condominiums! This stunning condo offers the perfect blend of comfort and convenience with its 2 bedrooms, 2 bathrooms, and tile flooring throughout. The kitchen comes equipped with a range & refrigerator. The inside washer & dryer combo is a plus. And the best part? Pets are welcome with approval! Imagine coming home to your furry friend waiting to greet you at the door. Step outside onto the screened lanai and enjoy the peaceful surroundings of the community. With a carport for your vehicle, you'll never have to worry about finding parking again. Schedule a showing today and make this condo your new home sweet home.
Key facts
- Screened lanai
- Carport
- Tile flooring
Tags
Property features AI
Finance
- Financial info: Pets allowed with conditions (call for details)
- HOA & community: Monthly association fee ($285) covering association management, grounds maintenance, road maintenance and street lights; Community amenities include barbecue area, picnic area and management; Condo-hotel community near hotel/motel with street lights; Senior community; 245 units in the community
Exterior
- Parking: Attached carport (1 covered space); Has carport (1 space)
- Utilities: Public water; Public sewer; Cable not available
- Home design: Single-story property; North-facing; Attached property (has property attached)
- Construction: Vinyl siding with wood frame construction; Shingle roof
- Exterior features: Fruit trees; Automatic sprinkler/irrigation; Lanai, porch and screened porch; Guest house attached; Zero lot line; Lot exposure faces south
Interior
- Kitchen: Range; Refrigerator
- Bedrooms: Includes a screened porch and great room (listed as room types)
- Flooring: Tile
- Bathrooms: 2 full bathrooms
- Heating & cooling: Central heating (electric); Central air conditioning (electric)
- Interior features: Impact glass windows; Window coverings / treatments; Eat-in kitchen; Living/dining room combination; Shower-only bathroom with separate shower; Walk-in closet(s)
- Laundry & utility: Washer and dryer inside
Neighborhood map
What this means for you Summary
Snapshot
- This is a 2-bed/2.0-bath condo listed at $105k.
Deal economics
- At list price, monthly cash flow is $170 ($2k/yr) — positive.
- The deal already cash-flows at list — no discount required.
- Meets the 1% rule at list price ($1k rent vs $105k).
- Recommended offer: $102k (3.0% below list) — sets the bar for market timing.
- Cap rate 8.2% vs local median 4.7% in Lehigh Acres — top-decile yield for the area; either an underpriced asset or a hidden risk that comps aren't pricing in. Stress-test before assuming the spread holds.
Location & tenants
- Location reads 59/100 on livability (#826 in FL) — a working-class tenant base; expect higher turnover. Strengths: cost of living A+, housing A+; Watch: crime C-, employment D+, schools D-.
- Lee (suburban): math 47% / reading 50% proficiency, ranked #42 of 73 in FL (top 58%) — families likely to look elsewhere, expect single-tenant / working-renter base with shorter leases.
- Market conditions: Rents soft (-0.8%/yr); 641 active listings in the ZIP; 40 comparable units currently listed for rent nearby; rentals at typical pace (median 25d on market — plan ~3-4 weeks tenant-placement turnaround); 15,411 units permitted in Lee County in 2024 (4,686 in 5+ unit buildings).
- This rent runs 33% of the median local income ($51k/yr) — at the standard rent-burdened threshold; future hikes will face affordability resistance.
Forward outlook
- Local home prices are declining (-3.0%/yr); year-one equity from $726 of loan paydown is wiped out by about $3k of value loss. Plan a longer hold.
- Lee County population projected at +44% by 2050 — long-run rental-demand tailwind backs the buy-and-hold thesis.
Negotiation context
- It's been on market 52 days — a 3% lower offer ($102k) is reasonable based on typical stale-listing flexibility.
- Current owner paid $19k; list at $105k implies a 461% gain — meaningful room to come down on a strong offer.
Risks & watch-outs
- Watch-outs: HOA is 20% of rent.
- Climate carrying-cost: severe wind risk, 99% chance of damaging wind over 30y; extreme-heat days projected 7→29/yr by 2055 (HVAC capex compounding) — expect insurance premiums to compound above CPI over the hold.
Questions for the listing agent
- It's been on market 52 days. Have you received any prior offers? Is the seller open to a 3% concession, seller financing, or rate buy-down credit?
- Built in 1978 — when were the roof, HVAC, electrical panel, plumbing, and water heater last replaced?
- What does the HOA fee cover, when was the last increase, and are there any pending special assessments or reserve-fund shortfalls?
- Any open or pending special assessments — roof, HVAC, plumbing, elevator, façade? What's the per-unit balance and payoff schedule, and is the seller paying it off at close or rolling it to the buyer?
- Is there a deadline driving the sale (1031 exchange, divorce, estate, relocation)? That informs how much negotiation room exists.
- Schools are D-rated, which usually means shorter tenancies and higher turnover. Who's the typical renter profile here, and what's been the actual vacancy rate?
- What's the average days-on-market for RENTAL listings here right now (not sales)? A rising rental-DOM trend means longer vacancies and softer asking-rent achievability than the comps imply.
- What's the recent tenant-quality profile in this submarket — average credit score on applications, eviction rate, late-payment / NSF rate, and stable-employment percentage? A property-management company in the area should have these aggregated.
- How much new apartment / multifamily construction is in the pipeline within 1–3 miles? Heavy new supply (>2% of stock underway) typically softens rents 12–24 months out; light construction supports rent growth.
Investment metrics
- 1% rule
- 1.34% ✓
- Cap rate
- 8.24%
- Cash-on-cash
- 6.95%
- DSCR
- 1.31
- GRM
- 6.2
CMA / ARV
No comps found within radius.
Projected returns pro-forma
-3.0% appreciation · 0.0% rent growth · sell at horizon
- IRR
- -9.8%
- Equity multiple
- 0.65×
- Total profit
- $-10,148
- Equity at exit
- $15,656
- IRR
- -6.5%
- Equity multiple
- 0.65×
- Total profit
- $-10,214
- Equity at exit
- $9,078
Cash invested: $29,400 (down + closing). Projections, not guarantees.
Landlord ↔ Tenant lean methodology
- Overall (STATE)
- 87 Strongly Landlord-Friendly
- State Florida
- 87 Strongly Landlord-Friendly · R+3
- County
- — inherits STATE
- City
- — inherits STATE
ZIP-level market 33936
- Home prices YoY
- -19.9%
- Rents YoY
- -0.8%
- Active inventory
- 641
- Price-to-rent
- 6.2×
Monthly cashflow live
- Estimated rent
- $1,410 high interval (Pro) →
- Mortgage (P&I)
- −$551
- Tax from tax record
- −$64 /mo · $773/yr
- Insurance
- −$44
- HOA
- −$285
- Vacancy / Maint / Mgmt
- −$296
- Net cashflow
- $170
Break-even live
Sensitivity live
| Price | -10% $230 | -5% $200 | +0% $170 | +5% $141 | +10% $111 |
|---|---|---|---|---|---|
| Rent | -10% $59 | -5% $115 | +0% $170 | +5% $226 | +10% $282 |
| Rate | -1.0pp $223 | -0.5pp $197 | base $170 | +0.5pp $143 | +1.0pp $115 |
UW: 25.0% down · 7.5% · 30yr · 1.5% tax · 5.0% vac · 8.0% maint · 8.0% mgmt
Financing live
Cash to close
- Down payment
- $26,250
- Closing costs
- $3,150
- Reserves months
- —
- Total cash needed
- —
Loan-product check · same deal, 3 products live
Conventional
25% down · 7.5% · 30yr
- Down + closing
- —
- Monthly P&I
- —
- Monthly cashflow
- —
- DSCR
- —
- Eligible?
- —
Personal DTI + credit; lowest rate.
DSCR
20% down · 8.5% · 30yr
- Down + closing
- —
- Monthly P&I
- —
- Monthly cashflow
- —
- DSCR
- —
- Eligible?
- —
No personal income docs; deal must DSCR.
Hard money
10% down · 12.0% · 12mo
- Down + closing
- —
- Monthly P&I
- —
- Monthly cashflow
- —
- DSCR
- —
- Eligible?
- —
Short-term bridge; refi at stabilization.
Rent comps 40 comps
| Address | Beds | Baths | Sqft | Rent | $/sqft | DOM | Units | Dist |
|---|---|---|---|---|---|---|---|---|
| 3 Desert Candle Cir Lehigh Acres, FL | 2.0 | 2.0 | 853 | $1,200 | $1.41 | 24d | 1 | 0.02mi |
| 6 Aztec Lily Ln Lehigh Acres, FL | 2.0 | 2.0 | 853 | $1,500 | $1.76 | 20d | 1 | 0.17mi |
| 6 Aztec Lily Ln Lehigh Acres, FL | 2.0 | 2.0 | 853 | $2,600 | $3.05 | 24d | 1 | 0.17mi |
| 11 California Rd Lehigh Acres, FL | 1.0 | 1.0 | 683 | $1,450 | $2.12 | 24d | 1 | 0.29mi |
| 907 Laredo Ave Lehigh Acres, FL | 1.0 | 1.0 | 636 | $1,000 | $1.57 | 24d | 1 | 0.30mi |
| 704 W Cleveland Ln Lehigh Acres, FL | 2.0 | 1.0 | 816 | $1,400 | $1.72 | 24d | 1 | 0.34mi |
| 26 Alabama Rd S Lehigh Acres, FL | 2.0 | 1.0 | 920 | $1,650 | $1.79 | 22d | 1 | 0.36mi |
| 10525 Putnam Ct Lehigh Acres, FL | 2.0 | 2.0 | 1014 | $1,250 | $1.23 | 20d | 1 | 0.39mi |
| 10554 Quincy Ct Lehigh Acres, FL | 2.0 | 2.0 | 1004 | $1,300 | $1.29 | 19d | 1 | 0.46mi |
| 201 Alabama Rd S Lehigh Acres, FL | 3.0 | 1.0 | 920 | $1,275 | $1.39 | 3d | 1 | 0.46mi |
| 102 Connecticut Rd Lehigh Acres, FL | 2.0 | 1.0 | 816 | $1,300 | $1.59 | 24d | 1 | 0.46mi |
| 44 Tangelo Ct Lehigh Acres, FL | 2.0 | 2.0 | 812 | $1,150 | $1.42 | 4d | 1 | 0.47mi |
| 10578 Quincy Ct Unit 1 Lehigh Acres, FL | 2.0 | 2.0 | 899 | $1,275 | $1.42 | 24d | 1 | 0.49mi |
| 47 Tangelo Ct Lehigh Acres, FL | 2.0 | 2.0 | 812 | $1,150 | $1.42 | 24d | 1 | 0.49mi |
| 9 Hamlin Ct Lehigh Acres, FL | 1.0 | 1.5 | 807 | $950 | $1.18 | 4d | 1 | 0.52mi |
| 46 Hamlin Ct Lehigh Acres, FL | 2.0 | 2.0 | 812 | $1,050 | $1.29 | 24d | 1 | 0.53mi |
| 10625 Windsmont Ct Lehigh Acres, FL | 3.0 | 2.0 | 1080 | $1,350 | $1.25 | 24d | 1 | 0.58mi |
| 10 Tangerine Ct Lehigh Acres, FL | 2.0 | 2.0 | 812 | $1,200 | $1.48 | 19d | 1 | 0.59mi |
| 1113 Vineyard St Lehigh Acres, FL | 3.0 | 2.0 | 1004 | $1,500 | $1.49 | 24d | 1 | 0.59mi |
| 1120 Vineyard St Lehigh Acres, FL | 2.0 | 1.0 | 1028 | $1,300 | $1.26 | 24d | 1 | 0.60mi |
| 305 Bougainvillea Rd W Lehigh Acres, FL | 1.0 | 1.0 | 742 | $1,295 | $1.75 | 24d | 1 | 0.64mi |
| 106 Leeland Heights Blvd W Lehigh Acres, FL | 1.0 | 1.0 | 794 | $1,450 | $1.83 | 24d | 1 | 0.64mi |
| 9161 Aegean Cir Lehigh Acres, FL | 2.0 | 2.0 | 1120 | $1,650 | $1.47 | 14d | 1 | 0.67mi |
| 9137 Aegean Cir Lehigh Acres, FL | 2.0 | 2.0 | 1120 | $1,474 | $1.32 | 4d | 1 | 0.70mi |
| 9137 Aegean Cir Lehigh Acres, FL | 2.0 | 2.0 | 1120 | $1,474 | $1.32 | 24d | 1 | 0.70mi |
| 9123 Aegean Cir Lehigh Acres, FL | 2.0 | 2.0 | 1120 | $1,474 | $1.32 | 3d | 1 | 0.74mi |
| 1000 Monroe Dr Lehigh Acres, FL | 3.0 | 2.0 | 984 | $1,650 | $1.68 | 24d | 1 | 0.76mi |
| 9099 Aegean Cir Lehigh Acres, FL | 2.0 | 2.0 | 1120 | $1,499 | $1.34 | 24d | 1 | 0.79mi |
| 110 Texas Rd Lehigh Acres, FL | 3.0 | 1.0 | 1118 | $1,750 | $1.57 | 16d | 1 | 0.82mi |
| 216 Oregon Way Lehigh Acres, FL | 3.0 | 1.0 | 920 | $1,250 | $1.36 | 22d | 1 | 0.83mi |
| 18461 Copperhead Ct N #444 Lehigh Acres, FL | 2.0 | 2.0 | 1120 | $2,300 | $2.05 | 24d | 1 | 0.84mi |
| 423 Morgan Cir S Lehigh Acres, FL | 3.0 | 1.0 | 920 | $1,450 | $1.58 | 24d | 1 | 0.88mi |
| 1112 Gifford Ave S Lehigh Acres, FL | 2.0 | 2.0 | 880 | $1,350 | $1.53 | 4d | 1 | 0.91mi |
| 1112 Gifford Ave S Lehigh Acres, FL | 2.0 | 2.0 | 880 | $1,350 | $1.53 | 24d | 1 | 0.91mi |
| 18411 Copperhead Dr #346 Lehigh Acres, FL | 2.0 | 2.0 | 1061 | $1,695 | $1.60 | 22d | 1 | 0.92mi |
| 28 Cosmopolitan Dr #13 Lehigh Acres, FL | 2.0 | 2.0 | 973 | $1,375 | $1.41 | 15d | 1 | 1.00mi |
| 10 Beth Stacey Blvd #206 Lehigh Acres, FL | 2.0 | 2.0 | 1012 | $1,100 | $1.09 | 4d | 1 | 1.00mi |
| 1423 Caywood Cir S Lehigh Acres, FL | 2.0 | 2.0 | 960 | $1,376 | $1.43 | 4d | 1 | 1.09mi |
| 111 Yellowtail Loop #3 Lehigh Acres, FL | 2.0 | 2.0 | 1100 | $1,750 | $1.59 | 24d | 1 | 1.12mi |
| 219 Beth Stacey Blvd Lehigh Acres, FL | 2.0 | 2.0 | 997 | $1,300 | $1.30 | 22d | 1 | 1.17mi |
HOA detail condo
- Monthly dues
- $285 · $3,420/yr
- Assessments
- None detected in remarks — confirm with the listing agent.
Listing history 13 events
-
2026-06-15days on market $105,000 Active 52 DOM
-
2026-06-13days on market $105,000 Active 50 DOM
-
2026-06-10days on market $105,000 Active 47 DOM
-
2026-06-09days on market $105,000 Active 46 DOM
-
2026-06-08days on market $105,000 Active 45 DOM
-
2026-06-07days on market $105,000 Active 44 DOM
-
2026-06-03days on market $105,000 Active 40 DOM
-
2026-06-02days on market $105,000 Active 39 DOM
-
2026-06-01days on market $105,000 Active 38 DOM
-
2026-05-31days on market $105,000 Active 37 DOM
-
2026-04-21$105,000 Active
-
1998-05-18soldstatus $18,700
-
1998-05-18soldstatus $45,000
ⓘ Source: listings_history table (triggers on properties + properties_extension) + one-shot
backfill from property_details.listing_events for pre-trigger history.
Tax reassessment forecast FL · Resets to sale price
- Current annual tax
- $773 · $64/mo
- Projected year-2 tax
- $872 · $73/mo
- Expected delta
- +$98/yr (+$8/mo · 12.7%)
ⓘ Screening estimate from a state-policy table — verify with the county assessor before closing.
Climate risk First Street
- Flood 4/10 Moderate FEMA zone X (unshaded) · 22% chance over 30 yrs
- Wildfire 2/10 Low
- Heat 10/10 Extreme 7 d/yr ≥108°F today · 29 d/yr by 30 yrs out
- Wind 10/10 Extreme 99% chance of damaging wind over 30 yrs
- Air quality 2/10 Low 1 unhealthy d/yr today · 2 by 30 yrs out
Nearby sold comps map
Loading sold comps map…
Walkable amenities ~0.75 mi
Loading nearby amenities…
Taxation est. · year 1
- Rental income
- $16,923
- − Mortgage interest
- −$5,882
- − Property taxes
- −$773
- − Insurance
- −$525
- − Repairs & maintenance
- −$1,354
- − Management
- −$1,354
- − HOA
- −$3,420
- − Depreciation
- −$3,055
- Taxable income
- $561
- Est. tax owed @ 24.0%
- −$135
- After-tax cash flow
- $1,909/yr
For passive investors: Depreciation is non-cash, so a rental often shows a tax loss while cash-flowing — sheltering income. Rental losses are passive: they offset passive income freely, and up to $25,000/yr can offset ordinary (W-2) income if you actively participate and your MAGI is under $100k (phasing out to $0 by $150k); unused losses carry forward. On sale, claimed depreciation is recaptured at up to 25%, and gains may owe capital-gains tax (a 1031 exchange can defer both). Figures are a year-1 estimate at your 24.0% rate — not tax advice; consult a CPA.
Schools (NCES district)
- District
- Lee
- NCES district ID
- 1201080
- Math proficiency
- 47% ▼ -11.00%
- Reading proficiency
- 50% ▼ -4.00%
- Median HH income
- $49,518
- Composite
- 41.49/100
- National rank
- #3458
- State rank
- #42 of 73 in FL
Livability — Lehigh Acres
- Score
- 59/100
- State rank
- #826
- US rank
- #20055
Category grades
Schools grade is shown separately in the Schools card above.
Census & demographics
- Census place
- Lehigh Acres, FL
- County
- Lee County · 788,662 people
- City population
- 130,638
- Metro
- Cape Coral-Fort Myers, FL
- Population (ZIP)
- 27,967
- Household income
- $51,417
- Rent vs Own
- Severe rent burden
- 1027.0
Population outlook (Lee County) Hauer SSP2
- Today (2025)
- 871,946 people
- By 2030
- 955,468 · +9.6%
- By 2040
- 1,113,587 · +27.7%
- By 2050
- 1,256,891 · +44.1%
- By 2075
- 1,560,270 · +78.9%
- By 2100
- 1,726,848 · +98.0%
Race, ethnicity, and origin ACS 2023
- Neighborhood character
- Diverse neighborhood (Simpson 0.63)
- Race & ethnicity
- Hispanic / Latino 44% White 41% Two or more races 21% Black 9% Asian 1%
- Hispanic origin (detail)
- Mexican 7% Puerto Rican 9% Cuban 18% Dominican 2%
- Common ancestry
- Hispanic 3% Romanian 2% Lithuanian 1%
- Foreign-born
- 28% · Canada, Jamaica
- Languages at home
- 59% English-only · Spanish 36% French/Haitian/Cajun 3% Tagalog/Filipino 1%
Political lean MEDSL · Lee
- 2024 margin
- Strong R (+28.4) · D 35.5% · R 63.9%
- 2008→2024 swing
- -18.0pp toward R · 2008: -10.4pp · 2024: -28.4pp
- All cycles
- 2024: R+28.4 2020: R+19.2 2016: R+20.4 2012: R+16.6 2008: R+10.4
Not yet ingested
- Civics
- —
Market trends
- HPI YoY
- ▼ -86.78%
- Current HPI
- 348.8631
- Rent YoY
- ▼ -0.77%
- Metro
- Cape Coral-Fort Myers, FL
- State GDP YoY
- ▲ 3.28%
- F500 in state
- 36
Industry mix (Fortune 500 HQ in FL)
| Industry | F500 HQs | Revenue |
|---|---|---|
| Industrial Technology | 2 | $29B |
|
||
| Insurance | 2 | $17B |
|
||
| Retail | 1 | $60B |
|
||
| Technology Distribution | 1 | $58B |
|
||
| Homebuilding | 1 | $35B |
|
||
| Technology Manufacturing | 1 | $35B |
|
||
Price history
+461.5% since first listed3 events — show timeline
- 2026-04-21 Listed $105,000 FORTMLS
- 1998-05-18 Sold (Public Records) $45,000 Public Records
- 1998-05-18 Sold (Public Records) $18,700 Public Records
Property tax history
+10.2%/yrLatest (2025): $773 · +13.1% YoY. Source: county tax records.
Cash-flow waterfall
monthlySold comps — $/sqft
last 12 mo · ≤1 miLoading sold comps…